Popup confirmation for Delete Button in GridView
•Download as DOCX, PDF•
0 likes•24 views

This displays a Confirmation message when the user clicks on Delete Button in GridView. This prevents accidental deletion of rows in a GridView.
Report
Share
Report
Share

Recommended
Providing sl no in Gridview in Dot Net
This document provides steps to add a serial number column to a gridview in Visual Web Developer. It involves dragging a gridview onto a webform, configuring a data source, adding a template field to the gridview and using code to populate each row with its index number to display sequential serial numbers.
How to add sql server table into dot net web page (Gridview)
Addition of SQL Server Table into a simple dot net webpage. This program helps you to display SQL Server Table data in a Grid View
How to add sorting and pagers to grid view
This document provides instructions for adding sorting and paging functionality to a GridView control in an ASP.NET web form application. It describes dragging a GridView onto the web form, connecting it to a data source, enabling sorting and paging checkboxes in the GridView task menu, and modifying the page size property to control how many rows display per page. Changing the page size value allows viewing the effect of paging through multiple pages of records in the GridView.
Web services in asp.net
This document provides instructions for creating a web service in ASP.NET (VB code) with three methods - one each for adding and subtracting two numbers, and another for connecting to a SQL database. It describes creating a web service project, adding methods to perform basic math operations, testing the service, consuming it in a web page, and includes sample code for connecting the web service to a SQL database.
Sql connected architecture
This document provides instructions for connecting a C# and ASP.NET web application to a SQL database using ADO.NET. It describes how to create a database in SQL Server Management Studio, add a web form to a Visual Studio project, and configure a connection to the database through the Server Explorer. When the button is clicked, code is written to retrieve data from the database using the connection string.
Uninstallting microsoft sql server 2016
The document provides steps to uninstall Microsoft SQL Server 2016 from a server. It instructs the user to stop the SQL Server and SQL Agent services, open Programs and Features in Control Panel, right click SQL Server 2016 and select Remove. This will open the Remove window where the user can select the instance and features to uninstall. The removal process and completion will then be shown.
Global Workholding FEA Only - PP
Finite element analysis allows engineers to create a 3D model of a part, apply the correct material properties, and simulate how the part will deform under different loads such as clamping forces. This helps verify that enough clamping force is applied to hold the part securely without causing unwanted deformation. The software can also visualize how the material will displace under the simulated loads, providing precise predictions rather than relying on guesses or opinions.
Oracle Fusion Web Clock Setup(Oracle Time and Labor)
Document will guide you through the Web Clock Setup process in Oracle HCM Fusion. Document have screenshots which will help you to use easily.
Grid view control
The GridView control allows displaying, editing, and deleting tabular data from various data sources. It can be bound to a data source by selecting it in the properties pane. Display options like styles, paging, sorting, editing and deleting can be configured. The control supports automatic and programmatic editing/deleting. Data binding with the GridView can also be done by writing code using a data adapter to fill a dataset and set it as the data source.
Grid Vew Control VB
This document provides instructions for binding data to a GridView control in ASP.NET using Visual Basic. It describes adding a GridView control to a web form, connecting it to a Microsoft Access database in the App_Data folder using the wizard approach and code behind approach. The key steps include adding the GridView and AccessDataSource controls, selecting the database and table, and writing code to execute a query and bind the results to the GridView. It also provides explanations of the code and suggestions for modifications to try.
Qlikview Quick Start
This tutorial will help you to getting start on QlikView product.
After study this tutorial you will be able to create dashboard on QlikView. This tutorial best for beginners.
Bootstrap with liferay
The document discusses integrating Bootstrap version 2.3.2 and 3.0 with Liferay 6.2. It explains that Liferay 6.2 includes Bootstrap 2.3.2 by default. While Bootstrap 3.0 was released around the same time, it was not included because it dropped support for older browsers and required major changes that could introduce bugs. The document provides an overview of the differences between Bootstrap 2.3.2 and 3.0 grids and classes. It also discusses steps to create a Liferay theme with either Bootstrap version, and lists CSS classes that may conflict and need overrides when using Bootstrap 3.0 with Liferay 6.2.
Grid View Control CS
The document provides instructions for binding data to a GridView control using both a wizard and code behind methods in C#. It includes steps to add a GridView control to an ASP.NET page, connect it to a sample database in App_Data, and display data in the GridView. It also explains the code used for data binding and modifying the GridView. Troubleshooting steps are provided for introducing errors to learn from exceptions.
Chapter12 (1)
This chapter covers controls that display and maintain data on web sites, including the GridView, DetailsView, and SqlDataSource controls. It discusses how to display, insert, edit, and delete data using these controls while maintaining data integrity. The chapter also covers storing connection strings and using templates and paging with data controls.
Chapter 16
The document discusses three advanced ASP.NET controls - GridView, DetailsView, and FormView - that allow binding tables of data. GridView is for large tables, DetailsView and FormView show single records and support editing. It provides code examples for configuring these controls, binding them to data sources, handling events, and implementing features like sorting, paging, selection and editing.
IntoTheNebulaArticle.pdf
This Article explores the Test Automation challenges associated with the GridGain Control Centre (https://www.gridgain.com/).
The test framework is based on BDD/Selenide/Java/IntelliJ.
The exploratory tests look at five key User Journeys in the application.
IntoTheNebulaArticle.pdf
GridGain management console testing using a (BDD/Java/Selenide) Test Automation solution. This article provides the basis for an industrial solution.
SAP HANA -Analytic view creation
The document outlines the 7 major steps to create an analytic view in SAP HANA:
1) Give the analytic view a technical name
2) Select the tables from the database to include
3) Optionally select an attribute view to enhance the analytic view
4) Define the data foundation by selecting attributes and measures
5) Optionally create a logical view to define joins between tables and attribute views
6) Save and activate the analytic view
7) Preview the data in the analytic view to ensure it looks as expected
Creating a dot netnuke
This document provides instructions for creating a DotNetNuke module using LINQ to SQL. It describes setting up the development environment with DotNetNuke and Visual Studio, creating a database table, generating a LINQ to SQL class to access the database, and building the module interface with ASP.NET controls bound to a LINQ data source. The module allows users to view, insert, update and delete records in the database table through a GridView and FormView control.
How to create drill down dashboard
This document provides a step-by-step tutorial for creating a drill down dashboard using InfoCaptor Dashboard Software. It describes 45 steps to build a dashboard with a parent chart filtered by product line that dynamically filters two child widgets - a pivot table filtered by region and a Sankey flow diagram. Key steps include selecting data, visualizing charts and filters, linking the child widgets to the parent chart filter, and adding a dashboard parameter for additional filtering. The end result is an interactive dashboard with connected visualizations that can be drilled down in multiple dimensions.
Quick View For Magento 2
MageAnts introduces Quick view Extension for Magento 2, It provides Light box style popup and displays all information of the product.Download it with our 90 days FREE support.
IBM developerWorks Cloud Trial – 90 days
IBM developerWorks Cloud Trial: Creating an Application Workload service: How to complete the wizard for provisioning an Application Workload service, how to monitor the provisioning of the service, how to log into the provisioned service, how to customize it.
Lab StepsSTEP 1 Login Form1. In order to do this lab, we need.docx
Lab Steps
STEP 1: Login Form
1. In order to do this lab, we need to assign a primary key to the tblUserLogin table. This will allow us to modify the user login table from our Manage Users form that we will create later. Go to Windows Explorer and open the PayrollSystem_DB.accdb. Set the UserID as the Primary key and save the table. Close the database.
2. Open Microsoft Visual Studio.NET.
3. Click the ASP.NET website named PayrollSystem to open it.
4. Create a new Web form named frmLogin.
5. Add the ACIT logo to the top of the frmLogin page. Do not hyperlink the logo.
6. Under the login controls, you will see Login. Drop the Login control onto the form. Set the properties of the login control as follows:
Property
Value
DestinationPageUrl
frmMain.aspx
TitleText
Please enter your UserName and Password in order to log in to the system.
7. Highlight everything in the form, then click Format, Justify, Center. Save your work.
8. Go to the
Solution
Explorer, right-click on frmLogin, and left-click on Set As Start Page.
Then run the website to check if the Web form appears correctly.
If you receive an error, add the following code to the web.config file right above the </configuration> line:
<appSettings>
<add key="ValidationSettings:UnobtrusiveValidationMode" value="None" />
</appSettings>
STEP 2: Login Check
9. Create a new DataSet called dsUser. Use the table tblUserLogin as the database table for this dataset. Do this in the same way that you added datasets in the previous labs.
10. Open the clsDataLayer and add the following function:
// This function verifies a user in the tblUser table
public static dsUser VerifyUser(string Database, string UserName, string UserPassword)
{
// Add your comments here
dsUser DS;
OleDbConnection sqlConn;
OleDbDataAdapter sqlDA;
// Add your comments here
sqlConn = new OleDbConnection("PROVIDER=Microsoft.ACE.OLEDB.12.0;" +
"Data Source=" + Database);
// Add your comments here
sqlDA = new OleDbDataAdapter("Select SecurityLevel from tblUserLogin " +
"where UserName like '" + UserName + "' " +
"and UserPassword like '" + UserPassword + "'", sqlConn);
// Add your comments here
DS = new dsUser();
// Add your comments here
sqlDA.Fill(DS.tblUserLogin);
// Add your comments here
return DS;
}
11. Double-click on the login control that you added. Add the following code to the login control Authenticate event handler:
// Add your comments here
dsUser dsUserLogin;
// Add your comments here
string SecurityLevel;
// Add your comments here
dsUserLogin = clsDataLayer.VerifyUser(Server.MapPath("PayrollSystem_DB.accdb"),
Login1.UserName, Login1.Password);
// Add your comments here
if (dsUserLogin.tblUserLogin.Count < 1)
{
e.Authenticated = false;
return;
}
// Add your comments here
SecurityLevel = dsUserLogin.tblUserLogin[0].SecurityLevel.ToString();
// Add your comments here
switch (SecurityLevel)
{
case "A":
// Add your comments here
e.Authenticated = true;
Session["SecurityLevel"] = "A";
break;
case "U":
// Add your comments ...
Journey to Azure Sentinel
Microsoft Azure Sentinel is a new Cloud native SIEM service with built-in AI for analytics that removes the cost and complexity of achieving a central and focused near real-time view of the active threats in your environment. Koby Koren from the Azure Sentinel engineering team walks through the entire solution with an end-to-end demonstration from how to set it up, perform queries, investigations and more.
Azure Sentinel is in preview today. Follow the link to try for yourself https://aka.ms/AzureSentinel
Database development connection steps
This document provides instructions for configuring the database development view in Eclipse to access and work with a Derby database. It describes how to install the database development plugin, create a new Derby connection, specify driver details, and access the Derby database from the command line. It also gives an overview of exploring the database structure in Eclipse and editing, loading, and extracting data from tables.
Hands on With Advanced Data Grid
In this hands-on sessions with the Advanced Data Grid, you will get to build an interface using complex grid and excel like ui.
Database Connection
- The document discusses setting up Microsoft Access databases and connecting them to a Visual Basic project to display data in forms using DataGridView controls.
- It provides steps for adding a database file to a project, configuring a data connection, selecting tables and columns as data sources, and formatting DataGridView controls to display the bound data.
- Two forms are created - one to display course data and another for student data by dragging DataGridView controls and configuring them to show records from tables in the Access database file.
GWT training session 2
This document provides an overview of client-side widgets in Google Web Toolkit (GWT). It discusses static widgets like Labels and Images, form widgets like Buttons and Checkboxes, and complex widgets like ListBoxes. Code samples are provided to demonstrate how to create and style these widgets. The document is intended for a GWT training session on building user interfaces with widgets.
Master slave control in gridview
The document describes how to create a master-slave relationship between two grid views in Visual Web Developer. It involves setting up the first grid view to display the "master" table and enable row selection. The second grid view is used to display the "slave" or child table, with its data source configured to show only rows that match the selected row key from the first grid view. Clicking a row in the master grid view will then display the related rows from the slave table in the other grid view below it.
Change row colour based on some condition
This document provides steps to change the color of rows in a GridView based on certain conditions:
1. Drag and drop a GridView onto a page and connect it to a database table.
2. In the GridView's RowDataBound event, check each row's status value.
3. If the status is "Rejected", set the row's back color to orange. If the status is "Accepted", set the back color to green.
This allows drawing attention to rows with different status values by displaying them in distinct colors.
More Related Content
Similar to Popup confirmation for Delete Button in GridView
Grid view control
The GridView control allows displaying, editing, and deleting tabular data from various data sources. It can be bound to a data source by selecting it in the properties pane. Display options like styles, paging, sorting, editing and deleting can be configured. The control supports automatic and programmatic editing/deleting. Data binding with the GridView can also be done by writing code using a data adapter to fill a dataset and set it as the data source.
Grid Vew Control VB
This document provides instructions for binding data to a GridView control in ASP.NET using Visual Basic. It describes adding a GridView control to a web form, connecting it to a Microsoft Access database in the App_Data folder using the wizard approach and code behind approach. The key steps include adding the GridView and AccessDataSource controls, selecting the database and table, and writing code to execute a query and bind the results to the GridView. It also provides explanations of the code and suggestions for modifications to try.
Qlikview Quick Start
This tutorial will help you to getting start on QlikView product.
After study this tutorial you will be able to create dashboard on QlikView. This tutorial best for beginners.
Bootstrap with liferay
The document discusses integrating Bootstrap version 2.3.2 and 3.0 with Liferay 6.2. It explains that Liferay 6.2 includes Bootstrap 2.3.2 by default. While Bootstrap 3.0 was released around the same time, it was not included because it dropped support for older browsers and required major changes that could introduce bugs. The document provides an overview of the differences between Bootstrap 2.3.2 and 3.0 grids and classes. It also discusses steps to create a Liferay theme with either Bootstrap version, and lists CSS classes that may conflict and need overrides when using Bootstrap 3.0 with Liferay 6.2.
Grid View Control CS
The document provides instructions for binding data to a GridView control using both a wizard and code behind methods in C#. It includes steps to add a GridView control to an ASP.NET page, connect it to a sample database in App_Data, and display data in the GridView. It also explains the code used for data binding and modifying the GridView. Troubleshooting steps are provided for introducing errors to learn from exceptions.
Chapter12 (1)
This chapter covers controls that display and maintain data on web sites, including the GridView, DetailsView, and SqlDataSource controls. It discusses how to display, insert, edit, and delete data using these controls while maintaining data integrity. The chapter also covers storing connection strings and using templates and paging with data controls.
Chapter 16
The document discusses three advanced ASP.NET controls - GridView, DetailsView, and FormView - that allow binding tables of data. GridView is for large tables, DetailsView and FormView show single records and support editing. It provides code examples for configuring these controls, binding them to data sources, handling events, and implementing features like sorting, paging, selection and editing.
IntoTheNebulaArticle.pdf
This Article explores the Test Automation challenges associated with the GridGain Control Centre (https://www.gridgain.com/).
The test framework is based on BDD/Selenide/Java/IntelliJ.
The exploratory tests look at five key User Journeys in the application.
IntoTheNebulaArticle.pdf
GridGain management console testing using a (BDD/Java/Selenide) Test Automation solution. This article provides the basis for an industrial solution.
SAP HANA -Analytic view creation
The document outlines the 7 major steps to create an analytic view in SAP HANA:
1) Give the analytic view a technical name
2) Select the tables from the database to include
3) Optionally select an attribute view to enhance the analytic view
4) Define the data foundation by selecting attributes and measures
5) Optionally create a logical view to define joins between tables and attribute views
6) Save and activate the analytic view
7) Preview the data in the analytic view to ensure it looks as expected
Creating a dot netnuke
This document provides instructions for creating a DotNetNuke module using LINQ to SQL. It describes setting up the development environment with DotNetNuke and Visual Studio, creating a database table, generating a LINQ to SQL class to access the database, and building the module interface with ASP.NET controls bound to a LINQ data source. The module allows users to view, insert, update and delete records in the database table through a GridView and FormView control.
How to create drill down dashboard
This document provides a step-by-step tutorial for creating a drill down dashboard using InfoCaptor Dashboard Software. It describes 45 steps to build a dashboard with a parent chart filtered by product line that dynamically filters two child widgets - a pivot table filtered by region and a Sankey flow diagram. Key steps include selecting data, visualizing charts and filters, linking the child widgets to the parent chart filter, and adding a dashboard parameter for additional filtering. The end result is an interactive dashboard with connected visualizations that can be drilled down in multiple dimensions.
Quick View For Magento 2
MageAnts introduces Quick view Extension for Magento 2, It provides Light box style popup and displays all information of the product.Download it with our 90 days FREE support.
IBM developerWorks Cloud Trial – 90 days
IBM developerWorks Cloud Trial: Creating an Application Workload service: How to complete the wizard for provisioning an Application Workload service, how to monitor the provisioning of the service, how to log into the provisioned service, how to customize it.
Lab StepsSTEP 1 Login Form1. In order to do this lab, we need.docx
Lab Steps
STEP 1: Login Form
1. In order to do this lab, we need to assign a primary key to the tblUserLogin table. This will allow us to modify the user login table from our Manage Users form that we will create later. Go to Windows Explorer and open the PayrollSystem_DB.accdb. Set the UserID as the Primary key and save the table. Close the database.
2. Open Microsoft Visual Studio.NET.
3. Click the ASP.NET website named PayrollSystem to open it.
4. Create a new Web form named frmLogin.
5. Add the ACIT logo to the top of the frmLogin page. Do not hyperlink the logo.
6. Under the login controls, you will see Login. Drop the Login control onto the form. Set the properties of the login control as follows:
Property
Value
DestinationPageUrl
frmMain.aspx
TitleText
Please enter your UserName and Password in order to log in to the system.
7. Highlight everything in the form, then click Format, Justify, Center. Save your work.
8. Go to the
Solution
Explorer, right-click on frmLogin, and left-click on Set As Start Page.
Then run the website to check if the Web form appears correctly.
If you receive an error, add the following code to the web.config file right above the </configuration> line:
<appSettings>
<add key="ValidationSettings:UnobtrusiveValidationMode" value="None" />
</appSettings>
STEP 2: Login Check
9. Create a new DataSet called dsUser. Use the table tblUserLogin as the database table for this dataset. Do this in the same way that you added datasets in the previous labs.
10. Open the clsDataLayer and add the following function:
// This function verifies a user in the tblUser table
public static dsUser VerifyUser(string Database, string UserName, string UserPassword)
{
// Add your comments here
dsUser DS;
OleDbConnection sqlConn;
OleDbDataAdapter sqlDA;
// Add your comments here
sqlConn = new OleDbConnection("PROVIDER=Microsoft.ACE.OLEDB.12.0;" +
"Data Source=" + Database);
// Add your comments here
sqlDA = new OleDbDataAdapter("Select SecurityLevel from tblUserLogin " +
"where UserName like '" + UserName + "' " +
"and UserPassword like '" + UserPassword + "'", sqlConn);
// Add your comments here
DS = new dsUser();
// Add your comments here
sqlDA.Fill(DS.tblUserLogin);
// Add your comments here
return DS;
}
11. Double-click on the login control that you added. Add the following code to the login control Authenticate event handler:
// Add your comments here
dsUser dsUserLogin;
// Add your comments here
string SecurityLevel;
// Add your comments here
dsUserLogin = clsDataLayer.VerifyUser(Server.MapPath("PayrollSystem_DB.accdb"),
Login1.UserName, Login1.Password);
// Add your comments here
if (dsUserLogin.tblUserLogin.Count < 1)
{
e.Authenticated = false;
return;
}
// Add your comments here
SecurityLevel = dsUserLogin.tblUserLogin[0].SecurityLevel.ToString();
// Add your comments here
switch (SecurityLevel)
{
case "A":
// Add your comments here
e.Authenticated = true;
Session["SecurityLevel"] = "A";
break;
case "U":
// Add your comments ...
Journey to Azure Sentinel
Microsoft Azure Sentinel is a new Cloud native SIEM service with built-in AI for analytics that removes the cost and complexity of achieving a central and focused near real-time view of the active threats in your environment. Koby Koren from the Azure Sentinel engineering team walks through the entire solution with an end-to-end demonstration from how to set it up, perform queries, investigations and more.
Azure Sentinel is in preview today. Follow the link to try for yourself https://aka.ms/AzureSentinel
Database development connection steps
This document provides instructions for configuring the database development view in Eclipse to access and work with a Derby database. It describes how to install the database development plugin, create a new Derby connection, specify driver details, and access the Derby database from the command line. It also gives an overview of exploring the database structure in Eclipse and editing, loading, and extracting data from tables.
Hands on With Advanced Data Grid
In this hands-on sessions with the Advanced Data Grid, you will get to build an interface using complex grid and excel like ui.
Database Connection
- The document discusses setting up Microsoft Access databases and connecting them to a Visual Basic project to display data in forms using DataGridView controls.
- It provides steps for adding a database file to a project, configuring a data connection, selecting tables and columns as data sources, and formatting DataGridView controls to display the bound data.
- Two forms are created - one to display course data and another for student data by dragging DataGridView controls and configuring them to show records from tables in the Access database file.
GWT training session 2
This document provides an overview of client-side widgets in Google Web Toolkit (GWT). It discusses static widgets like Labels and Images, form widgets like Buttons and Checkboxes, and complex widgets like ListBoxes. Code samples are provided to demonstrate how to create and style these widgets. The document is intended for a GWT training session on building user interfaces with widgets.
Similar to Popup confirmation for Delete Button in GridView (20)
Lab StepsSTEP 1 Login Form1. In order to do this lab, we need.docx
Lab StepsSTEP 1 Login Form1. In order to do this lab, we need.docx
More from Dharma Raju
Master slave control in gridview
The document describes how to create a master-slave relationship between two grid views in Visual Web Developer. It involves setting up the first grid view to display the "master" table and enable row selection. The second grid view is used to display the "slave" or child table, with its data source configured to show only rows that match the selected row key from the first grid view. Clicking a row in the master grid view will then display the related rows from the slave table in the other grid view below it.
Change row colour based on some condition
This document provides steps to change the color of rows in a GridView based on certain conditions:
1. Drag and drop a GridView onto a page and connect it to a database table.
2. In the GridView's RowDataBound event, check each row's status value.
3. If the status is "Rejected", set the row's back color to orange. If the status is "Accepted", set the back color to green.
This allows drawing attention to rows with different status values by displaying them in distinct colors.
Windows Communication Foundation (WCF) programming using Visual Studio
The document describes how to create a simple WCF service in Visual Studio 2013 to perform mathematical calculations. It involves creating a WCF service application project, adding a WCF service item, implementing methods to add and subtract two numbers, building and running the service, and then consuming the service methods from an ASP.NET web form to display the results of calculations entered by the user at runtime.
Internal tables in sap
Internal Tables in SAP by Dharmaraju BK. An easy to use book written by a programmer for the programmers.
Govina haadu
The document discusses the results of a study on the impact of climate change on coffee production. Researchers found that suitable land for coffee production could decline by up to 50% by 2050 due to rising temperatures and changing rain patterns associated with climate change. Arabica coffee was found to be especially threatened, as its growing regions may shrink by 88% under a business-as-usual scenario of increasing greenhouse gas emissions. The study concludes that climate change poses a severe risk to the coffee industry worldwide.
Coffee
The document tells a story using three pots as metaphors for how people can respond to difficulties in life. The first pot holds carrots that soften when boiled, representing people who become weak when facing problems. The second pot holds eggs that harden when boiled, representing people who become bitter and hard-hearted with difficulties. The third pot holds coffee beans that change the water with their flavor, representing people who are able to grow and improve themselves and their environment through challenges. The document encourages the reader to be like the coffee beans and make the most of hard times.
More from Dharma Raju (6)
Windows Communication Foundation (WCF) programming using Visual Studio
Windows Communication Foundation (WCF) programming using Visual Studio
Recently uploaded
国外证书(Lincoln毕业证)新西兰林肯大学毕业证成绩单不能毕业办理
退学办理新西兰林肯大学毕业证【微信176555708】学历认证怎么做:原版仿制新西兰林肯大学电子版成绩单毕业证认证【新西兰林肯大学毕业证成绩单】、新西兰林肯大学文凭证书成绩单复刻offer录取通知书、购买Lincoln圣力嘉学院本科毕业证、【新西兰林肯大学毕业证办理Lincoln毕业证书哪里买】、新西兰林肯大学 Offer在线办理Lincoln Offer新西兰林肯大学Bachloer Degree。1客户提供办理信息:姓名生日专业学位毕业时间等(如信息不确定可以咨询顾问:微信176555708我们有专业老师帮你查询);
2开始安排制作毕业证成绩单电子图;
3毕业证成绩单电子版做好以后发送给您确认;
4毕业证成绩单电子版您确认信息无误之后安排制作成品;
5成品做好拍照或者视频给您确认;
6快递给客户(国内顺丰国外DHLUPS等快读邮寄)。
7完成交易删除客户资料
高精端提供以下服务:
一:新西兰林肯大学新西兰林肯大学毕业证文凭证书全套材料从防伪到印刷水印底纹到钢印烫金
二:真实使馆认证(留学人员回国证明)使馆存档
三:真实教育部认证教育部存档教育部留服网站可查
四:留信认证留学生信息网站可查
五:与学校颁发的相关证件1:1纸质尺寸制定(定期向各大院校毕业生购买最新版本毕,业证成绩单保证您拿到的是鲁昂大学内部最新版本毕业证成绩单微信176555708)
A.为什么留学生需要操作留信认证?
留信认证全称全国留学生信息服务网认证,隶属于北京中科院。①留信认证门槛条件更低,费用更美丽,并且包过,完单周期短,效率高②留信认证虽然不能去国企,但是一般的公司都没有问题,因为国内很多公司连基本的留学生学历认证都不了解。这对于留学生来说,这就比自己光拿一个证书更有说服力,因为留学学历可以在留信网站上进行查询!
B.为什么我们提供的毕业证成绩单具有使用价值?
查询留服认证是国内鉴别留学生海外学历的唯一途径但认证只是个体行为不是所有留学生都操作所以没有办理认证的留学生的学历在国内也是查询不到的他们也仅仅只有一张文凭。所以这时候我们提供的和学校颁发的一模一样的毕业证成绩单就有了使用价值。
存档可查的(USC毕业证)南加利福尼亚大学毕业证成绩单制做办理
精仿办理南加利福尼亚大学毕业证成绩单(【微信176555708】)毕业证学历认证OFFER专卖国外文凭学历学位证书办理澳洲文凭|澳洲毕业证,澳洲学历认证,澳洲成绩单【微信176555708】 澳洲offer,教育部学历认证及使馆认证永久可查 ,国外毕业证|国外学历认证,国外学历文凭证书 USC毕业证,USC毕业证,USC毕业证,USC毕业证,USC毕业证,USC毕业证【微信176555708】,USC毕业证,专业为留学生办理毕业证、成绩单、使馆留学回国人员证明、教育部学历学位认证、录取通知书、Offer、(留信学历认证永久存档查询)采用学校原版纸张、特殊工艺完全按照原版一比一制作(包括:隐形水印,阴影底纹,钢印LOGO烫金烫银,LOGO烫金烫银复合重叠,文字图案浮雕,激光镭射,紫外荧光,温感,复印防伪)行业标杆!精益求精,诚心合作,真诚制作!多年品质 ,按需精细制作,24小时接单,全套进口原装设备,十五年致力于帮助留学生解决难题,业务范围有加拿大、英国、澳洲、韩国、美国、新加坡,新西兰等学历材料,包您满意。
◆◆◆◆◆ — — — — — — — — 【留学教育】留学归国服务中心 — — — — — -◆◆◆◆◆
【主营项目】
一.毕业证【微信:176555708】成绩单、使馆认证、教育部认证、雅思托福成绩单、学生卡等!
二.真实使馆公证(即留学回国人员证明,不成功不收费)
三.真实教育部学历学位认证(教育部存档!教育部留服网站永久可查)
四.办理各国各大学文凭(一对一专业服务,可全程监控跟踪进度)
如果您处于以下几种情况:
◇在校期间,因各种原因未能顺利毕业……拿不到官方毕业证【微信:176555708】
◇面对父母的压力,希望尽快拿到;
◇不清楚认证流程以及材料该如何准备;
◇回国时间很长,忘记办理;
◇回国马上就要找工作,办给用人单位看;
◇企事业单位必须要求办理的
◇需要报考公务员、购买免税车、落转户口
◇申请留学生创业基金
留信网认证的作用:
1:该专业认证可证明留学生真实身份
2:同时对留学生所学专业登记给予评定
3:国家专业人才认证中心颁发入库证书
4:这个认证书并且可以归档倒地方
5:凡事获得留信网入网的信息将会逐步更新到个人身份内,将在公安局网内查询个人身份证信息后,同步读取人才网入库信息
6:个人职称评审加20分
7:个人信誉贷款加10分→ 【关于价格问题(保证一手价格)
8:在国家人才网主办的国家网络招聘大会中纳入资料,供国家高端企业选择人才
选择实体注册公司办理,更放心,更安全!我们的承诺:可来公司面谈,可签订合同,会陪同客户一起到教育部认证窗口递交认证材料,客户在教育部官方认证查询网站查询到认证通过结果后付款,不成功不收费!
我们所定的价格是非常合理的,而且我们现在做得单子大多数都是代理和回头客户介绍的所以一般现在有新的单子 我给客户的都是第一手的代理价格,因为我想坦诚对待大家 不想跟大家在价格方面浪费时间
对于老客户或者被老客户介绍过来的朋友,我们都会适当给一些优惠。
学历顾问:微信:176555708
可查真实(Monash毕业证)西澳大学毕业证成绩单退学买
办理假西澳大学毕业证【微信176555708】购买,办理Monash成绩单,Monash毕业证制作【微信176555708】【西澳大学毕业证】,Monash毕业证购买,Monash学位证,西澳大学学位证【Monash成绩单制作】【Monash毕业证文凭 Monash本科 澳洲学历认证原版制作【diploma certificate degree transcript 】【留信网认证,本科,硕士,海归,博士,排名,成绩单】代办国外(海外)澳洲、韩国、加拿大、新西兰等各大学毕业证。 ?我们对海外大学及学院的毕业证成绩单所使用的材料,尺寸大小,防伪结构(包括:水印,阴影底纹,钢印LOGO烫金烫银,LOGO烫金烫银复合重叠。 文字图案浮雕,激光镭射,紫外荧光,温感,复印防伪)都有原版本文凭对照。#一整套西澳大学文凭证件办理#—包含西澳大学西澳大学毕业证成绩单学历认证|使馆认证|归国人员证明|教育部认证|留信网认证永远存档教育部学历学位认证查询办理国外文凭国外学历学位认证#我们提供全套办理服务。
一整套留学文凭证件服务:
一:西澳大学西澳大学毕业证成绩单毕业证 #成绩单等全套材料从防伪到印刷水印底纹到钢印烫金
二:真实使馆认证(留学人员回国证明)使馆存档
三:真实教育部认证教育部存档教育部留服网站永久可查
四:留信认证留学生信息网站永久可查
国外毕业证学位证成绩单办理方法:
1客户提供办理西澳大学西澳大学毕业证成绩单信息:姓名生日专业学位毕业时间等(如信息不确定可以咨询顾问:我们有专业老师帮你查询);
2开始安排制作毕业证成绩单电子图;
3毕业证成绩单电子版做好以后发送给您确认;
4毕业证成绩单电子版您确认信息无误之后安排制作成品;
5成品做好拍照或者视频给您确认;
6快递给客户(国内顺丰国外DHLUPS等快读邮寄)。
教育部文凭学历认证认证的用途:
如果您计划在国内发展那么办理国内教育部认证是必不可少的。事业性用人单位如银行国企公务员在您应聘时都会需要您提供这个认证。其他私营 #外企企业无需提供!办理教育部认证所需资料众多且烦琐所有材料您都必须提供原件我们凭借丰富的经验帮您快速整合材料让您少走弯路。
实体公司专业为您服务如有需要请联系我: 微信176555708
留学挂科(UofM毕业证)明尼苏达大学毕业证成绩单复刻办理
精仿办理明尼苏达大学学历证书<176555708微信>【毕业证明信-推荐信做学费单>【微信176555708】【制作UofM毕业证文凭认证明尼苏达大学毕业证成绩单购买】【UofM毕业证书】{明尼苏达大学文凭购买}】成绩单,录取通知书,Offer,在读证明,雅思托福成绩单,真实大使馆教育部认证,回国人员证明,>【制作UofM毕业证文凭认证明尼苏达大学毕业证成绩单购买】【UofM毕业证书】{明尼苏达大学文凭购买}留信网认证。
明尼苏达大学学历证书<微信176555708(一对一服务包括毕业院长签字,专业课程,学位类型,专业或教育领域,以及毕业日期.不要忽视这些细节.这两份文件同样重要!毕业证成绩单文凭留信网学历认证!)(留信学历认证永久存档查询)采用学校原版纸张、特殊工艺完全按照原版一比一制作(包括:隐形水印,阴影底纹,钢印LOGO烫金烫银,LOGO烫金烫银复合重叠,文字图案浮雕,激光镭射,紫外荧光,温感,复印防伪)行业标杆!精益求精,诚心合作,真诚制作!多年品质 ,按需精细制作,24小时接单,全套进口原装设备,十五年致力于帮助留学生解决难题,业务范围有加拿大、英国、澳洲、韩国、美国、新加坡,新西兰等学历材料,包您满意。
◆◆◆◆◆ — — — — — — — — 【留学教育】留学归国服务中心 — — — — — -◆◆◆◆◆
【主营项目】
一.毕业证【微信:176555708】成绩单、使馆认证、教育部认证、雅思托福成绩单、学生卡等!
二.真实使馆公证(即留学回国人员证明,不成功不收费)
三.真实教育部学历学位认证(教育部存档!教育部留服网站永久可查)
四.办理各国各大学文凭(一对一专业服务,可全程监控跟踪进度)
如果您处于以下几种情况:
◇在校期间,因各种原因未能顺利毕业……拿不到官方毕业证【微信:176555708】
◇面对父母的压力,希望尽快拿到;
◇不清楚认证流程以及材料该如何准备;
◇回国时间很长,忘记办理;
◇回国马上就要找工作,办给用人单位看;
◇企事业单位必须要求办理的
◇需要报考公务员、购买免税车、落转户口
◇申请留学生创业基金
留信网认证的作用:
1:该专业认证可证明留学生真实身份
2:同时对留学生所学专业登记给予评定
3:国家专业人才认证中心颁发入库证书
4:这个认证书并且可以归档倒地方
5:凡事获得留信网入网的信息将会逐步更新到个人身份内,将在公安局网内查询个人身份证信息后,同步读取人才网入库信息
6:个人职称评审加20分
7:个人信誉贷款加10分→ 【关于价格问题(保证一手价格)
8:在国家人才网主办的国家网络招聘大会中纳入资料,供国家高端企业选择人才
选择实体注册公司办理,更放心,更安全!我们的承诺:可来公司面谈,可签订合同,会陪同客户一起到教育部认证窗口递交认证材料,客户在教育部官方认证查询网站查询到认证通过结果后付款,不成功不收费!
我们所定的价格是非常合理的,而且我们现在做得单子大多数都是代理和回头客户介绍的所以一般现在有新的单子 我给客户的都是第一手的代理价格,因为我想坦诚对待大家 不想跟大家在价格方面浪费时间
对于老客户或者被老客户介绍过来的朋友,我们都会适当给一些优惠。
学历顾问:微信:176555708
Should Repositories Participate in the Fediverse?
Presentation for OR2024 making the case that repositories could play a part in the "fediverse" of distributed social applications
成绩单ps(UST毕业证)圣托马斯大学毕业证成绩单快速办理
一比一原版制作UST毕业证【微信176555708】圣托马斯大学毕业证书原版↑制作圣托马斯大学学历认证文凭办理圣托马斯大学留信网认证,留学回国办理毕业证成绩单文凭学历认证【微信176555708】专业为海外学子办理毕业证成绩单、文凭制作,学历仿制,回国人员证明、做文凭,研究生、本科、硕士学历认证、留信认证、结业证、学位证书样本、美国教育部认证百分百真实存档可查】(留信学历认证永久存档查询)采用学校原版纸张、特殊工艺完全按照原版一比一制作(包括:隐形水印,阴影底纹,钢印LOGO烫金烫银,LOGO烫金烫银复合重叠,文字图案浮雕,激光镭射,紫外荧光,温感,复印防伪)行业标杆!精益求精,诚心合作,真诚制作!多年品质 ,按需精细制作,24小时接单,全套进口原装设备,十五年致力于帮助留学生解决难题,业务范围有加拿大、英国、澳洲、韩国、美国、新加坡,新西兰等学历材料,包您满意。
◆◆◆◆◆ — — — — — — — — 【留学教育】留学归国服务中心 — — — — — -◆◆◆◆◆
【主营项目】
一.毕业证【微信:176555708】成绩单、使馆认证、教育部认证、雅思托福成绩单、学生卡等!
二.真实使馆公证(即留学回国人员证明,不成功不收费)
三.真实教育部学历学位认证(教育部存档!教育部留服网站永久可查)
四.办理各国各大学文凭(一对一专业服务,可全程监控跟踪进度)
如果您处于以下几种情况:
◇在校期间,因各种原因未能顺利毕业……拿不到官方毕业证【微信:176555708】
◇面对父母的压力,希望尽快拿到;
◇不清楚认证流程以及材料该如何准备;
◇回国时间很长,忘记办理;
◇回国马上就要找工作,办给用人单位看;
◇企事业单位必须要求办理的
◇需要报考公务员、购买免税车、落转户口
◇申请留学生创业基金
留信网认证的作用:
1:该专业认证可证明留学生真实身份
2:同时对留学生所学专业登记给予评定
3:国家专业人才认证中心颁发入库证书
4:这个认证书并且可以归档倒地方
5:凡事获得留信网入网的信息将会逐步更新到个人身份内,将在公安局网内查询个人身份证信息后,同步读取人才网入库信息
6:个人职称评审加20分
7:个人信誉贷款加10分→ 【关于价格问题(保证一手价格)
8:在国家人才网主办的国家网络招聘大会中纳入资料,供国家高端企业选择人才
选择实体注册公司办理,更放心,更安全!我们的承诺:可来公司面谈,可签订合同,会陪同客户一起到教育部认证窗口递交认证材料,客户在教育部官方认证查询网站查询到认证通过结果后付款,不成功不收费!
我们所定的价格是非常合理的,而且我们现在做得单子大多数都是代理和回头客户介绍的所以一般现在有新的单子 我给客户的都是第一手的代理价格,因为我想坦诚对待大家 不想跟大家在价格方面浪费时间
对于老客户或者被老客户介绍过来的朋友,我们都会适当给一些优惠。
学历顾问:微信:176555708
办理毕业证(UPenn毕业证)宾夕法尼亚大学毕业证成绩单快速办理
官方原版办理宾夕法尼亚大学毕业证【微信176555708】学历认证怎么做:原版仿制宾夕法尼亚大学电子版成绩单毕业证认证【宾夕法尼亚大学毕业证成绩单】、宾夕法尼亚大学文凭证书成绩单复刻offer录取通知书、购买UPenn圣力嘉学院本科毕业证、【宾夕法尼亚大学毕业证办理UPenn毕业证书哪里买】、宾夕法尼亚大学 Offer在线办理UPenn Offer宾夕法尼亚大学Bachloer Degree。(留信学历认证永久存档查询)采用学校原版纸张、特殊工艺完全按照原版一比一制作(包括:隐形水印,阴影底纹,钢印LOGO烫金烫银,LOGO烫金烫银复合重叠,文字图案浮雕,激光镭射,紫外荧光,温感,复印防伪)行业标杆!精益求精,诚心合作,真诚制作!多年品质 ,按需精细制作,24小时接单,全套进口原装设备,十五年致力于帮助留学生解决难题,业务范围有加拿大、英国、澳洲、韩国、美国、新加坡,新西兰等学历材料,包您满意。
◆◆◆◆◆ — — — — — — — — 【留学教育】留学归国服务中心 — — — — — -◆◆◆◆◆
【主营项目】
一.毕业证【微信:176555708】成绩单、使馆认证、教育部认证、雅思托福成绩单、学生卡等!
二.真实使馆公证(即留学回国人员证明,不成功不收费)
三.真实教育部学历学位认证(教育部存档!教育部留服网站永久可查)
四.办理各国各大学文凭(一对一专业服务,可全程监控跟踪进度)
如果您处于以下几种情况:
◇在校期间,因各种原因未能顺利毕业……拿不到官方毕业证【微信:176555708】
◇面对父母的压力,希望尽快拿到;
◇不清楚认证流程以及材料该如何准备;
◇回国时间很长,忘记办理;
◇回国马上就要找工作,办给用人单位看;
◇企事业单位必须要求办理的
◇需要报考公务员、购买免税车、落转户口
◇申请留学生创业基金
留信网认证的作用:
1:该专业认证可证明留学生真实身份
2:同时对留学生所学专业登记给予评定
3:国家专业人才认证中心颁发入库证书
4:这个认证书并且可以归档倒地方
5:凡事获得留信网入网的信息将会逐步更新到个人身份内,将在公安局网内查询个人身份证信息后,同步读取人才网入库信息
6:个人职称评审加20分
7:个人信誉贷款加10分→ 【关于价格问题(保证一手价格)
8:在国家人才网主办的国家网络招聘大会中纳入资料,供国家高端企业选择人才
选择实体注册公司办理,更放心,更安全!我们的承诺:可来公司面谈,可签订合同,会陪同客户一起到教育部认证窗口递交认证材料,客户在教育部官方认证查询网站查询到认证通过结果后付款,不成功不收费!
我们所定的价格是非常合理的,而且我们现在做得单子大多数都是代理和回头客户介绍的所以一般现在有新的单子 我给客户的都是第一手的代理价格,因为我想坦诚对待大家 不想跟大家在价格方面浪费时间
对于老客户或者被老客户介绍过来的朋友,我们都会适当给一些优惠。
学历顾问:微信:176555708
Meet up Milano 14 _ Axpo Italia_ Migration from Mule3 (On-prem) to.pdf
Quattordicesimo Meetup di Milano, tenutosi a Milano il 23 Maggio 2024 dalle ore 17:00 alle ore 18:30 in presenza e da remoto.
Abbiamo parlato di come Axpo Italia S.p.A. ha ridotto il technical debt migrando le proprie APIs da Mule 3.9 a Mule 4.4 passando anche da on-premises a CloudHub 1.0.
Gen Z and the marketplaces - let's translate their needs
The product workshop focused on exploring the requirements of Generation Z in relation to marketplace dynamics. We delved into their specific needs, examined the specifics in their shopping preferences, and analyzed their preferred methods for accessing information and making purchases within a marketplace. Through the study of real-life cases , we tried to gain valuable insights into enhancing the marketplace experience for Generation Z.
The workshop was held on the DMA Conference in Vienna June 2024.
假文凭国外(Adelaide毕业证)澳大利亚国立大学毕业证成绩单办理
购买澳大利亚国立大学毕业证>【微信176555708】办理澳大利亚国立大学毕业证成绩单【微信176555708】Adelaide毕业证成绩单Adelaide学历证书Adelaide文凭【Adelaide毕业套号文凭网认证澳大利亚国立大学毕业证成绩单】【哪里买澳大利亚国立大学毕业证文凭Adelaide成绩学校快递邮寄信封】【开版澳大利亚国立大学文凭】Adelaide留信认证本科硕士学历认证(诚招代理)微信:176555708办理国外高校毕业证成绩单文凭学位证,真实使馆公证(留学回国人员证明)真实留信网认证国外学历学位认证雅思代考国外学校代申请名校保录开请假条改GPA改成绩ID卡
1.高仿业务:【本科硕士】毕业证,成绩单(GPA修改),学历认证(教育部认证),大学Offer,,ID,留信认证,使馆认证,雅思,语言证书等高仿类证书;
2.认证服务: 学历认证(教育部认证),大使馆认证(回国人员证明),留信认证(可查有编号证书),大学保录取,雅思保分成绩单。
3.技术服务:钢印水印烫金激光防伪凹凸版设计印刷激凸温感光标底纹镭射速度快。
办理澳大利亚国立大学澳大利亚国立大学毕业证成绩单流程:
1客户提供办理信息:姓名生日专业学位毕业时间等(如信息不确定可以咨询顾问:我们有专业老师帮你查询);
2开始安排制作毕业证成绩单电子图;
3毕业证成绩单电子版做好以后发送给您确认;
4毕业证成绩单电子版您确认信息无误之后安排制作成品;
5成品做好拍照或者视频给您确认;
6快递给客户(国内顺丰国外DHLUPS等快读邮寄)
-办理真实使馆公证(即留学回国人员证明)
-办理各国各大学文凭(世界名校一对一专业服务,可全程监控跟踪进度)
-全套服务:毕业证成绩单真实使馆公证真实教育部认证。让您回国发展信心十足!
(详情请加一下 文凭顾问+微信:176555708)欢迎咨询!
Ready to Unlock the Power of Blockchain!
Imagine a world where data flows freely, yet remains secure. A world where trust is built into the fabric of every transaction. This is the promise of blockchain, a revolutionary technology poised to reshape our digital landscape.
Toptal Tech is at the forefront of this innovation, connecting you with the brightest minds in blockchain development. Together, we can unlock the potential of this transformative technology, building a future of transparency, security, and endless possibilities.
办理新西兰奥克兰大学毕业证学位证书范本原版一模一样
原版一模一样【微信:741003700 】【新西兰奥克兰大学毕业证学位证书】【微信:741003700 】学位证,留信认证(真实可查,永久存档)offer、雅思、外壳等材料/诚信可靠,可直接看成品样本,帮您解决无法毕业带来的各种难题!外壳,原版制作,诚信可靠,可直接看成品样本。行业标杆!精益求精,诚心合作,真诚制作!多年品质 ,按需精细制作,24小时接单,全套进口原装设备。十五年致力于帮助留学生解决难题,包您满意。
本公司拥有海外各大学样板无数,能完美还原海外各大学 Bachelor Diploma degree, Master Degree Diploma
1:1完美还原海外各大学毕业材料上的工艺:水印,阴影底纹,钢印LOGO烫金烫银,LOGO烫金烫银复合重叠。文字图案浮雕、激光镭射、紫外荧光、温感、复印防伪等防伪工艺。材料咨询办理、认证咨询办理请加学历顾问Q/微741003700
留信网认证的作用:
1:该专业认证可证明留学生真实身份
2:同时对留学生所学专业登记给予评定
3:国家专业人才认证中心颁发入库证书
4:这个认证书并且可以归档倒地方
5:凡事获得留信网入网的信息将会逐步更新到个人身份内,将在公安局网内查询个人身份证信息后,同步读取人才网入库信息
6:个人职称评审加20分
7:个人信誉贷款加10分
8:在国家人才网主办的国家网络招聘大会中纳入资料,供国家高端企业选择人才
Explore-Insanony: Watch Instagram Stories Secretly
Instagram has become one of the most popular social media platforms, allowing people to share photos, videos, and stories with their followers. Sometimes, though, you might want to view someone's story without them knowing.
不能毕业如何获得(USYD毕业证)悉尼大学毕业证成绩单一比一原版制作
挂科购买☀【悉尼大学毕业证购买】【微信176555708】【USYD毕业证模板办理】加拿大文凭、本科、硕士、研究生学历都可以做,二、业务范围:
★、全套服务:毕业证、成绩单、化学专业毕业证书伪造【悉尼大学大学毕业证】微信176555708【USYD学位证书购买】◆◆◆◆◆ — — — 归国服务中心 — — -◆◆◆◆◆
【主营项目】
一.毕业证、成绩单、使馆认证、教育部认证、雅思托福成绩单、学生卡等!
二.真实使馆公证(即留学回国人员证明,不成功不收费)
三.真实教育部学历学位认证(教育部存档!教育部留服网站永久可查)
四.办理各国各大学文凭(一对一专业服务,可全程监控跟踪进度)
国外毕业证、学位证、成绩单办理流程:
1、客户提供办理信息:姓名、生日、专业、学位、毕业时间等(如信息不确定可以咨询顾问:【微信176555708】我们有专业老师帮你查询);
2、开始安排制作毕业证、成绩单电子图;
3、毕业证、成绩单电子版做好以后发送给您确认;
4、毕业证、成绩单电子版您确认信息无误之后安排制作成品;
5、成品做好拍照或者视频给您确认;
6、快递给客户(国内顺丰,国外DHL、UPS等快读邮寄)。
专业服务,请勿犹豫联系我!本公司是留学创业和海归创业者们的桥梁。一次办理,终生受用,一步到位,高效服务。详情请在线咨询办理,欢迎有诚意办理的客户咨询!洽谈。
◆招聘代理:本公司诚聘英国、加拿大、澳洲、新西兰、加拿大、法国、德国、新加坡各地代理人员,如果你有业余时间,有兴趣就请联系我们咨询【微信176555708】
没文凭怎么找工作。让您回国发展信心十足!
★、真实教育部学历学位认证;(一对一专业服务,可全程监控跟踪进度)
★、真实使馆认证,可以通过大使馆查询确认;(即教育部留服认证,不成功不收费)
★、毕业证、成绩单等材料,从防伪到印刷、水印到钢印烫金,高精仿度都是跟学校原版100%相同的;(敬请放心使用)
★、可以提供钢印、水印、烫金、激光防伪、凹凸版、最新版的毕业证、百分之百让您绝对满意、
★、印刷,DHL快递毕业证、成绩单7个工作日,真实大使馆教育部认证1个月。为了达到高水准高效率。
重新申请毕业证书(RMIT毕业证)皇家墨尔本理工大学毕业证成绩单精仿办理
不能毕业办理【RMIT毕业证【微信176555708】皇家墨尔本理工大学文凭学历】【微信176555708】【皇家墨尔本理工大学文凭学历证书】【皇家墨尔本理工大学毕业证书与成绩单样本图片】毕业证书补办 Fake Degree做学费单【毕业证明信-推荐信】成绩单,录取通知书,Offer,在读证明,雅思托福成绩单,真实大使馆教育部认证,回国人员证明,留信网认证。网上存档永久可查!全套服务:皇家墨尔本理工大学皇家墨尔本理工大学本科学位证成绩单真实回国人员证明 #真实教育部认证。让您回国发展信心十足#铸就十年品质!信誉!实体公司!可以视频看办公环境样板如需办理真实可查可以先到公司面谈勿轻信小中介黑作坊!
可以提供皇家墨尔本理工大学钢印 #水印 #烫金 #激光防伪 #凹凸版 #最新版的毕业证 #百分之百让您绝对满意
印刷DHL快递毕业证 #成绩单7个工作日真实大使馆教育部认证1个月。为了达到高水准高效率
请您先以qq或微信的方式对我们的服务进行了解后如果有皇家墨尔本理工大学皇家墨尔本理工大学本科学位证成绩单帮助再进行电话咨询。
国外毕业证学位证成绩单如何办理:
1客户提供办理信息:姓名生日专业学位毕业时间等(如信息不确定可以咨询顾问:我们有专业老师帮你查询);
2开始安排制作皇家墨尔本理工大学毕业证成绩单电子图;
3毕业证成绩单电子版做好以后发送给您确认;
4毕业证成绩单电子版您确认信息无误之后安排制作成品;
5成品做好拍照或者视频给您确认;
6快递给客户(国内顺丰国外DHLUPS等快读邮寄)。
留学学历(UoA毕业证)奥克兰大学毕业证成绩单官方原版办理
制做办理奥克兰大学学历证书<176555708微信>【毕业证明信-推荐信做学费单>【微信176555708】【制作UoA毕业证文凭认证奥克兰大学毕业证成绩单购买】【UoA毕业证书】{奥克兰大学文凭购买}】成绩单,录取通知书,Offer,在读证明,雅思托福成绩单,真实大使馆教育部认证,回国人员证明,>【制作UoA毕业证文凭认证奥克兰大学毕业证成绩单购买】【UoA毕业证书】{奥克兰大学文凭购买}留信网认证。
奥克兰大学学历证书<微信176555708(一对一服务包括毕业院长签字,专业课程,学位类型,专业或教育领域,以及毕业日期.不要忽视这些细节.这两份文件同样重要!毕业证成绩单文凭留信网学历认证!)[留学文凭学历认证(留信认证使馆认证)奥克兰大学毕业证成绩单毕业证证书大学Offer请假条成绩单语言证书国际回国人员证明高仿教育部认证申请学校等一切高仿或者真实可查认证服务。
多年留学服务公司,拥有海外样板无数能完美1:1还原海外各国大学degreeDiplomaTranscripts等毕业材料。海外大学毕业材料都有哪些工艺呢?工艺难度主要由:烫金.钢印.底纹.水印.防伪光标.热敏防伪等等组成。而且我们每天都在更新海外文凭的样板以求所有同学都能享受到完美的品质服务。
国外毕业证学位证成绩单办理方法:
1客户提供办理奥克兰大学奥克兰大学硕士毕业证成绩单信息:姓名生日专业学位毕业时间等(如信息不确定可以咨询顾问:我们有专业老师帮你查询);
2开始安排制作毕业证成绩单电子图;
3毕业证成绩单电子版做好以后发送给您确认;
4毕业证成绩单电子版您确认信息无误之后安排制作成品;
5成品做好拍照或者视频给您确认;
6快递给客户(国内顺丰国外DHLUPS等快读邮寄)
— — — — 我们是挂科和未毕业同学们的福音我们是实体公司精益求精的工艺! — — — -
一真实留信认证的作用(私企外企荣誉的见证):
1:该专业认证可证明留学生真实留学身份同时对留学生所学专业等级给予评定。
2:国家专业人才认证中心颁发入库证书这个入网证书并且可以归档到地方。
3:凡是获得留信网入网的信息将会逐步更新到个人身份内将在公安部网内查询个人身份证信息后同步读取人才网入库信息。
4:个人职称评审加20分个人信誉贷款加10分。
5:在国家人才网主办的全国网络招聘大会中纳入资料供国家500强等高端企业选择人才。
Search Result Showing My Post is Now Buried
Search results burying my post that used to rank before Google's March 2024 algorithm update.
Understanding User Behavior with Google Analytics.pdf
Unlocking the full potential of Google Analytics is crucial for understanding and optimizing your website’s performance. This guide dives deep into the essential aspects of Google Analytics, from analyzing traffic sources to understanding user demographics and tracking user engagement.
Traffic Sources Analysis:
Discover where your website traffic originates. By examining the Acquisition section, you can identify whether visitors come from organic search, paid campaigns, direct visits, social media, or referral links. This knowledge helps in refining marketing strategies and optimizing resource allocation.
User Demographics Insights:
Gain a comprehensive view of your audience by exploring demographic data in the Audience section. Understand age, gender, and interests to tailor your marketing strategies effectively. Leverage this information to create personalized content and improve user engagement and conversion rates.
Tracking User Engagement:
Learn how to measure user interaction with your site through key metrics like bounce rate, average session duration, and pages per session. Enhance user experience by analyzing engagement metrics and implementing strategies to keep visitors engaged.
Conversion Rate Optimization:
Understand the importance of conversion rates and how to track them using Google Analytics. Set up Goals, analyze conversion funnels, segment your audience, and employ A/B testing to optimize your website for higher conversions. Utilize ecommerce tracking and multi-channel funnels for a detailed view of your sales performance and marketing channel contributions.
Custom Reports and Dashboards:
Create custom reports and dashboards to visualize and interpret data relevant to your business goals. Use advanced filters, segments, and visualization options to gain deeper insights. Incorporate custom dimensions and metrics for tailored data analysis. Integrate external data sources to enrich your analytics and make well-informed decisions.
This guide is designed to help you harness the power of Google Analytics for making data-driven decisions that enhance website performance and achieve your digital marketing objectives. Whether you are looking to improve SEO, refine your social media strategy, or boost conversion rates, understanding and utilizing Google Analytics is essential for your success.
Recently uploaded (20)
Meet up Milano 14 _ Axpo Italia_ Migration from Mule3 (On-prem) to.pdf
Meet up Milano 14 _ Axpo Italia_ Migration from Mule3 (On-prem) to.pdf
Gen Z and the marketplaces - let's translate their needs
Gen Z and the marketplaces - let's translate their needs
Explore-Insanony: Watch Instagram Stories Secretly
Explore-Insanony: Watch Instagram Stories Secretly
Understanding User Behavior with Google Analytics.pdf
Understanding User Behavior with Google Analytics.pdf
Popup confirmation for Delete Button in GridView
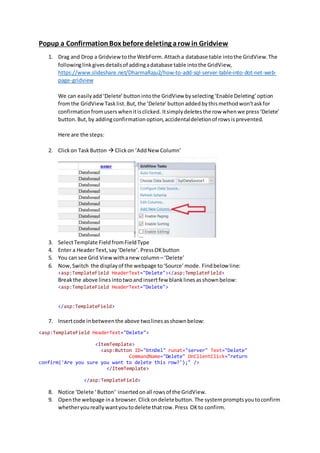
- 1. Popup a ConfirmationBox before deleting arow in Gridview 1. Drag and Drop a Gridviewtothe WebForm.Attacha database table intothe GridView.The followinglinkgivesdetailsof addingadatabase table intothe GridView, https://www.slideshare.net/DharmaRaju2/how-to-add-sql-server-table-into-dot-net-web- page-gridview We can easilyadd ‘Delete’ buttonintothe GridView byselecting‘Enable Deleting’option fromthe GridViewTasklist.But, the ‘Delete’buttonaddedbythismethodwon’taskfor confirmationfromuserswhenitisclicked. Itsimplydeletesthe row whenwe press‘Delete’ button.But,by addingconfirmationoption,accidentaldeletionof rowsisprevented. Here are the steps: 2. Clickon TaskButton Clickon ‘AddNew Column’ 3. SelectTemplate FieldfromFieldType 4. Enter a HeaderText,say‘Delete’.PressOKbutton 5. You can see Grid Viewwithanew column – ‘Delete’ 6. Now,Switch the displayof the webpage to‘Source’mode. Findbelow line: <asp:TemplateField HeaderText="Delete"></asp:TemplateField> Breakthe above linesintotwoandinsertfew blanklines asshownbelow: <asp:TemplateField HeaderText="Delete"> </asp:TemplateField> 7. Insertcode inbetweenthe above twolinesasshownbelow: <asp:TemplateField HeaderText="Delete"> <ItemTemplate> <asp:Button ID="btnDel" runat="server" Text="Delete" CommandName="Delete" OnClientClick="return confirm('Are you sure you want to delete this row?');" /> </ItemTemplate> </asp:TemplateField> 8. Notice ‘Delete ‘Button’ insertedonall rowsof the GridView. 9. Openthe webpage ina browser.Clickondeletebutton. The systempromptsyoutoconfirm whetheryoureallywantyoutodelete thatrow.Press OKto confirm.
- 2. 10: Insteadof Button,youcan adda linkbuttonbychanging<Asp:Buttonto<asp:LinkButtonas sownbelow: <ItemTemplate> <asp:LnkButton ID="btnDel" runat="server" Text="Delete" CommandName="Delete" OnClientClick="return confirm('Are you sure you want to delete the record?');" /> </ItemTemplate> In my opinion, LinkButton looks better than Button in a GridView. See the Figure above. === 0 ===