1. Eagle Energy
Looking Back
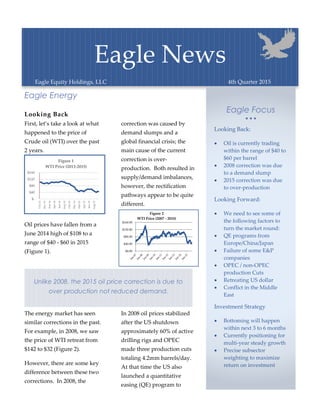
First, let’s take a look at what
happened to the price of
Crude oil (WTI) over the past
2 years.
Oil prices have fallen from a
June 2014 high of $108 to a
range of $40 - $60 in 2015
(Figure 1).
The energy market has seen
similar corrections in the past.
For example, in 2008, we saw
the price of WTI retreat from
$142 to $32 (Figure 2).
However, there are some key
difference between these two
corrections. In 2008, the
correction was caused by
demand slumps and a
global financial crisis; the
main cause of the current
correction is over-
production. Both resulted in
supply/demand imbalances,
however, the rectification
pathways appear to be quite
different.
In 2008 oil prices stabilized
after the US shutdown
approximately 60% of active
drilling rigs and OPEC
made three production cuts
totaling 4.2mm barrels/day.
At that time the US also
launched a quantitative
easing (QE) program to
$-
$40
$80
$120
$160
Oct-13
Dec-13
Feb-14
Apr-14
Jun-14
Aug-14
Oct-14
Dec-14
Feb-15
Apr-15
Jun-15
Aug-15
Figure 1
WTI Price (2013-2015)
Eagle News
Eagle Equity Holdings, LLC 4th Quarter 2015
Eagle Focus
Looking Back:
Oil is currently trading
within the range of $40 to
$60 per barrel
2008 correction was due
to a demand slump
2015 correction was due
to over-production
Looking Forward:
We need to see some of
the following factors to
turn the market round:
QE programs from
Europe/China/Japan
Failure of some E&P
companies
OPEC / non-OPEC
production Cuts
Retreating US dollar
Conflict in the Middle
East
Investment Strategy
Bottoming will happen
within next 3 to 6 months
Currently positioning for
multi-year steady growth
Precise subsector
weighting to maximize
return on investment
Unlike 2008, the 2015 oil price correction is due to
over production not reduced demand.
$0.00
$40.00
$80.00
$120.00
$160.00
Figure 2
WTI Price (2007 - 2015)
2. stimulate the economy. 2015
drilling activities have been
reduced by a similar
percentage in the US.
However, we have not yet
seen any indication of
production cuts by OPEC or
non-OPEC producers. The US
economy is on its way to
recovery and the Fed is
telegraphing a raise in interest
rates, so no more QE
programs are expected in the
US, but we could see QE
programs from other
countries such as Europe,
China and Japan. So why
haven’t other producers cut
production to stabilize oil
prices? Among the 3 biggest
oil producers in the world,
(Saudi Arabia, Russia and the
US) Saudi Arabia has kept
production high in order to
maintain market share.
Russia needs the revenue to
support its economy after
sanctions were imposed by
the western world. The US is
a very different animal.
Unlike most other oil
producers in the world, US oil
production is driven Mainly
by individual Exploration and
Production (E&P) companies
which are not governed by a
centralized energy policy.
Each E&P Company has its
own independent profit &
loss statement and debt-
equity ratio to manage and
protect.
We have seen over and over
again that the individual
freedoms that make free
enterprise great can easily
turn into irrational
exuberance, resulting in a
bubble type crisis.
Looking Forward
We believe oil prices are
going to bottom within the
next 3 to 6 months. Key
factors that could trigger the
bottoming process include:
QE programs from Europe,
China and Japan; the failure
of select US E&P companies;
OPEC and non-OPEC
countries dramatically cutting
production; stabilization of
the US dollar and escalation
of conflicts in the Middle East.
Barring unforeseen events, we
believe we are going to see
additional failures of high
debt US E&P companies
starting in Q4 2015. US
production should also
continue to retreat back below
the 8M bpd level. In addition,
OPEC will coordinate a series
of production cuts with key
non-OPEC members while
Europe, China and Japan
accelerate their own QE
programs. The US dollar
should also begin to reverse
course during this period.
Investment Opportunities
We saw the S&P 500 Energy Index (XLE) recover nicely after the 2008
correction and the long term foundation is still bullish for energy as the
global demand continues to grow. Many oil producing countries require
an oil price close to $100 in order to balance their fiscal budgets. We may
see a sudden bounce that pushes oil prices back above the $60 range in
the near term, but long term price recovery will be gradual and steady.
This could set the stage for the next multi-year bull market in energy.
As some of the referenced bottoming factors materialize, we will continue to balance our sub-sector
weighting in order to take advantage of price movement opportunities.
3. Energy Investment
Eagle Strategy
Our equity investment
strategy is very simple.
1. Study and analysis overall
trends in the energy market
2. Determine the short and
medium term trends.
3. Create subsector weighting
between Upstream;
Midstream and
Downstream investments
4. Research the subsector
companies that have the
best potential return on
investment (ROI)
5. Establish positions in these
companies based on our
sub-sector weighting
analytics
6. Utilize technical analysis
and financial discipline
(such as Dollar cost
averaging) to create
positions
7. Setup exit strategies that
maximize gains
Balance commodity exposure
within the overall investment
portfolio. Again, utilizing the
following simple investment
strategies.
1. Compare current
commodity price
movements to our energy
analysis to identify
opportunities
2. Analyze trends in oil and
gas commodities
3. Accumulate bullish or
bearish positions with
commodity ETFs utilizing
the same technical and
financial methods as
equities
Consistently monitor the
overall macro and micro
conditions and adjust
portfolio positions to manage
risk and maximize potential
opportunities
Dear Eagle – Q&A
Why is there three classes of investors? What are the differences?
Class A and Class C are for Eagle Equity Holdings, the management
company. Class A is the managing member of Energy Fund II, LLC and
Class C is for the management team to invest as individual into the
Fund. Class B is setup for all outside investors.
What kind of tax statement will I get from Energy Fund II?
All investors will receive a K-1 tax form at the end of each fiscal year.
The K-1 represents your share of the proceeds from Energy Fund ll.
Can I withdraw money during the investment period?
The Fund is setup as a closed fund and will disperse all funds at the end
of the 12 month period (up to 18 months based on investment
conditions. Contact your Eagle Representative for additional
information
Is there a minimum and maximum amount I can investment in Energy
Fund II?
The minimum investment is $10,000 (10 units) and there is no maximum.