
Recommended
More Related Content
What's hot
What's hot (18)
Similar to Eagle Newsletter Q1 2016
Similar to Eagle Newsletter Q1 2016 (20)
Recently uploaded
Recently uploaded (20)
Eagle Newsletter Q1 2016
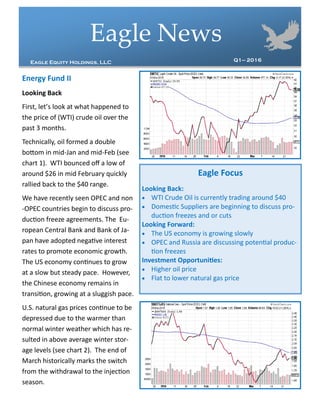
- 1. Eagle NewsEagle News Eagle Equity Holdings, LLC Q1— 2016 Energy Fund II Looking Back First, let’s look at what happened to the price of (WTI) crude oil over the past 3 months. Technically, oil formed a double bottom in mid-Jan and mid-Feb (see chart 1). WTI bounced off a low of around $26 in mid February quickly rallied back to the $40 range. We have recently seen OPEC and non -OPEC countries begin to discuss pro- duction freeze agreements. The Eu- ropean Central Bank and Bank of Ja- pan have adopted negative interest rates to promote economic growth. The US economy continues to grow at a slow but steady pace. However, the Chinese economy remains in transition, growing at a sluggish pace. U.S. natural gas prices continue to be depressed due to the warmer than normal winter weather which has re- sulted in above average winter stor- age levels (see chart 2). The end of March historically marks the switch from the withdrawal to the injection season. Eagle Focus Looking Back: WTI Crude Oil is currently trading around $40 Domestic Suppliers are beginning to discuss pro- duction freezes and or cuts Looking Forward: The US economy is growing slowly OPEC and Russia are discussing potential produc- tion freezes Investment Opportunities: Higher oil price Flat to lower natural gas price
- 2. Eagle NewsEagle News Eagle Equity Holdings, LLC Q1— 2016 Looking Forward The main factor affecting energy markets remains the balance or imbalance of supply vs. de- mand. Key factors affecting supply and demand include: As US economy continues to grow, gasoline consumption is increasing. The US Fed has started the rate tightening cycle, this could impact growth and currency. petroleum consumption historically increases during the summer driving season. China is working hard to avoid a hard landing and maintain a gradual growth cycle. OPEC, Russia and other non-OPEC producers have begun production collaboration discus- sions. US drill rig counts continue to fall, although daily production is slightle above 9M barrels per day, we should see the 8M+ level soon. Investment Opportunities Oil prices have risen back to the $40 level. The S&P en- ergy index (XLE) has also bounced off a bottom and started a new uptrend (see chart 3). We continue to focus our investment strategy to benefit from higher oil prices, flat to lower US natural gas prices and the impacts they will have on equities market. We believe the continued volatility of the en- ergy markets will provide exceptional investment opportunities through detailed research and technical analysis. Dear Eagle—Q&A What is NAV (Net Asset Value)? Net Assets (NA) = Total Assets—Total Liabilities. The NA is the sum of our fund account bal- ances minus management performance fees. Net Asset Value per unit (NAV) = Net Asset ÷ Total Investment Units.