Recommended

Recommended
More Related Content
What's hot
What's hot (20)
Similar to Record Setting: The Origins of Extreme Hail on 19 March 2018 during VORTEX-SE
Similar to Record Setting: The Origins of Extreme Hail on 19 March 2018 during VORTEX-SE (20)
Recently uploaded
Recently uploaded (20)
Record Setting: The Origins of Extreme Hail on 19 March 2018 during VORTEX-SE
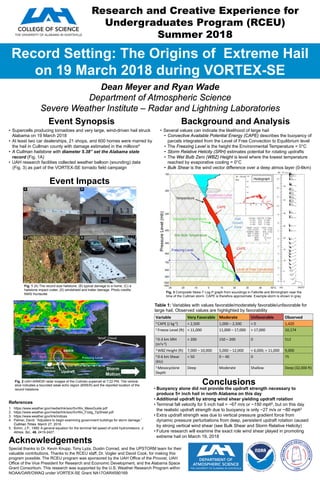
- 1. Record Setting: The Origins of Extreme Hail on 19 March 2018 during VORTEX-SE Dean Meyer and Ryan Wade Department of Atmospheric Science Severe Weather Institute – Radar and Lightning Laboratories Background and Analysis Conclusions Event Impacts Event Synopsis Acknowledgements • Several values can indicate the likelihood of large hail • Convective Available Potential Energy (CAPE) describes the buoyancy of parcels integrated from the Level of Free Convection to Equilibrium level • The Freezing Level is the height the Environmental Temperature = 0°C • Storm Relative Helicity (SRH) estimates potential for rotating updrafts • The Wet Bulb Zero (WBZ) Height is level where the lowest temperature reached by evaporative cooling = 0°C • Bulk Shear is the wind vector difference over a deep atmos layer (0-6km) • Supercells producing tornadoes and very large, wind-driven hail struck Alabama on 19 March 2018 • At least two car dealerships, 21 shops, and 600 homes were marred by the hail in Cullman county with damage estimated in the millions4 • A Cullman hailstone with diameter 5.38” set the Alabama state record (Fig. 1A) • UAH research facilities collected weather balloon (sounding) data (Fig. 3) as part of the VORTEX-SE tornado field campaign Special thanks to Dr. Kevin Knupp, Tony Lyza, Dustin Conrad, and the UPSTORM team for their valuable contributions. Thanks to the RCEU staff, Dr. Vogler and David Cook, for making this program possible. The RCEU program was sponsored by the UAH Office of the Provost, UAH Office of the Vice President for Research and Economic Development, and the Alabama Space Grant Consortium. This research was supported by the U.S. Weather Research Program within NOAA/OAR/OWAQ under VORTEX-SE Grant NA17OAR4590169 Research and Creative Experience for Undergraduates Program (RCEU) Summer 2018 1. https://www.weather.gov/media/lmk/soo/SvrWx_MesoGuide.pdf 2. https://www.weather.gov/media/lmk/soo/SvrWx_Fcstg_TipSheet.pdf 3. https://www.weather.gov/lmk/indices 4. Palmer, David. “Adjusters to begin examining government buildings for storm damage.” Cullman Times. March 27, 2018. 5. Bohm, J.P., 1989: A general equation for the terminal fall speed of solid hydrometeors. J. Atmos. Sci., 46, 2419-2427. References Fig. 1 (A) The record-size hailstone, (B) typical damage to a home, (C) a hailstone impact crater, (D) windshield and trailer damage. Photo credits: NWS Huntsville • Buoyancy alone did not provide the updraft strength necessary to produce 5+ inch hail in north Alabama on this day • Additional updraft by strong wind shear yielding updraft rotation • Terminal fall velocity for 5 inch hail = ~67 m/s or ~150 mph5, but on this day the realistic updraft strength due to buoyancy is only ~27 m/s or ~60 mph3 • Extra updraft strength was due to vertical pressure gradient force from dynamic pressure perturbations from deep, persistent updraft rotation caused by strong vertical wind shear (see Bulk Shear and Storm Relative Helicity) • Future research will examine the exact role wind shear played in promoting extreme hail on March 19, 2018 Fig. 2 UAH ARMOR radar images of the Cullman supercell at 7:22 PM. The vertical slice indicates a bounded weak echo region (BWER) and the reported location of the record hailstone Variable Very Favorable Moderate Unfavorable Observed 3 CAPE (J kg-‐1) > 2,500 1,000 – 2,500 < 0 1,420 1 Freeze Level (=) < 11,000 11,000 – 17,000 > 17,000 10,174 3 0-‐3 km SRH (m2s-‐2) > 200 150 – 200 0 512 3 WBZ Height (=) 7,000 – 10,000 5,000 – 12,000 < 6,000; > 11,000 9,000 2 0-‐6 km Shear (kts) > 50 0 – 40 0 75 1 Mesocyclone Depth Deep Moderate Shallow Deep (32,000 =) Table 1: Variables with values favorable/moderately favorable/unfavorable for large hail. Observed values are highlighted by favorability Fig. 3 Composite Skew-T Log-P graph from soundings in Falkville and Birmingham near the time of the Cullman storm. CAPE is therefore approximate. Example storm is shown in gray. PressureLevel(mb)