
Recommended
Recommended
More Related Content
Similar to Industrial Mgt and Engineering economy.pdf
Similar to Industrial Mgt and Engineering economy.pdf (20)
Recently uploaded
Recently uploaded (20)
Industrial Mgt and Engineering economy.pdf
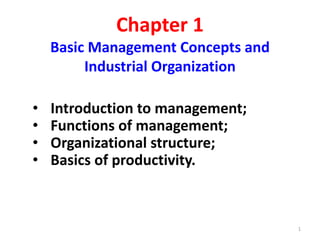
- 1. Chapter 1 Basic Management Concepts and Industrial Organization • Introduction to management; • Functions of management; • Organizational structure; • Basics of productivity. 1
- 2. Introduction to management v Management is the process of getting things done through the efforts of other people in order to achieve the predetermined objectives of organization. • Management may also be defined as: “The process by which execution of given purpose put into operation and supervise”. 2
- 3. Cont’d… • Another statement: Management may be defined as “A technique by which the purpose and objectives of particular human group are determined, defined, clarified and completed” Complete definition of management: üManagement is a distinct process consisting of planning, organizing, staffing, leading and controlling utilizing both in each science and art a n d fo l l ow e d i n o r d e r to a cco m p l i s h predetermined objectives of the organization. 3
- 4. Function of Management ØThere are those who view management as a function rather than a process. ØDunn, Stephens and Kelly contend that “Management is a role which includes a set of duties, responsibilities, and relationships-involved in work organizations”. ØThese duties and responsibilities constitute the function a manager performs. ØThe duties and responsibilities a manager performs are quite different from those performed by managerial employees. 4
- 5. Necessity of Management üManagement is an essential activity of all organizational level (Low, middle, and upper level) • Upper Management Needs Conceptual Skills. • Middle Management Needs Human Relations Skills. • Low Management Needs Technical Skills. üManagement applies to: (i) Small and large Organizations. (ii) Profit and non profit Organization. (iii) Manufacturing Organization. (iv) Service rendering Organization. 5
- 6. Levels of Management 1. Top management ü Is the ultimate source of authority and it lays down goals, policies and plans for the enterprise. ü Consists of a company consists of owners/shareholders, Board of Directors, its Chairman, Managing Director, or the Chief Executive, or the General Manager or Executive Committee having key officers. 2. Middle management ü The job of middle management is to implement the policies and plans framed by the top management. ü Consists of a company consists of heads of functional departments viz. Purchase Manager, Production Manager, Marketing Manager, Financial controller, etc. and Divisional and Sectional Officers working under these Functional Heads. 3. Lower level or operative management of a company consists of Superintendents, Foremen, Supervisors, etc. 6
- 7. In order to achieve predetermined objectives of an organization Management Entity Management is a distinct process consisting of Planning Organizing Staffing Leading Controlling Applied to Efforts of a group of people to utilize effective available recourses Man Money Material Method Machine 7
- 8. Classification of management There are five functions of management § Planning, § Organizing, § Staffing, § Leading, and § Controlling. üThe functions of managers provide a useful structure for organizing management knowledge. 8
- 9. (1) Planning üPlanning involves selecting missions and objectives and the action to achieve them it requires decision making, that choosing future courses of action from among alternatives. There are five types of planning: 1. Missions and objectives. 2. Strategies and polices. 3. Procedures and rules. 4. Programs. 5. Budgets. 9
- 10. (2) Organizing ØOrganizing is the part of managing that involves establishing an intentional structure of roles for people to fill in an organization. • The purpose of an organization structure is to creating an environment helpful for human performance. • It is then management tools and not an end. • Many problems arises in making structures fit situations. 10
- 11. (3) Staffing ØStaffing involves filling and keeping filled, the positions in the organization. ØThis is done by identifying the work force requirement inventorying the people available and recruiting, selecting, placing, promoting, appraising, planning the careers, compensating and training. 11
- 12. 4. Leading/Directing üIs the function of leading the employees to perform efficiently, and contribute their optimum to the achievement of organizational objectives. • Leading or directing is a way of: ØSupervision ØMotivation ØLeadership and ØCommunication the concerned organization/ Industry 12
- 13. (5) Controlling ØControlling is measuring and correcting individuals and organizational performance. • It involves measuring performance against goals and plans, showing where the deviations from standards exit and helping to correct them. • In short controlling facilitates the accomplishment of plans. • Controlling activity generally relate to the measurement of achievement. • Some means of controlling like the budget for expenses, inspection, record of labors-hours lost, are generally familiar. • Each shows whether plans are working out. 13
- 14. ORGANIZING • Organizations are experimenting with different approaches to organizational structure and design. • Organizational structure can play an important role in an organization’s success. • The process of Organizing—the second management functions—is how an organization’s structure is created. The nature of organization structure • Managers are seeking structural designs that will best support and allow employees to effectively and efficiently do their work. • Organizing is the process of creating an organization’s structure. 14
- 15. Cont’d… üOrganization structure is the formal pattern of interactions and coordination designed by management to link the tasks of individuals and groups in achieving organizational goals. üAn organizational structure is the formal framework by which job tasks are divided, grouped, and coordinated. üThis formal pattern designed by management is to be distinguished from the informal pattern of interactions that simply emerges within an organization. 15
- 16. Cont’d… üOrganization structure consists primarily of four elements: a. Job design b. Departmentalization c. Vertical coordination d. Horizontal coordination üOrganization design is the process of developing an organization structure. ØOrganizational design is the process of developing or changing an organization’s structure. 16
- 17. Cont’d… üIt involves decisions about six key elements: § work specialization, § departmentalization, § chain of command, § span of control, § centralization/decentralization, and § formalization. ØWe need to take a closer look at each of these structural elements. 17
- 18. Cont’d… • The organization chart is a line diagram that depicts the broad outlines of an organization’s structure. • While varying in detail from one organization to another, typically organization charts show the major positions or departments in the organization, the way positions are grouped together, reporting relationships for lower to higher levels, official channels for communications, and possibly the titles associated with major positions in the organization. 18
- 19. Facts about organizational chart 1. The organization chart provides a visual map of the chain of command, the unbroken line of authority that ultimately links each individual with the top organizational position thorough a managerial position at each successive layer in between. 2. Nearly all organizations having just a few members have an organization chart. üResponsibility is the obligation or expectation to perform and carry out duties and achieve goals related to a position. 19
- 20. Cont’d… üAuthority is the right inherent in a managerial position to tell people what to do and to expect them to do it, right to make decisions and carry out actions to achieve organizational goals. üWhile part of a manager’s work may be delegated, the manager remains accountable for results. üAccountability is the requirement of being able to answer for significant deviations from duties or expected results. üThe fact that managers remain accountable for delegated work may cause them to resist delegation. 20
- 21. Cont’d… Ø Delegation is assignment of part of manager’s work to others along with responsibility and authority. 1. In addition to issues of accountability, managers may resist delegation for a number of reasons. a. Managers may fear if subordinates fail. b. Managers may think they lack time to train subordinates. c. Managers may want to hold on to their power. d. Managers may enjoy doing the tasks subordinates could do. e. Managers may feel threatened by subordinates. f. Managers may not know how to delegate. 2. Subordinates may resist delegation because of fear of failure or of risk taking. 3. Failure to delegate may have serious negative consequences for a manger’s career. 21
- 22. Building Blocks of Organizing 1. Job design Job design is an essential part of organizational structure. It is the specification of task activities, usually repeated on a regular basis, associated with each particular job. a. Task activities need to be grouped in reasonably logical ways for each job. b. The way the jobs are configured influences employee motivation. 2. Work specialization is the degree to which the work necessary to achieve organizational goals is broken down into various jobs. 22
- 23. In Work specialization the tasks in an organization are divided into separate jobs. Another term for this is division of labor. 1. Work specialization was seen as a way to make the most efficient use of workers’ skills because workers would be placed in jobs according to their skills and paid accordingly. 23
- 24. 2. Other advantages of work specialization included improvement in employees’ skills at performing a task, more efficient employee training, and encouragement of special inventions and machinery to perform work tasks. 3. Work specialization was viewed as a source of unending productivity improvements. And it was— up to a certain point. 4. The human diseconomies from work specialization included boredom, fatigue, stress, lowered productivity, poor quality of work, increased absenteeism, and higher job turnover. 24
- 25. Raw materials Completed Capital equipment Production Products Production tooling Process Energy Scrape Labor Production Process Production ØProduction is the application of tools and a processing medium to the transformation of raw materials into finished goods for sale. 25
- 26. 26 ØDifferences of production process will be based on - product (goods or service) - technology ØProduction Vs Manufacturing- it is only different on the output ØClearly manufacturing systems should not be classified in terms of the above, as there will be enormous types Introduction…Cont’d
- 27. § In modern context manufacturing involves making products from raw material by using various processes, by making use of hand tools, machinery or even computers. ØIt is therefore a study of the processes required to make parts and to assemble them in machines. Introduction…Cont’d 27
- 28. Manufacturing Process External Disturbances INPUT S A Manufacturing Process is a complex arrangement of physical elements characterized by measurable parameters Internal Disturbances Materia l Social-Political Environment Knowledge Demand Energy OUTPUTS Customer Physical Elements Machine Tools Tools Mat Handl. Equ. People Measurable Parameters e.g., Production Rate Percent on Time Delivery Manufacturing Lead Time Defects per Million Products Service Knowledge Return 28
- 29. Recall the Value Adding Process Value Adding (Transformation) Process Product Service Workforce Knowledge Capital Material Inputs Outputs 29
- 30. PRODUCTIVITY ØProductivity is a relationship between the output (product/service) and input (resources consumed in providing them) of a business system. ØThe ratio of aggregate output to the aggregate input is called productivity. Productivity = output/Input ØFor survival of any organization, this productivity ratio must be at least 1. ØIf it is more than 1, the organization is in a comfortable position. 30
- 31. Productivity Ø Applied in an enterprise, a sector of economic activity or the economy as a whole, productivity may be defined as an output and input relation. Ø The term productivity can be used to asses or measure the extent to which a certain output can be extracted from a given input. 31
- 32. Productivity…Cont’d ØProductivity: Productivity is the ratio of output to some or all of the resources used to produce the output. Types of productivity: 1. Labor productivity: units produced / hours worked 2. Capital productivity: output / capital input 3. Material productivity: output /material input 32
- 33. IMPORTANCE OF PRODUCTIVITY Ø Benefits derived from higher productivity are as follows: 1. It helps to cut down cost per unit and thereby improve the profits. 2. Gains from productivity can be transferred to the consumers in form of lower priced Products or better quality products. 3. These gains can also be shared with workers or employees by paying them at higher rate. 4. A more productive entrepreneur can have better chances to exploit expert opportunities. 33
- 34. Cont’d… 5. It would generate more employment opportunity. 6. Overall productivity reflects the efficiency of production system. 7. More output is produced with same or less input. 8. The same output is produced with lesser input. 9. More output is produced with more input. 10. The proportional increase in output being more than the proportional increase in input. 34
- 35. PRODUCTIVITY MEASUREMENT • Productivity may be measured either on aggregate basis or on individual basis, which are called total and partial measure. Total productivity Index/measure = Total output/Total input = Total production of goods and services Labour + material+ capital + Energy + management . 35
- 36. Cont’d…. Labour productivity Index/Measure = Output in unit Man hours worked Management productivity Index/Measure = Output Total cost of management Machine productivity Index/Measure = Total output Machine hours worked 36
- 37. FACTORS AFFECTING PRODUCTIVITY Ø All the factors which are related to input and output components of a production process are likely to affect productivity. Ø These factors can be divided into 2 main categories, namely: Category 1 Ø Primary factors are effort and working capacity of an individual. • Organization factors are related to the design and transformation process required to produce some item, the nature of training and other skill imported to workers to perform certain operations in a production process, control and various other incentives. • Conventions and traditions of the organization e.g. activities of labor unions, medical facilities, worker and executive understanding etc. 37
- 38. Cont’d… Category II • Factors related to output: research and development techniques, improvement in technology and efficient sales strategy of the organization will lead to improvement in output. • Efficient use of input resources , better stores control , production control policy , maintenance of machines etc will minimize the cost of production. Ø The factors listed in category I and II can be further divided into 4 major classes viz. • Technological • Managerial • Labor, and • External factors 38
- 39. Cont’d… • The technological factors can increase the output per unit of input substantially. They can be defined in terms of technology employed, tools and raw material used. • The labor factors are characterized by the degree of skills of the works force, health, and attitude towards management, training and discipline. 39
- 40. Tools and techniques used to improve productivity n Following tools and techniques are used to improve productivity of the organization by optimum utilization of resources. 1. Method Study. 2. Time Study (Work Measurement). 3. Motion Economy. 4. Financial and Non Financial Incentives. 5. Value Analysis. 6. Production, Planning and Control. 7. Inventory Control. 8. Job Evaluation. 9. Material Handling Analysis. 10.Ergonomics (Human Engineering). 11.System Analysis. 12.Operations Research Techniques. 40
- 42. UNIT 2 Forecasting • Meaning and use of forecasting • Forecasting techniques 42
- 43. • If you are asked to determine how many units of tires will be produced in May, how do you estimate it? • easy or difficult question? • The marketing people said 20,000, but the production manager doesn’t agree with the marketing people’s prediction. • How could you determine a better estimate? There are several ways to get a better answer. • One is to simply guess. Ask a person who has long experience in the production department. • As he said, in May the number of automobiles sold is very low, due to this reason, 20,000tires is too much. Forecasting 43
- 44. Forecasting • Every organization invariably engages in annual planning exercise. • The heads of various functional areas such as marketing, production, materials and finance take part in this exercise with specific objectives. • The marketing function provides data on sales that the organization should target in coming year. • This is primarily achieved through forecasting. 44
- 45. • A forecast = some definite method of predicting future events • In to day’s market driven production system, forecasts are more important than ever. • The survival of a manufacturing enterprise depends on its ability to assess the market trend with reasonable accuracy several years a head. • Forecasting is the art and science of Predicting the future • Forecasting is one input and to all types of business planning and control. • Marketing uses for planning -products, promotion and pricing • Finance uses forecasting as an input for financial planning. • Forecasting is an input for operation decisions on process design, capacity planning and inventory. Forecasting 45
- 46. The Forecasting System • Identify the problem – Forecasts provide information to make better decisions impact of decision? relevant or not – One-time or on a regular basis? short term, long term – Examples: sales, income, expenses, energy, prices, … 46
- 47. 47
- 48. Understand the problem ….cont’d • The underlying process: process that creates demand gain insight – Problem characteristics • time frame • level of detail • accuracy needed • number of items to forecast 48
- 49. • Data: examining data can provide much insight of; – Company records – Commercial records – Government records – Analyze and check data!! • causal factors: advertising, rebates, long waiting time, poor quality, … ØForecast goal • A good forecasting system will react to actual • changes but ignore chance variations à check what is going on !!! Understand the problem ….cont’d 49
- 50. • In this section we will discus three classes of forecasting methods: 1. Qualitative methods which is composed of judgmental or opinion of experts. ü In simplest term using expert’s opinion to get a forecast such as asking the experienced production operator. 2. Time series methods: use the past sales to try to determine the future. ü Statistical techniques that use historical demand data to predict future demand 3. Causal methods/ Regression methods : tries to relate the variables being forecast to something else. ü Relating the automobile sales to tires Classification of Forecasting 50
- 51. Forecasting Methods The above classes of forecasting can be broadly divide in to two categories: 1. Qualitative forecast methods – Rely on managerial Judgment and they don’t use specific models – Thus different individual can use the same qualitative methods and arrive at different forecasts. 2. Quantitative forecast methods This techniques include the time series and causal method of forecasting – based on mathematical formulas – Useful when there is a past data or when past data are reliable to predict of the future 51
- 52. Forecasting techniques can depend on: • Time frame – Indicates how far into the future is forecast. • Short- to mid-range forecast – typically encompasses the immediate future – daily up to two years • Long-range forecast • usually encompasses a period of time longer than two years • Demand behavior – Trend: a gradual, long-term up or down movement of demand – Random variations: movements in demand that do not follow a pattern – Cycle: an up-and-down repetitive movement in demand – Seasonal pattern: an up-and-down repetitive movement in demand occurring periodically 52
- 53. 1. Qualitative Methods Ø Management, marketing, purchasing, and engineering and other relevant personnel are sources for internal qualitative forecasts. Ø The two common techniques are: 1. Delphi method – involves soliciting forecasts about technological advances from experts 2. Market survey – Both consume time and costly, but the only forecasting method for new product . – Useful when there is a lack of data or when past data are not reliable to predict of the future. 53
- 54. Market survey • Several steps: –developing a questionnaire –carrying out the survey –results should be tabulated and analyzed, and interpreted 54
- 55. DEMAND FORECASTING • Demand forecast is an estimate of sales in monetary or physical units for a specified future period under a proposed business plan or program or under assumed set of economic and other environmental forces, planning premises outside the business organization for which the forecast estimate is made. • Demand forecasting also helps evaluating the performance of the sales department. • Thus, demand forecasting is a necessary and effective tool in the hands of management of an enterprise to have finished goods of right quality and quantity at right time with minimum cost. 55
- 56. STEPS IN FORECASTING üThe following are the main steps in demand forecasting; ØDetermine the objective of forecast, ØSelect the period over which the forecast is to be made, ØSelect the technique to be used for forecasting, ØCollect the information to be used, ØMake the forecast. 56
- 57. SALES FORECASTING • Sales forecast is an estimate based on some past information, the prevailing situation and prospect of future. • It is based on an effective system and is valid only to some specified period. • The following are some main components of a sales forecasting system: (i) Market Research Operations to get the relevant and reliable information about the trends in the market (ii) A data processing and analyzing system to estimate and evaluate the sales performance in the various markets. • Proper co-ordination of steps (i) and (ii) and then to place the findings before the top management for making final decisions. 57
- 58. WHY FORECAST? • Since forecasting activity typically precedes a planning process one can identify specific reasons for the use of forecasting in organizations. • Organizations face a different set of issues while they engage in planning and in each of these, forecasting plays an important role as a tool for planning process. 58
- 59. Cont’d… • The key areas of application of forecasting are summarized below: üDynamic and complex environment üShort term fluctuation in production üBetter material management üRationalized man-power decisions üBasis for planning and scheduling üStrategic decisions 59
- 60. Elements of Forecasting • Forecasting consists basically of analysis of the following elements; Internal factors: • Past • Present • Proposed or future External Factors: • Controllable: (a) Past (b) Present (c) Future • Non controllable: (a) Past (b) Present (c) Future 60
- 61. Forecasting Models 1. Extrapolative models: They make use of past data and essentially prepare future estimates by some methods of extrapolating the past data. Example 1, The demand for soft drinks in a city or a locality could be estimated as 110 percent of the average sales during the last three months. Example 2, The sale of new garments during the festive season could be estimated to be a percentage of the festive season sales during the previous year. 61
- 62. Cont’d… 2. Casual models: It analyses data from the point view of cause-effect relationship. • For instance, to the process of estimating the demand for the new houses, the model will identify the factors that could influence the demand for the new houses and establish the relationship between these factors. • The factors, may include real estate prices, housing finance options, disposable income of families, and cost of construction and befits derived from tax laws. 3. Subjective judgments models: Another set of models consist of subjective judgment using qualitative data. • In some cases, it could be based on quantitative and qualitative data. 62
- 63. Cont’d… • Forecasting methods involve construction of suitable mathematical relationship to describe the appropriate demand pattern. FORECASTING TECHNIQUE: 1. Weighted moving averages 2. Casual forecasting model 3. Linear regression analysis 4. Multiple regression analysis 63
- 64. 1. Weighted Moving Average • Equal weights are assigned to all periods in the computation of simple moving average. • The weighted moving average assigns more weight to some demand values usually more recent ones. • Weights are assigned to most recent data. A. Naive forecast: demand in current period is used as next period’s forecast B. Simple moving average • Uses average demand for a fixed sequence of periods. • Stable demand with no pronounced behavioral patterns. 64
- 65. A. Naïve Approach Example: Forecast the order for the month of November by Naïve approach. Solution: Forecast order for the month of November, (F)Nov = 90 units B. Simple Moving Average n = number of periods taken to evaluate the moving average Dt or Di = Actual demand in that period. 65
- 66. 66
- 67. 67
- 69. Unit 3. Manufacturing Operations and Plant Design Ø Manufacturing Operations Ø Basics of Plant Layout; Ø Study of Plant Layout; Ø Design of Industrial Plant Ø Ergonomics and Industrial Safety 69
- 70. Classification of Industries 1. Primary industries – cultivate and exploit natural resources – Examples: agriculture, mining 2. Secondary industries – convert output of primary industries into products – Examples: manufacturing, power generation, construction 3. Tertiary industries – service sector – Examples: banking, education, government, legal services, retail trade, transportation 70
- 71. Manufacturing Industries ISIC Code • Food, beverages, tobacco 31 • Textiles, apparel, leather and fur products 32 • Wood and wood products, cork 33 • Paper, printing, publishing, bookbinding 34 • Chemicals, coal, petroleum, & their products 35 • Ceramics, glass, mineral products 36 • Basic metals, e.g., steel, aluminum 37 • Fabricated products, e.g., cars, machines, etc. 38 • Other products, e.g., jewelry, toys 39 71
- 72. More Industry Classifications • Process industries, e.g., chemicals, petroleum, basic metals, foods and beverages, power generation • Discrete product (and part) industries, e.g, cars, aircraft, appliances, machinery, and their component parts 72
- 73. Process Industries and Discrete Manufacturing Industries 73
- 74. Manufacturing Industry • Transformation Operations – Machine Processing – Assembly • Adding value* • Other Operations Material handling Inspection and testing Coordination and control Transformation Process Raw Material Part or Product Power Tools Machine s Labour Scrap or Waste 74
- 76. Assembly Operations • Joining processes – Welding – Brazing and soldering – Adhesive bonding • Mechanical assembly – Threaded fasteners (e.g., bolts and nuts, screws) – Rivets – Interference fits (e.g., press fitting, shrink fits) – Other 76
- 77. Material Handling • Material transport – Vehicles, e.g., forklift trucks, AGVs, monorails – Conveyors – Hoists and cranes • Storage systems • Unitizing equipment • Automatic identification and data capture – Bar codes – RFID – Other AIDC 77
- 78. Inspection and Testing Inspection – conformance to design specifications – Inspection for variables - measuring – Inspection of attributes – gauging Testing – observing the product (or part, material, subassembly) during operation 78
- 79. Production Facilities and Layout • Facilities organised in the most efficient way to serve the particular mission of the plant and depends on: – Types of products manufactured – Production quantity – Product variety 79
- 80. Production Quantity (Q) • Number of units of a given part or product produced annually by the plant • Three quantity ranges: 1. Low production – 1 to 100 units 2. Medium production – 100 to 10,000 units 3. High production – 10,000 to millions of units 80
- 81. Product Variety (P) • Number of different product or part designs or types • ‘Hard’ product variety – products differ greatly – Few common components in an assembly • ‘Soft’ product variety – small differences between products – Many common components in an assembly 81
- 82. Product Variety (P) vs. Production Quantity (Q) P Q 82
- 83. Low Production Quantity (Qlow) Job shop – makes low quantities of specialized and customized products • Products are typically complex (e.g., specialized machinery, prototypes, space capsules) • Equipment is general purpose • Plant layouts: – Fixed position – Process layout 83
- 86. Medium Production Quantities (Qmed) 1. Batch production – A batch of a given product is produced, and then the facility is changed over to produce another product – Changeover takes time – setup time – Typical layout – process layout – Hard product variety 2. Cellular manufacturing – A mixture of products is made without significant changeover time between products – Typical layout – cellular layout – Soft product variety 86
- 88. High Production (Qhigh) 1. Quantity production – Equipment is dedicated to the manufacture of one product – Standard machines tooled for high production (e.g., stamping presses, molding machines) – Typical layout – process layout 2. Flow line production – Multiple workstations arranged in sequence – Product requires multiple processing or assembly steps – Product layout is most common 88
- 91. Manufacturing Capability – Technological processing capability - the available set of manufacturing processes – Physical size and weight of product – Production capacity (plant capacity) - production quantity that can be made in a given time 91
- 92. Lean Production Operating the factory with the minimum possible resources and yet maximizing the amount of work accomplished • Utilisation of Resources - workers, equipment, time, space, materials • Minimising time • Maximising quality (accuracy) • Minimising cost • Doing more with less, and doing it better 92
- 93. Programs Associated with Lean Production • Just-in-time delivery of parts • Worker involvement • Continuous improvement • Reduced setup times • Stop the process when something is wrong • Error prevention • Total productive maintenance 93
- 94. Plant Layout 94
- 95. CLASSIFICATION OF LAYOUT PROBLEMS A layout problem might arise because of: § A change in the design of product, § The addition or deletion of a product from a company’s product line, § A significant increase or decrease in the demand for a product, § Changes in the design of process, § Replacement of one or more pieces of equipment, 95
- 96. CONT’D § Adoption of new safety standards, § Organizational changes, § A decision to build a new plant, or § G r a d ua l c h a n g e s o v e r t i m e d e v e l o p i n g bottlenecks in production, crowded conditions, delays, idle time, back- tracking, poor housekeeping, excessive temporary storage space, obstacles to materials flow, failure to meet schedule etc. 96
- 97. CONT’D Layout Design Schedule Design Product Design Process Design Communication links among product, process, schedule and layout design 97
- 98. In addition, there may also exist a number of constraints on the solution: § Local, state, and federal governmental restrictions on allowable air and noise pollution level, § Standards concerning aisle widths, ventilation, temperature, lighting etc § Building geometry, § Building site and building construction in an existing building, § Building site can restrict the shape of the building, and consequently, and § Cost of relocating the existing facilities should be weighed with the advantages derived from the relocation. CONT’D 98
- 99. Steps to consider in designing a plant layout: 1.Procure the basic data • The basic data to be obtained must be related to products, materials, manufacturing process, existing machines, production schedule, existing material storage and handling equipment, existing plant services, existing building and existing layout. PLANT LAYOUT PROCEDURE 99
- 100. 2. Analyze the product and production process 3. Make or Buy parts decision 4. Plan the material flow pattern 5. Consider general material handling plan 6. Calculate equipment requirement 7. Plan individual work stations 8. Select specific material handling equipment 9. Coordinate groups of related operations CONT’D 100
- 101. 10.Construct flow diagram for production centers 11.Plan service and auxiliary activities 12.Determine the space requirements 13.Allocate activity area and plot plan 14.Consider building types 15.Construct master layout CONT’D 101
- 102. 16.Seek opinions and suggestions 17.Evaluate adjust and select the best layout 18.Check final layout 19.Obtain official approval 20.Installation of the layout 21.Follow-up the implementation of layout CONT’D 102
- 103. 1. Select equipment on the basis of product design and expected volume of production 2. Collect layout data: machine data, machine load charts and templates of equipment 3. Develop process chart 4. Develop an overall flow plan of operations for processing and material handling 5. Select best suited type of building 6. Develop a tentative plot plan LAYOUT OF A NEW PLANT 103
- 104. 7. Layout template or models of individual product machines according to flow-plan of operations 8. Layout templates and space for a service activities: materials handling, receiving and shipping, inspection, storage, maintenance, building services, offices and employees facilities 9. Develop building specifications to house the layout, and modify floor plan considering building limitation 10. Make a detailed layout drawing, plot plan drawing, and a layout model (if required) CONT’D 104
- 105. 11. Make a flow-process chart and flow-diagram to verify the attainment of the objectives of an efficient layout 12. Seek opinions and suggestions on these layout drawings and charts from specialist in various fields, and make modification if necessary 13. Seek management approval on final layout drawing 14. Construct plant and install equipments 15. Make a test run and adjust layout where required CONT’D 105
- 106. • Layout changes are necessary due to various reasons including expansion, for adopting technological improvements, and changes in production method. REVISING AND IMPROVING EXISTING LAYOUT 106
- 107. Technological improvement • Influence the operating industrial plant, 1. Increasing mechanization 2. Developments in fuel and energy 3. Developments in processes 4. Developments in materials 5. Improvements in product design 6. Developments in scientific management CONT’D 107
- 108. 1. Non qualified or un-exprienced personnel when assigned with the task of layout 2. When layout revisions is delegated to various department head and foremen, each department makes whatever revisions it feels necessary. 3. A poor site for a particular plant may mean the inaccessibility to the street and rail lines, illogical arrangement of shipping and receiving facilities … REASONS FOR INEFFICIENT LAYOUT 108
- 109. 4. When layout has no provision for future expansion 5. Due to poor judgment or inadequate forecast of future sales 6. The use of a building unsuited to the layout requirement also accounts for high production costs 7. Inefficient plant maintenance practices 8. When management fails to adopt farsighted equipment replacement programmes CONT’D 109
- 110. 1. Expansion of capacity 2. Shrinkage in output 3. Change in product design 4. Replacement of equipment 5. Poor working environment 6. To reduce material handling 7. Frequent accidents REASONS FOR REDESIGN OF LAYOUT 110
- 111. 8. Delay in process and idle time 9. Relocation of department 10. Backtracking and bottlenecks in material flow 11. Poor lighting, ventilating, heating, housekeeping facilities in the layout. CONT’D 111
- 112. CONT’D 112
- 113. In general… • The proper location of essential facilities such as lockers, washrooms, toilets and medical service in reference to the work areas and the provision of sufficient amount of space for the will tend to prevent waste of time in their use. CONT’D 113
- 115. What is Ergonomics? 115 Common Definition
- 117. What is Ergonomics? 117 Ergonomics is concerned with the interaction between human and technology Ergonomics integrates knowledge delivered from the human science to match systems, environments, jobs, and products to the physical and mental abilities and limitation of people. Ergonomics, also known as human engineering or human factors engineering, the science of designing machines, products, and systems to maximize the safety, comfort, and efficiency of the people who use them. Ergonomists draw on the principles of industrial engineering, psychology, anthropometry (the science of human measurement), and biomechanics (the study of muscular activity) to adapt the design of products and workplaces to people’s sizes and shapes and their physical strengths and limitations. Ergonomists also consider the speed with which humans react and how they process information, and their capacities for dealing with psychological factors, such as stress or isolation.
- 118. Ergonomic 118 • Ergonomist view people and the objects they use as one unit, and ergonomic design blends the best abilities of people and machines. • Humans are not as strong as machines, nor can they calculate as quickly and accurately as computers. • Unlike machines, humans need to sleep, and they are subject to illness, accidents, or making mistakes when working without adequate rest. • But machines are also limited—cars cannot repair themselves, computers do not speak or hear as well as people do, and machines cannot adapt to unexpected situations as well as humans. • An ergonomically designed system provides optimum performance because it takes advantage of the strengths and weaknesses of both its human and machine components.
- 119. Definition: Ergonomic 119 IEA (International Ergonomics Association) ”the scientific discipline concerned with the understanding of the interactions among human and other elements of a system, and the profession that applies theory, principles, data and methods to design in order to optimize human well-being and overall system performance”
- 120. Origin of Ergonomics 120 • The name ergonomics officially proposed at a 1949 meeting of the British Admiralty (July 12), by Prof. Hugh Murrell. • The name 'Ergonomics' officially accepted in 1950. • The name Ergonomics was derived from the Greek words: Ergon/ergos - work; Nomikos/nomos - natural laws - control and orderly assignment.
- 121. A Hierarchy of goals in ergonomics 121 • To generate tolerable working conditions that do not pose known dangers to human life or health. • To generate acceptable conditions • To generate optimal conditions which are so well adapted to human characteristics, capabilities and desires that physical, mental and social well-being is achieved
- 122. 122 Anatomy Orthopedics Physiology Medicine Psychology Sociology Anthropometry Biomechanics Work physiology Industrial hygiene Management Labor relations Industrial Engineering Bio-engineering Systems engineering Safety engineering Military engineering Computer Aided Design Origins, developments and application of ergonomics
- 123. Typical losses from failure to apply ergonomic 123 1. Lower production output 2. Increased lost time 3. Higher medical & material cost 4. Increased absenteeism 5. Low quality work 6. Injuries, strains 7. Increased probability of accidents & errors
- 124. Areas of involvement for industrial ergonomic 124 1. Physical ergonomic 2. Information ergonomic 3. Design of work space and work method 4. Product design 5. Macroergonomics: job performance, motivation job & worker
- 125. Determining the costs 125 1. Personnel: • Outside consultant • Internal personnel • Employee downtime 2. Equipments and material 3. Reduced productivity and sales 4. Overhead
- 126. Determining the benefits 126 1. Personnel-related benefits • Increased output per worker: work station design, equipment redesign, software redesign • Reduced errors • Reduced accidents, injuries and illness • Reduced training time • Reduced skill requirements • Reduced maintenance time • Reduced absenteeism • Reduced turnover
- 127. Determining the benefits 127 2. Equipments and material • Reduced scrap, • Reduced equipment, • Reduced production parts and materials, • Reduced stocking and storage of parts, • Reduced maintenance tools and materials, • Reduced equipment damage
- 128. History of Ergonomics 128 • The name ergonomics officially proposed at a 1949 meeting of the British Admiralty, by Prof. Hugh Murrell. • The name 'Ergonomics' officially accepted in 1950. • The Ergonomic Society was formed in 1952 with people from psychology, biology, physiology, and design in UK. • The Human Factors Society was formed in 1957 in US. Now evolve as Human Factor and Ergonomics Society (HFES).
- 129. History of Ergonomics… 129 • In Europe started with industrial application – Focus on well being of workers and manufacturing productivity – Ergonomics • In US developed from military problems (Korean War – around 1950s) – Enhance the system performance – Human Factors Engineering
- 130. 2000- 2010? 1990s 1980s 1970s 1960s Timeline of Ergonomics 130 1950s Military Ergonomics Industrial Ergonomics Consumer Product Ergonomics HCI and Software Ergonomics Cognitive and Macro Ergonomics Eco and Pleasure Ergonomics?
- 131. The cost of BAD ERGONOMICS 131 POOR WORKER SATISFACTION LESS EFFICIENCY, PRODUCTIVITY MOSTLY INCREASE IN ACCIDENT RATE, BAD QUALITY COST OF QUALITY
- 132. The cost of BAD ERGONOMICS 132 • One day’s absence cost at least 2 – 3 times one day payment (Oxenburgh, 1991) • Total cost of work related accidents and illness in Industrial Country is 5-10% of all industrial company trading profit (UK Health & Safety Executive, 1995)
- 133. Economic Nature of Ergonomics 133 Optimum use of human energy Higher performances Regulation of Rest and Recovery Higher productivity Elimination of Fatigue Better quality of product Hygienic aspect of ergonomics Elimination of undue illness and absteeism
- 134. The Twelve Simplified Principles of Ergonomics Providing background on the field of ergonomics, itemized in twelve different principles. Many of principles appear simple, but one should not underestimate the power of a few fundamental ideas applied systematically. It is much more important to learn the underlying principles rather than the details of current prescriptions for specific problems. By learning the principles you will understand how to evaluate changes in technology and new products that will come to the market. The principles will help you to evaluate any task, whether at home, in the office environment, or in general industry. The principles will remains the same, even when advancements in knowledge are made in the field of ergonomics. 134
- 135. The Twelve Simplified Principles of Ergonomics 1. Work in neutral posture 2. Reduce excessive force 3. Keep everything in easy reach 4. Work at proper heights 5. Reduce excessive motion 6. Minimize fatigue and static load 7. Minimize pressure points 8. Provide clearance 9. Move, exercise, and stretch 10. Maintain a comfortable environment 11. Make display and controls understandable 12. Improve work organization 135
- 136. 136 At the end of the storm There is a golden sky
- 138. Contents • Inventory and the Flow of Materials • Supply and Demand Patterns • Objectives of Inventory Management • Inventory Costs • Economic Order Quantity (EOQ) 138
- 139. What is inventory? • Inventories are those materials and supplies carried on hand by a business or institution either for sale or to provide inputs or supplies to the production process. • Inventory management is responsible for planning and controlling inventory from the raw material stage until it reaches the consumer. 139
- 140. Classifying Inventories • One way of classifying inventories used often is related to the flow of materials into, through, and out of a manufacturing organization. • Raw materials , they include purchased materials, component parts, and subassemblies. • Work in process (WIP): Raw materials that have entered the manufacturing process and are being worked on or are waiting to be worked on. 140
- 141. Supply and Demand Patterns ØIn batch or lot manufacturing the basic purpose of inventories is to decouple supply and demand. • The purpose of inventories is thus to serve as a buffer:- vBetween customer demand and finished goods. vBetween finished goods and component availability. vBetween requirements for an operation and the output from the preceding operation. vBetween parts and materials to begin production and the suppliers of materials. 141
- 142. The role of inventory ØA quantity of commodity in the control of an enterprise, held for some time to satisfy some future demand for manufacturing:- • raw material, • purchased items, • semi-finished and finished products, • spare parts, and supplies inventory is buffer between supply and demand. 142
- 143. …Cont’d ØOn this basis inventories can be classified according to the function they perform. i) Anticipation Inventory: These inventories are built up in advance of a peak selling season, a promotion program, vacation shutdown, or possibly the threat of a strike. Ø They are built up to help level production and to reduce the costs of changing production rates. 143
- 144. …Cont’d ii) Fluctuation Inventory: Inventory is held to cover random unpredictable fluctuations in supply and demand or lead time. ØIf demand or lead time is greater than forecast, then a stockout will occur. ØSafety stock is carried to protect against the possibility of a stockout. ØIts purpose is to prevent disruptions in manufacturing or deliveries to customers. 144
- 145. …Cont’d iii) Lot Size Inventory: Items that are purchased or manufactured in quantities greater than needed immediately create lot size inventories. ØItems will be ordered in lots or batches to get quantity discounts, to reduce shipping, clerical, and setup costs and in cases where it is impossible to make or purchase items at the same rate they will be used or sold. 145
- 146. …Cont’d iv) Transportation Inventory: These inventories exist because of the time required to move stock from one location to another such as from a plant to a distribution center or a customer. ØThey are sometimes referred to as pipeline or movement inventories. 146
- 147. …Cont’d v) Hedge Inventory: Some products such as minerals and commodities (e.g., grains or animal products) are traded on a worldwide market. ØThe price for these products fluctuates according to world supply and demand. ØIf buyers expect that prices will rise, they can purchase hedge inventory when prices are low. 147
- 148. Objectives of Inventory Management 1. Maximum customer service 2. Low-cost plant operation, ØInventories allow operations with different rates of production to be operated separately and thus more economically. • In the case of production planning for seasonal products the demand varies non uniformly throughout the year. • One strategy was to level production and build anticipation inventory for sale in the peak periods. 148
- 149. …Cont’d ØInventories permit manufacturing to run longer production runs, which result in the following: • Lower setup costs per item • An increase in production capacity ØInventories allow manufacturing to purchase in larger quantities, which results in lower ordering costs per unit and quantity discounts. 149
- 150. 3. Minimum inventory investment • Customer service: The lower the inventory, the higher the likelihood of a stockout and the lower the level of customer service. • The higher the inventory level, the higher customer service will be. • Costs associated with changing production levels: Excess equipment capacity, overtime, hiring, training, and layoff costs will all be higher if production must fluctuate with demand. 150
- 151. …cont’d • Cost of placing orders: Lower inventories can be achieved by ordering less more often, but this practice results in higher annual ordering costs. • Transportation costs: Goods moved in small quantities cost more to move per unit than those moved in large quantities. • However, moving large lots of goods implies higher inventory. • If inventory is carried, there has to be a benefit that exceeds the costs of carrying that inventory. 151
- 152. Inventory Costs • Costs relevant to inventory mgt decisions are:- • Item cost/Purchase cost: The price paid for a purchased item consists of the cost of the item and any other direct costs associated in getting the item into the plant. • Purchasing cost: per-item cost paid to the supplier. • Let c be the unit cost and Q the numbers purchased (lot size).In the linear case cQ. • Carrying costs: These costs include all expenses incurred by the firm because of the volume of inventory carried. They can be broken down into three categories: frequently calculated as a % I of purchasing cost: h = ic can go up to 25-40 percent.152
- 153. Ordering costs • These are costs associated with the placing of an order either with the factory or a supplier. • The cost of placing an order does not depend upon the quantity ordered, however, the annual cost of ordering depends upon the number of orders placed in a year. • Cost of preparing and monitoring the order, each time an order is incurred. • It is a fixed cost A (independent of the lot size ordered, also called fixed cost). Has $/year unit. • Total cost for purchasing or producing a lot is A + cQ 153
- 154. …Cont’d • Stock out costs:- If demand during the lead time exceeds forecast, then we can expect a stockout. • Potentially a stockout can be expensive because of back-order costs, lost sales, and possibly lost customers. • Capacity-related costs:- When output levels must be changed, costs can be incurred for overtime, hiring, training, extra shifts, and layoff. 154
- 155. Measures of effectiveness • Inventory = service entity • Trade-off analysis between benefits and costs of carrying inventory. • The modeling approach optimizes the inventory system minimum average total cost per unit time. • The managerial approach multi-item systems • Months of supply • Annual inventory turnover • Inventory turnover 155
- 156. Inventory policies Three important factors: • What to order? – variety decision • When to order? – timing decision • How much to order? – quantity decision Also other factors:- ØPeriodic review policy ØContinuous review policy 156
- 157. …Cont’d 157
- 158. Inventory Models Ø Single period inventory models • Assumes the planning horizon is a single period and decision are made a single time Ø Multi period inventory models • Consider multiple period and decision Ø Depending on the nature of demand – Deterministic – Probabilistic/Stochastic • Inventory under risk (the distribution is known) • Inventory under uncertainty (the distribution is not know, but mean and variance are known) 158
- 159. Inventory Models • How much to order– Order quantity Q • When to order—Reorder level r • The time difference between placing an order and receiving an order is called Lead Time. • The reorder level is the demand required for the lead time; also called reorder demand. 159
- 160. Deterministic demand • The annual demand remains the same • The other information such as; üItem cost (purchasing cost) üHolding/carrying cost üOrdering cost and others are also remain the same. 160
- 161. Quantity decisions • Static lot sizing models – uniform (constant) demand over the planning horizon • Economic order quantity (EOQ) • Economic production quantity with extensions • Quantity discounts • Resource-constrained multiple-item models • Multi-item ordering – Dynamic lot sizing models – changing demand over the planning horizon 161
- 162. Economic order quantity (EOQ) • Introduced by1915 Harris / Wilson – there is a single inventory system – demand is uniform and deterministic and amounts to D units per time unit – no shortages are allowed – there is no order lead time – all the quantity ordered arrives at the same time (infinite replenishment rate) 162
- 163. …Cont’d 163
- 164. Model-1 Single Item • Single Item • Continuous demand • Instantaneous replenishment (lead time = 0) • Annual Demand = Demand/year • Let Q is the ordering quantity to be order every day, the graph will be: 164
- 165. …Cont’d 165
- 166. ….cont’d 166
- 167. …cont’d 167
- 168. …Cont’d 168
- 169. …cont’d 169
- 170. …cont’d 170
- 171. § Cambridge Chowder Co. consumes D = 60,000 cases of crackers per year. The crackers cost c = $4 per case, and each order incurs a delivery cost of K = $200. Money spent on crackers has an alternative investment with annual interest of 24%. • Demand: D = 60,000 cases per year • Fixed ordering cost: K = $200 per order • Variable ordering cost: c = $4 per case • Holding cost: h = $0.96 per case per year • Opportunity cost: alternative investment with 24% annual interest • holding 1 case for 1 year costs 4*24%= $0.96 = h 171
- 173. Project Management and Resource Allocation Chapter Five 173
- 174. Why we need to know about Project • “Any Project Managers, Project Management team members, Program Managers or Executives must Know how Project behaves” • Understanding about the Project is a foundation knowledge for managing it. 174
- 175. What is Project? • A project is a temporary (which has a beginning and an end) endeavor undertaken to create a unique (Distinct) product, service, or result. *Definition according to PMI* 175
- 176. Where do we need Project ? • Projects are undertaken: at all levels of the organization and they can involve a single person or many thousands. • Their duration ranges: few weeks to several years. • Projects can involve: one or many organizational units, such as joint ventures and partnerships 176
- 177. Characteristics of a Project ? • Temporary: – Definite beginning and End – Duration of either few weeks or several years – Ends when project objectives are met, cannot be met or no longer needed. • Unique – Different from other products and services. (unique deliverables) – Never done before • Progressive Elaboration (iterative process) begins as a concept…. – Gradual development of the detailed characteristics of the product or service 177
- 178. Projects and Project Management Proposed in Project Charter Specified in Project Scope Designed Programmed Installed at user site What the user wanted! 1-178
- 179. Project Attributes Ø A project: vHas a unique purpose vIs temporary vIs developed using progressive elaboration vRequires resources, often from various areas vShould have a primary customer or sponsor üThe project sponsor usually provides the direction and Funding for the project vInvolves uncertainty 179
- 180. § Computer related hardware and software projects • Include networking, infrastructure, and software design and development projects • Computer software projects include system software projects, • programming software projects, and • application software projects. • New Product Development • Construction Types of Projects 1-180
- 182. 182
- 183. 183
- 184. 184
- 185. 185
- 186. 186
- 188. 188
- 190. Project Life Cycle What is Successful Project ? 190
- 191. Project Life Cycle More on Project Phases ØIn early phases of a project life cycle: vResource needs are usually lowest vThe level of uncertainty (risk) is highest vProject stakeholders have the greatest opportunity to influence the project ØIn middle phases of a project life cycle: vThe certainty of completing a project improves vMore resources are needed ØThe final phase of a project life cycle focuses on: vEnsuring that project requirements were met vThe sponsor approves completion of the project 191
- 192. Evaluation Identification Preparation Appraisal/ financing Implementation The World Bank model Project life cycle 192
- 193. Wideman's corporate business, facility/product and project life spans compared 193
- 194. PMI Standard Committee's sample generic project life span 194
- 195. Kapur's information system project life span 195
- 196. Project Cost and Staffing Level Across the Project Life Cycle 196
- 197. Project will be successful if… • Purposeful (Objective) Well defined set of desired end result, which is measurable. Note: This quality of objective will enable to mark the project complete. • Have Life cycle Progress from an idea, through planning and execution, until they are complete. Have definite beginning and ending • Have interdependencies: Have defined sequence. • Progressive Elaboration Developing in steps and continuing by increments. Project entities are described in broad terms at the start of the project but detailed as project progress. Initially this may look failure prone as the details are not detailed, but will eventually 197
- 198. What is Operation • A n o p e r a t i o n i s a w o r k performed repetitively and is an on-going process. • It shares some characteristics with project , like it is performed by people 198
- 199. Project VS Operation • Similarities • Both are performed by people • Both have deliverables • Both have limited resources • Both are Planned, Executed and Controlled (need to be managed) • Differences: • Project is temporary in nature , whereas an operation is ongoing • Projects have temporary teams , whereas operations have permanent teams (relatively) • Each project is unique in nature, whereas operation steps are identical 199
- 200. Project VS Operation Projects • To attain its objectives and terminate • Create own character, organization, and goals • Catalyst for change • Unique product or services • Heterogeneous teams • Start and end date Examples • Producing a News letter • Writing and publishing a book • Implementing a LAN • Hiring a sales man • Arrange for a conference • Opening for a new shop • Producing the annual report Operations • To sustain the business • Semi permanent charter, organization, and goals • Maintain status quo • Standard product or services • Homogeneous teams • Ongoing Examples • Responding to customers requests • Writing a letter to a Prospect • Hooking up a Printer to a computer • Meeting with an employee • Attending a conference • Opening the shop • Writing a progress update memo 200
- 201. Project and Production qIdea qDesign qPlan qConcrete entity – Factory – Building – Highway – Prototype – Products – Services 201
- 202. qProject – Automobile factory – Build a house – Construct a hospital – Conceive new product – Develop prototype qProduction – Produce automobiles – Operate household – Treat patients – Manufacture – Manufacture multiples 202
- 203. How is the Project Initiated v A Market Demand & Organizational Need v A Customer Request v A Technological Advancement v A Legal Requirement v Ecological Impacts v Social need 203
- 204. Project and Strategy • Projects are a means of organizing activities that cannot be addressed within the organization’s normal operational limits. • Projects are therefore often utilized as a means of achieving an organization’s strategic plan, whether the project team is employed by the organization or is a contracted service provider. 204
- 205. Project Management • Project management is: the application of knowledge, skills, tools and techniques to project activities to meet project requirements. • The discipline of project management is about providing the tools and techniques that enable the project team (not just the project manager) to organize their work to meet these constraints 205
- 206. Why Project Management? • It consists all type of management in one package • It requires a minimum of Five area expertise • Since project is UNIQUE in nature, it requires unique management • It is a management of Project constraint 206
- 207. What is managed in Project • Performance, Cost, and Time Project Targets (According to other Versions) Decode Target Budget limit Required Performance Due date Performance Time / Schedule Cost 207
- 208. How Do We Accomplish Project Management? It can be accomplished through the use of the processes of initiating, planning, executing, monitoring and controlling, and closing. 208
- 209. Who is Responsible for Project Management • Project Manager is an individual Responsible/ Accountable for Managing the Project • Project Management can be performed by Individual or Team . However, • Project must be done in Team 209
- 210. Competence required for Project Management • The Project Management Body of knowledge • Application area Knowledge, Standards and Regulations • Project Environment Knowledge • General Management Knowledge and skills • Soft skill and human relations skill 210
- 211. Project and Program Management • A Program is: a group of related projects managed in a coordinated way to obtain benefits and control which is not available from managing them individually. Programs may include elements of related work outside of the s c o p e o f t h e d i s c r e t e p r o j e c t s i n t h e p r o g ra m . • Program may include elements of ongoing operations, as well as projects. 211
- 212. Project Portfolio and Project Management • Project portfolio management refers to the selection and support of projects or program investments. These investments in projects and programs are guided by organization’s strategic plan and available resources. * The projects or programs in the portfolio may not necessarily be interdependent or directly related. 212
- 213. Projects Programs Portfolios Scope Projects have defined objectives. Scope is progressively elaborated throughout the life cycle Have a larger scope and provide more significant benefits Portfolios have a business scope that changes with the strategic goals of the org Change Project managers expect change and implement processes to keep change managed and Controlled The program manager must expect change from inside and outside the program and be prepared to manage it Portfolio managers continually monitor changes in the broad environment Planning Project manages progressively elaborate high level information into detailed plans throughout the project life cycle Program managers develop the overall program plan and create high level plans to guide detailed planning at the end of the component level Portfolio manages create and maintain necessary processes and communication relative to the aggregate portfolio 35 213
- 214. Projects Programs Portfolios Management Success Project managers manage the project team to meet the project objectives Success is measured by product and project quality , timelines , budget compliance, and degree of customer satisfaction Program managers manage the program staff and the project managers ; they provide vision and overall leadership Success is measured by the degree to which the program satisfies the needs and benefits for which it was undertaken Portfolio managers may manage or coordinate portfolio management staff Success is measured in terms of aggregate performance of portfolio components Monitoring Project managers monitor and control the work of producing the products , services , results that the project was undertaken to produce Program managers monitor the progress of program components to ensure the overall goals , schedules, budget& benefits of the program will be met Portfolio managers monitor aggregate performance and value indicators Program Project Portfolio 214
- 215. v Completing a project charter and getting signatures on it. Project Life Cycle Project Initiation Ø Initiating a project includes recognizing and starting a new project or project phase. Ø Some organizations use a pre-initiation phase, while others include items such as developing a business case as part of the initiation. Ø The main goal is to formally select and start off projects. Ø Key outputs include: v Assigning the project manager. v Identifying key stakeholders. v Completing a business case. 215
- 216. Project Initiation Documents Ø Every organization has its own variations of what documents are required to initiate a project. Ø It’s important to identify the project need, stakeholders, and main goals. 216
- 217. ØThe main purpose of project planning is to guide execution ØEvery knowledge area includes planning information ØKey outputs include: vA team contract vA project scope statement vA work breakdown structure (WBS) vA project schedule, in the form of a Gantt chart with all dependencies and resources entered vA list of prioritized risks (part of a risk register) Project Planning 217
- 218. ØUsually takes the most time and resources to perform project execution ØProject managers must use their leadership skills to handle the many challenges that occur during project execution ØMany project sponsors and customers focus on deliverables related to providing the products, services, or results desired from the project ØA milestone report can help focus on completing major milestones Project Executing 218
- 219. ØInvolves measuring progress toward project objectives, monitoring deviation from the plan, and taking correction actions ØAffects all other process groups and occurs during all phases of the project life cycle ØOutputs include performance reports, requested changes, and updates to various plans Project Monitoring and Controlling 219
- 220. ØInvolves gaining stakeholder and customer acceptance of the final products and services ØEven if projects are not completed, they should be closed out to learn from the past ØOutputs include project archives and lessons learned, part of organizational process assets ØMost projects also include a final report and presentation to the sponsor/senior management Project Closing 220
- 221. Project Integration Processes Integration Management Time Management Scope Management Cost Management Quality Management HR Management Risk Management Procurement Management Communication Management Project Integration 221
- 222. Work Breakdown Structures (WBS) and Risk Assessment ØThe WBS assists project leaders, participants, and stakeholders in the development of a clear vision of the end products or outcomes to be produced by the project. ØA deliverables-oriented grouping of project elements that organizes and defines the total work scope of the project. ØIt provides the framework for all deliverables throughout the project life cycle. ØEach descending level represents an increasingly detailed definition of the project work. 222
- 223. Scope (definition) Project Management Processes (Initiation) Initiation Cost (estimates, …) WBS Time (activity diagrams, …) Human Resources (Labour and professional matrix, …) • Also to consider: Quality, Risk, Communication, Procurement, Integration (knowledge areas) Project Charter Project Management Plan Project Scope Statement 223
- 224. Possible levels in a WBS Project Sub-projects Deliverables Sub-deliverables Work packages Work units 224
- 225. Design: The WBS provides a graphical representation or textual outline of the project scope. Some of the main roles the WBS plays in supporting clarity for project definition are that it: Decomposes: the overall project scope into clearly defined deliverables. Defines: the scope of the project in terms that the stakeholders can understand. Provides: a structure for organizing information regarding the project’s progress, status, and performance. Supports: tracking of risks to assist the project manager in identifying and implementing necessary responses. 225
- 226. Levels: The depth of the WBS is dependent upon the size and complexity of the project and the level of detail needed to plan and manage it. The 100% Rule: This rule states that the WBS includes 100% of the work defined by the project scope and captures all work deliverables to be completed, including project management. The rule applies to all levels within the hierarchy. 226
- 227. WBS for Software development Project 227
- 228. Purpose of a WBS • An instrument for tracking costs and work performance. • Provides a coordinating framework for the various parts of a project. • Defines authority and responsibilities for the details of the project. • Provides the capacity to sum or “roll up” the cost of each project phase. • Identifies “work packages.” 228
- 229. Purpose of a WBS CONT’D § It helps prevent work from slipping through the cracks. § It provides the project team members with an understanding of where their pieces fit into the overall project management plan. § It facilitates communication and cooperation among team members. § It helps prevent changes. § It provides a basis for estimating staff, cost, and time. § It gets team buy-in and builds the team. § It helps people get their minds around the project. 229
- 230. 1. It helps prevent work from slipping through the cracks. 2. It provides the project team members with an understanding of where their pieces fit into the overall project management plan. 3. It facilitates communication and cooperation among team members. 4. It helps prevent changes. 5. It provides a basis for estimating staff, cost, and time. 6. It gets team buy-in and builds the team. 7. It helps people get their minds around the project. 230
- 231. Identifying Work Packages • Identify major project work deliverables/systems. Then the sub-deliverables necessary to accomplish the larger deliverables are defined. • The process is repeated until the sub-deliverable detail is small enough to be manageable and where one person is responsible. This lowest deliverable usually consists of several work packages. • Work packages within a deliverable are grouped by type of work: foundation, framing, finish; hardware, programming, testing, etc. • Also referred to as cost accounts, work packages facilitate a system for monitoring project progress by work completed, cost and responsibility. 231
- 232. Most commonly, the project title goes at the top of the WBS. 1. The first level is normally the same as the project life cycle. 2. The following levels break the project into smaller pieces. 3. This is a top – down effort to decompose the deliverables and 4. the work required to produce them. 5. The complete scope of the project (product, project, and management efforts) are included. 6. Note that each work package consists of nouns (things) rather than actions. 232
- 233. 233 NETWORK TECHNIQUES PERT CPM -Program Evaluation and Review Technique - developed by the US Navy with Booz Hamilton Lockheed - on the Polaris Missile/Submarine program 1958 Critical Path Method Developed by El Dupont for Chemical Plant Shutdown Project- about same time as PERT üBoth use same calculations, almost similar üMain difference is probabilistic and deterministic in time estimation üGantt Chart also used in scheduling
- 234. 234 • Graphical portrayal of activities and event • Shows dependency relationships between tasks/activities in a project. • Clearly shows tasks that must precede (precedence) or follow (succeeding) other tasks in a logical manner. • Clear representation of plan – a powerful tool for planning and controlling project. NETWORK SCHEDULING
- 235. 235 DEFINITION OF TERMS IN A NETWORK DIAGRAM • Activity: any portions of project (tasks) which required by project, uses up resource and consumes time – may involve labor, paper work, contractual negotiations, machinery operations Activity on Arrow (AOA) showed as arrow, AON – Activity on Node • Event: beginning or ending points of one or more activities, instantaneous point in time, also called ‘nodes’ • Network: Combination of all project activities and the events ACTIVITY PRECEEDING SUCCESSOR EVENT
- 236. 236 Emphasis on Logic in Network Construction • Construction of network should be based on logical or technical dependencies among activities • Example - before activity ‘Approve Drawing’ can be started the activity ‘Prepare Drawing’ must be completed • Common error – build network on the basis of time logic (a feeling for proper sequence ) see example below WRONG !!! CORRECT ü
- 237. 237 Example 1- A simple network Consider the list of four activities for making a simple product: Activity Description Immediate predecessors A Buy Plastic Body - B Design Component - C Make Component B D Assemble product A,C Immediate predecessors for a particular activity are the activities that, when completed, enable the start of the activity in question.
- 238. 238 Sequence of activities • Can start work on activities A and B anytime, since neither of these activities depends upon the completion of prior activities. • Activity C cannot be started until activity B has been completed • Activity D cannot be started until both activities A and C have been completed. • The graphical representation (next slide) is referred to as the PERT/CPM network
- 239. 239 Network of Four Activities 1 3 4 2 A B C D Arcs indicate project activities Nodes correspond to the beginning and ending of activities
- 240. 240 Example 2 Develop the network for a project with following activities and immediate predecessors: Activity Immediate predecessors A - B - C B D A, C E C F C G D,E,F Try to do for the first five (A,B,C,D,E) activities
- 241. 241 Network of first five activities 1 3 4 2 A B C D 5 E We need to introduce a dummy activity
- 242. 242 •Note how the network correctly identifies D, E, and F as the immediate predecessors for activity G. •Dummy activities is used to identify precedence relationships correctly and to eliminate possible confusion of two or more activities having the same starting and ending nodes •Dummy activities have no resources (time, labor, machinery, etc) – purpose is to PRESERVE LOGIC of the network Network of Seven Activities 1 3 4 2 A B C D 5 E 7 6 F G dummy
- 243. 243 EXAMPLES OF THE USE OF DUMMYACTIVITY Dummy RIGHT ü 1 1 2 Activity c not required for e a b c d e a b c d e WRON G!!! RIGHT ü Network concurrent activities 1 2 1 2 3 a WRONG!!! a b b WRONG ! RIGHT ü
- 244. 244 1 1 2 2 3 3 4 a d b e c f a d b e f c WRONG!!! RIGHT!!! a precedes d. a and b precede e, b and c precede f (a does not precede f)
- 245. Project Crashing ■Project duration can be reduced by assigning more resources to project activities. ■However, doing this increases project cost. ■Decision is based on analysis of trade-off between time and cost. ■Project crashing is a method for shortening project duration by reducing one or more critical activities to a time less than normal activity time. 245
- 246. The Project Network Number Activity Predecessor Duration 1 Design house and obtain financing -- 12 months 2 Lay foundation 1 8 months 3 Order and receive materials 1 4 months 4 Build house 2,3 12 months 5 Select paint 2, 3 4 months 6 Select carper 5 4 months 7 Finish work 4, 6 4 months 246
- 247. Project Crashing and Time-Cost Trade-Off Example Problem The project network for building a house 247
- 248. Normal activity and crash data for the network Project Crashing and Time-Cost Trade-Off Example Problem 248
- 249. Project Crashing and Time-Cost Trade-Off Example Problem Time-cost relationship for crashing activity 1 Crash cost & crash time have a linear relationship $2000 $400/ 5 Total Crash Cost week Total Crash Time weeks 249
- 250. Network with normal activity times and weekly crashing costs Project Crashing and Time-Cost Trade-Off Example Problem 250
- 251. Revised network with activity 1 crashed Project Crashing and Time-Cost Trade-Off Example Problem As activities are crashed, the critical path may change and several paths may become critical. 251
- 252. Project Crashing and Time-Cost Trade-Off QM for Windows Output 252
- 253. Project Crashing and Time-Cost Trade-Off QM for Windows 253
- 254. Project Crashing and Time-Cost Trade-Off General Relationship of Time and Cost ■Project crashing costs and indirect costs have an inverse relationship. ■Crashing costs are highest when the project is shortened. ■Indirect costs increase as the project duration increases. ■The optimal project time is at the minimum point on the total cost curve. 254
- 255. Project Crashing and Time-Cost Trade-Off General Relationship of Time and Cost The time-cost trade-off 255
- 256. 10-256 Gantt Charts ü Establish a time-phased network ü Can be used as a tracking tool Benefits of Gantt charts 1. Easy to create and comprehend 2. Identify the schedule baseline network 3. Allow for updating and control 4. Identify resource needs
- 257. 10-257 Create a Gantt chart based on the activities listed in the table. Task Time Pred A 8 -- B 5 A C 8 A D 4 B,C E 5 D
- 258. 10-258 Crashing The process of accelerating a project Principal methods for crashing ØImproving existing resources’ productivity ØChanging work methods ØIncreasing the quantity of resources
- 259. 10-259 Managerial Considerations • Determine activity fixed and variable costs • The crash point is the fully expedited activity • Optimize time-cost tradeoffs • Shorten activities on the critical path • Cease crashing when – the target completion time is reached – the crashing cost exceeds the penalty cost
- 260. 10-260 What is the lowest cost to complete this project in 52 weeks? Times are in weeks and costs in dollars. Plot the AON & AOA networks and the GANTT chart. Activity Pred Normal Time Min Time Normal Cost Crash Cost A -- 14 9 500 1500 B A 5 2 1000 1600 C A 10 8 2000 2900 D B, C 8 5 1000 2500 E D 6 6 1600 1600 F D 9 6 1500 3000 G E, F 7 4 600 1800 H G 15 11 1600 3600
- 261. 10-261 Activity on Arrow Networks üActivities represented by arrows üWidely used in construction üEvent nodes easy to flag üForward and backward pass logic similar to AON ü Two activities may not begin and end at common nodes üDummy activities may be required
- 262. 10-262 1. Use AOA to sketch the network that represents the project as described in the table. 2. Calculate early and late event times for all activities. Activity Time Pred Activity Time Pred A 4 -- F 15 E B 2 A G 4 E C 10 A H 7 D,F,G D 3 B I 11 H E 15 B,C
- 263. 10-263 Activity on Arrow Network A H F D E C B I G
- 264. 10-264 Controversies in the Use of Networks vNetworks can be too complex vPoor network construction creates problems vNetworks may be used inappropriately vWhen employing subcontractors – The master network must be available to them – All sub-networks must use common methods vPositive bias exists in PERT networks
- 266. 266
- 267. Preliminaries • STELLAR access: to be announced • AS1 Survey due by tonight 12 pm • TP1 and AS2 are out 267
- 268. AS 2: Student Presentation 268
- 269. Preliminaries • STELLAR access: to be announced • AS1 Survey due by tonight 12 pm • TP1 and AS2 are out • Pictures will be taken before you leave • Who we are • Don’t memorize course content. Understand it. 269
- 270. Outline ØSession Objective & Context § Project Financing § Owner § Project § Contractor § Additional Issues § Financial Evaluation § Time value of money § Present value § Rates § Interest Formulas § NPV § IRR & payback period § Missing factors 270
- 271. Session Objective • The role of project financing • Mechanisms for project financing • Measures of project profitability 271
- 272. Project Management Phase FEASIBILITY DESIGN PLANNING CLOSEOUT DEVELOPMENT OPERATIONS Financing & Evaluation Ris k 272
- 273. Context: Feasibility Phases – Project Concept – Land Purchase & Sale Review – Evaluation (scope, size, etc.) – Constraint survey • Site constraints • Cost models • Site infrastructural issues • Permit requirements – Summary Report – Decision to proceed – Regulatory process (obtain permits, etc) – Design Phase 273
- 274. Lecture 2 - References More details on: – Hendrickson PM for Construction on-line textbook • Chapter 7 274
- 275. Outline üSession Objective & Context ØProject Financing § Owner § Project § Contractor § Additional Issues § Financial Evaluation § Time value of money § Present value § Rates § Interest Formulas § NPV § IRR & payback period § Missing factors 275
- 276. Financing – Gross Cashflows years 1 2 3 4 5 6 7 8 9 10 OWNER investment ($10,000,000) ($20,000,000) operation incomes $2,000,000 $4,000,000 $6,000,000 $6,000,000 $6,000,000 $6,000,000 $6,000,000 owner cashflow $0 ($10,000,000) ($20,000,000) $2,000,000 $4,000,000 $6,000,000 $6,000,000 $6,000,000 $6,000,000 $6,000,000 owner cum cashflow $0 ($10,000,000) ($30,000,000) ($28,000,000) ($24,000,000) ($18,000,000) ($12,000,000) ($6,000,000) $0 $6,000,000 CONTRACTOR costs ($4,000,000) ($7,000,000) ($14,000,000) $0 $0 $0 $0 $0 $0 $0 revenues $0 $10,000,000 $20,000,000 $0 $0 $0 $0 $0 $0 $0 contractor cashflow ($4,000,000) $3,000,000 $6,000,000 $0 $0 $0 $0 $0 $0 $0 contractor cum cashflow ($4,000,000) ($1,000,000) $5,000,000 $5,000,000 $5,000,000 $5,000,000 $5,000,000 $5,000,000 $5,000,000 $5,000,000 Owner investment = contractor revenue 276
- 277. Financing – Gross Cashflows years 1 2 3 4 5 6 7 8 9 10 OWNER investment ($10,000,000) ($20,000,000) operation incomes $2,000,000 $4,000,000 $6,000,000 $6,000,000 $6,000,000 $6,000,000 $6,000,000 owner cashflow $0 ($10,000,000) ($20,000,000) $2,000,000 $4,000,000 $6,000,000 $6,000,000 $6,000,000 $6,000,000 $6,000,000 owner cum cashflow $0 ($10,000,000) ($30,000,000) ($28,000,000) ($24,000,000) ($18,000,000) ($12,000,000) ($6,000,000) $0 $6,000,000 CONTRACTOR costs ($4,000,000) ($7,000,000) ($14,000,000) $0 $0 $0 $0 $0 $0 $0 revenues $0 $10,000,000 $20,000,000 $0 $0 $0 $0 $0 $0 $0 contractor cashflow ($4,000,000) $3,000,000 $6,000,000 $0 $0 $0 $0 $0 $0 $0 contractor cum cashflow ($4,000,000) ($1,000,000) $5,000,000 $5,000,000 $5,000,000 $5,000,000 $5,000,000 $5,000,000 $5,000,000 $5,000,000 Owner investment = contractor revenue Design/Preliminary Construction 277
- 278. Financing – Gross Cashflows years 1 2 3 4 5 6 7 8 9 10 OWNER investment ($10,000,000) ($20,000,000) operation incomes $2,000,000 $4,000,000 $6,000,000 $6,000,000 $6,000,000 $6,000,000 $6,000,000 owner cashflow $0 ($10,000,000) ($20,000,000) $2,000,000 $4,000,000 $6,000,000 $6,000,000 $6,000,000 $6,000,000 $6,000,000 owner cum cashflow $0 ($10,000,000) ($30,000,000) ($28,000,000) ($24,000,000) ($18,000,000) ($12,000,000) ($6,000,000) $0 $6,000,000 CONTRACTOR costs ($4,000,000) ($7,000,000) ($14,000,000) $0 $0 $0 $0 $0 $0 $0 revenues $0 $10,000,000 $20,000,000 $0 $0 $0 $0 $0 $0 $0 contractor cashflow ($4,000,000) $3,000,000 $6,000,000 $0 $0 $0 $0 $0 $0 $0 contractor cum cashflow ($4,000,000) ($1,000,000) $5,000,000 $5,000,000 $5,000,000 $5,000,000 $5,000,000 $5,000,000 $5,000,000 $5,000,000 Owner investment = contractor revenue • Early expenditu • Takes time to g Design/Preliminary Construction 278
- 280. Critical Role of Financing • Makes projects possible • Has major impact on – Riskiness of construction – Claims – Prices offered by contractors (e.g., high bid price for late payment) • Difficulty of Financing is a major driver towards alternate delivery methods (e.g., Build-Operate- Transfer) 280
- 281. How Does Owner Finance a Project? • Public • Private • “Project” financing 281
- 282. Outline üSession Objective & Context ØProject Financing ØOwner § Project § Contractor § Additional Issues § Financial Evaluation § Time value of money § Present value § Rates § Interest Formulas § NPV § IRR & payback period § Missing factors 282
- 283. Public Financing • Sources of funds – General purpose or special-purpose bonds – Tax revenues – Capital grants subsidies – International subsidized loans • Social benefits important justification – Benefits to region, quality of life, unemployment relief, etc. • Important consideration: exemption from taxes • Public owners face restrictions (e.g. bonding caps) – Major motivation for public/private partnerships • MARR (Minimum Attractive Rate of Return) much lower (e.g. 8-10%), often standardized 283
- 284. Private Financing • Major mechanisms – Equity • Invest corporate equity and retained earnings • Offering equity shares – Stock Issuance (e.g. in capital markets) • Must entice investors with sufficiently high rate of return • May be too limited to support the full investment • May be strategically wrong (e.g., source of money, ownership) – Debt • Borrow money • Bonds • Because higher costs and risks, require higher returns • MARR varies per firm, often high (e.g. 20%) 284
- 285. Private Owners w/Collateral Facility Distinct Financing Periods • Short-term construction loan – Bridge Debt • Risky (and hence expensive!) • Borrowed so owner can pay for construction (cost) • Long-term mortgage – Senior Debt • Typically facility is collateral • Pays for operations and Construction financing debts • Typically much lower interest • Loans often negotiated as a package time construction w/o tangible operation w/ tangible 285
- 286. Outline üSession Objective & Context ØProject Financing § Owner ØProject § Contractor § Additional Issues § Financial Evaluation § Time value of money § Present value § Rates § Interest Formulas § NPV § IRR & payback period § Missing factors 286
- 287. “Project” Financing • Investment is paid back from the project profit rather than the general assets or creditworthiness of the project owners • For larger projects due to fixed cost to establish – Small projects not much benefit • Investment in project through special purpose corporations – Often joint venture between several parties • Need capacity for independent operation • Benefits – Off balance sheet (liabilities do not belong to parent) – Limits risk – External investors: reduced agency cost (direct investment in project) • Drawback – Tensions among stakeholders 287
- 288. Outline üSession Objective & Context ØProject Financing § Owner § Project ØContractor § Additional Issues § Financial Evaluation § Time value of money § Present value § Rates § Interest Formulas § NPV § IRR & payback period § Missing factors 288
- 289. Contractor Financing I • Payment schedule – Break out payments into components • Advance payment • Periodic/monthly progress payment (itemized breakdown structure) • Milestone payments – Often some compromise between contractor and owner – Architect certifies progress – Agreed-upon payments • retention on payments (usually, about 10%) – Often must cover deficit during construction – Can be many months before payment received 289
- 291. S-curve Cost 0 1 2 3 4 5 6 7 8 1 2 3 4 5 6 7 8 9 10 11 12 13 14 15 16 17 18 19 20 21 22 Working days $K 0 10 20 30 40 50 60 70 80 90 100 Cumulative costs $K Daily cost Cum. costs 291
- 293. Contractor Financing II • Owner keeps an eye out for – Front-end loaded bids (discounting) – Unbalanced bids 293
- 294. Contractor Financing II • Owner keeps an eye out for – Front-end loaded bids (discounting) – Unbalanced bids • Contractors frequently borrow from – Banks (Need to demonstrate low risk) • Interaction with owners – Some owners may assist in funding • Help secure lower-priced loan for contractor – Sometimes assist owners in funding! • Big construction company, small municipality • BOT 294
- 295. • Agreed upon in contract – Often structure proposed by owner – Should be checked by owner (fair-cost estimate) – Often based on “Masterformat” Cost Breakdown Structure (Owner standard CBS) • Certified by third party (Architect/engineer) Contractor Financing III 295
- 296. Outline üSession Objective & Context ØProject Financing § Owner § Project § Contractor ØAdditional Issues § Financial Evaluation § Time value of money § Present value § Rates § Interest Formulas § NPV § IRR & payback period § Missing factors 296
- 297. Latent Credit • Many people forced to serve as lenders to owner due to delays in payments – Designers – Contractors – Consultants – CM – Suppliers • Implications – Good in the short-term – Major concern on long run effects 297
- 298. Role of Taxes • Tax deductions for – Depreciation - Link • the process of recognizing the using up of an asset through wear and obsolescence and of subtracting capital expenses from the revenues that the asset generates over time in computing taxable income – Others 298
- 299. Outline üSession Objective & Context üProject Financing § Owner § Project § Contractor § Additional Issues ØFinancial Evaluation § Time value of money § Present value § Rates § Interest Formulas § NPV § IRR & payback period § Missing factors 299
- 300. Develop or Not Develop • Is any individual project worthwhile? • Given a list of feasible projects, which one is the best? • How does each project rank compared to the others on the list? 300
- 301. Project Evaluation Example: • Project A • Construction=3 years • Cost = $1M/year • Sale Value=$4M • Total Cost? • Profit? • Project B • Construction=6 years • Cost=$1M/year • Sale Value=$8.5M • Total Cost? • Profit? 301
- 302. Quantitative Method • Profitability – Create value for the company 302
- 303. Profit 303
- 304. Quantitative Method • Profitability – Create value for the company • Opportunity Cost – Time Value of Money • A dollar today is worth more than a dollar tomorrow – Investment relative to best-case scenario • E.g. Project A - 8% profit, Project B - 10% profit 304
- 305. Money Is Not Everything • Social Benefits – Hospital – School – Highway built into a remote village • Intangible Benefits (E.g, operating and competitive necessity) – New warehouse – New cafeteria 305
- 306. Outline üSession Objective & Context üProject Financing § Owner § Project § Contractor § Additional issues ØFinancial Evaluation ØTime value of money § Present value § Rates § Interest Formulas § NPV § IRR & payback period § Missing factors 306
- 307. Basic Compounding • Suppose we invest $x in a bank offering interest rate i • If interest is compounded annually, asset will be worth – $x(1+i) after 1 year – $x(1+i)2 after 2 years – $x(1+i)3 after 3 years …. – $x(1+i)n after n years $x 0 1 $x(1+i) 2 $x(1+i) n $x(1+i) … 307
- 308. Time Value of Money • If we assume – That money can always be invested in the bank (or some other reliable source) now to gain a return with interest later – That as rational actors, we never make an investment which we know to offer less money than we could get in the bank • Then – Money in the present can be thought as of “equal worth” to a larger amount of money in the future – Money in the future can be thought of as having an equal worth to a lesser “present value” of money 308