1. Introduction Results
Mineral and collagen maturity in a polygenic murine model of type 2 diabetes point to
complex effects of sustained hyperglycemia on bone tissue composition
David Diaz, Tarryn Tertulien, Michelle A. Chin, Ida Adjivon, Daniel Weinreb, Dr. Karen B. King, Dr. Eve Donnelly
Objective
Methods
Discussion
• Thematerialpropertiesofbonetissuemaybealteredintype2diabetics.
Compare bone tissue compositional properties between type 2 diabetic
mice (KKA ) and their non-diabetic siblings (KKaa).
Cornell University, Ithaca, NY and University of Colorado School of Medicine
Acknowledgments
• Carbonate:Phosphate
• Collagen Maturity
Ratio of trivalent collagen crosslinks to divalent
collagen crosslinks
• Crystallinity
Amount of stoichiometrically perfect hydroxyapatite
crystals to non-perfect crystals
• The wider carbonate:phosphate ratio distribution width in cortical tissue from
KKAy
mice is consistent with greater remodeling activity.
Tarryn T. Tertulien Rena Mazur
Michelle A. Chin Ida A. Adjivon
Dan Weinreb Jared Pearl
• KKAy
micewere6.2%heavierand had19.8%higherbloodglucoselevelsthanKKaa
controlsafter20weeks(* = p<0.05 by t-test).
• Theeffectsoftype2diabetesonbonematrixpropertiesandcompositionarenot
completelyunderstood.
• ApolygenicmousemodelKKA ,characterizedbyobesityandseverehyperinsulinaemia,
wasusedtomimicsymptomsoftype2diabetes.
y
• Direct assessment of mechanical properties is required to discern the functional
effects of these complex concomitant changes in mineral properties on fracture behavior
• The greater mean carbonate:phosphate ratio in bone from KKAy
mice indicates
increased substitution of carbonate for phosphate in the hydroxyapatite lattice
with hyperglycemia
- Suggests that greater mineral maturity may occur with type 2 diabetes,
which is consistent with increased fracture risk
Non-diabetic
KKaa (n=26)
Type 2 diabetic
KKA (n=23)
Excised proximal
femora
Microtomed into
thin sections
Each section was scanned
using Fourier Transform
Infrared Imaging (FTIRI)
Spectral data was collected at each pixel.
Compositional data was found by peak
area and height of three molecules
• Mineral:Matrix
Amount of phosphate incorporated into the
organic collagen matrix
Substitution of carbonate for phosphate into the
hydroxyapatite lattice
Figure 4. Pixel histogram distribution mean and width of the mineral:matrix ratio,
carbonate:phosphate, collagen maturity and crystallinity for 6um-resolution cortical and trabec-
ular FTIR images. * p<0.05 by t-test, # 0.05<p<1.
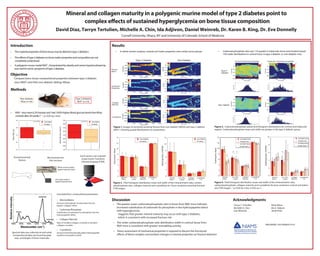
Figure 1. Images of sectioned proximal femora from non-diabetic (KKAA) and type 2 diabetic
(KKA ) showing spatial distributions of composition.
Figure 3. Pixel histogram distribution mean and width of the mineral:matrix ratio, carbon-
ate:phosphate ratio, collagen maturity and crystallinity for 25um-resolution proximal femoral
FTIR images.
Mineral:
Matrix
Collagen
Maturity
Crystallinity
DistributionMean
Heterogeneity(FWHM)
Mineral:
Matrix
Collagen
Maturity
Crystallinity
Heterogeneity(FWHM)
Mineral:
Matrix
Collagen
Maturity
Crystallinity
DistributionMean
Mineral:
Matrix
Collagen
Maturity
Crystallinity
Cortical Carbonate:phosphate Trabecular Carbonate:phosphate
Type 2
Diabetic
Non-diabetic
Mineral:
Matrix
Carbonate:
Phosphate
Collagen
Maturity
Crystallinity
Type 2 Diabetic Non-Diabetic
Figure 2. Carbonate:phosphate spatial and histogram distributions for cortical and trabecular
regions. Carbonate:phosphate mean and width are greater in the type 2 diabetic group.
y
25
30
35
40
45
150
200
250
300
350
400
450
500
550
p=0.016
BodyMass(g)
BloodGlucose(mg/dL)
p=0.004
y
Calculated four compositional parameters.
y
Whole-section analysis
Spatial resolution 25μm
Sub-region analysis
Spatial resolution 6μm
• In whole-section analyses, mineral and matrix properties were similar across groups • Carbonate:phosphate ratio was 11% greater in trabecular tissue and trended toward
15% wider distributions in cortical tissue in type 2 diabetic vs. non-diabetic mice
NIH/NIAMS 1K01AR064314-01