SlideShare a Scribd company logo
1 of 10
EXAMPLE 3      Graph a function of the form y = ax2 + bx
               +c
 Graph y = 2x2 – 8x + 6.
 SOLUTION
 STEP 1 Identify the coefficients of the function. The
        coefficients are a = 2, b = – 8, and c = 6. Because
        a > 0, the parabola opens up.
 STEP 2 Find the vertex. Calculate the x - coordinate.
                b         (– 8)
        x =–        = –         = 2
               2a
                          2(2)
        Then find the y - coordinate of the vertex.
         y = 2(2)2 – 8(2) + 6 = – 2
         So, the vertex is (2, – 2). Plot this point.
EXAMPLE 3     Graph a function of the form y = ax2 + bx
              +c
 STEP 3 Draw the axis of symmetry x = 2.
 STEP 4 Identify the y - intercept c,
        which is 6. Plot the point (0, 6).
        Then reflect this point in the
        axis of symmetry to plot
        another point, (4, 6).
 STEP 5 Evaluate the function for
        another value of x, such as
             x = 1.
        y = 2(1)2 – 8(1) + 6 = 0
         Plot the point (1, 0) and its
         reflection (3, 0) in the axis of
         symmetry.
EXAMPLE 3   Graph a function of the form y = ax2 + bx
            +c
 STEP 6 Draw a parabola through the plotted points.
GUIDED PRACTICE         for Example 3

 Graph the function. Label the vertex and axis of
 symmetry.
 4.   y = x2 – 2x – 1
 SOLUTION
 STEP 1 Identify the coefficients of the function. The
        coefficients are a = 1, b = – 2, and c = – 1.
        Because a > 0, the parabola opens up.
 STEP 2 Find the vertex. Calculate the x - coordinate.
                b       (– 2)
        x =           –         = 1
               2a =
                        2(1)
        Then find the y - coordinate of the vertex.
         y = 12 – 2 1 + 1 = – 2
GUIDED PRACTICE          for Example 3

 So, the vertex is (1, – 2). Plot this point.
 STEP 3 Draw the axis of symmetry x = 1.
GUIDED PRACTICE          for Example 3

 5.   y = 2x2 + 6x + 3
 SOLUTION
 STEP 1 Identify the coefficients of the function. The
        coefficients are a = 2, b = 6, and c = 3. Because
        a > 0, the parabola opens up.
 STEP 2 Find the vertex. Calculate the x - coordinate.
             –b       –6     –3
         x =     =        =
              2a     2 2       2
        Then find the y - coordinate of the vertex.
           y=2       ( )
                    –3
                      2
                         +6    ( )
                                –3
                                   2
                                       + 3 =–9
                            –3
        So, the vertex is        , – 9. Plot this point.
                             2
GUIDED PRACTICE      for Example 3

                                      –3
 STEP 3 Draw the axis of symmetry x =
                                       2
GUIDED PRACTICE             for Example 3
                  1 2
 6.   f (x) = –     x – 5x + 2
                  3
 SOLUTION
 STEP 1 Identify the coefficients of the function. The
                                1
        coefficients are a =  – , b = – 5, and c = 2 .
                                 3
        Because a > 0, the parabola opens up.
 STEP 2 Find the vertex. Calculate the x - coordinate.
            –b     ( – 5)     15
        x =     =           =
             2a
                  2 –3
                        2  ( ) 2

        Then find the y - coordinate of the vertex.
GUIDED PRACTICE       for Example 3


                 ( ) ( )
         y = – 3 15 – 5 15 + 2 = – 76
               2 2       2          2
                            15 – 76
        So, the vertex is      ,      . Plot this point.
                             2    2
                                      15
 STEP 3 Draw the axis of symmetry x =
                                       2

More Related Content

What's hot

April 10, 2015
April 10, 2015April 10, 2015
April 10, 2015
khyps13
 
Higher Maths 1.2.3 - Trigonometric Functions
Higher Maths 1.2.3 - Trigonometric FunctionsHigher Maths 1.2.3 - Trigonometric Functions
Higher Maths 1.2.3 - Trigonometric Functions
timschmitz
 
3 Forms Of A Quadratic Function
3 Forms Of A Quadratic Function3 Forms Of A Quadratic Function
3 Forms Of A Quadratic Function
guestc8e5bb
 
April 14, 2015
April 14, 2015April 14, 2015
April 14, 2015
khyps13
 
0101: Graphing Quadratic Functions
0101: Graphing Quadratic Functions0101: Graphing Quadratic Functions
0101: Graphing Quadratic Functions
kijo13
 
Graphing A Parabola
Graphing A ParabolaGraphing A Parabola
Graphing A Parabola
guest2fa158
 
Kadieng oll mod 3 blog posting
Kadieng   oll mod 3 blog postingKadieng   oll mod 3 blog posting
Kadieng oll mod 3 blog posting
gkadien
 
Exp&log graphs it worksheet
Exp&log graphs it worksheetExp&log graphs it worksheet
Exp&log graphs it worksheet
bryan
 
MODULE 5- Inequalities
MODULE 5- InequalitiesMODULE 5- Inequalities
MODULE 5- Inequalities
guestcc333c
 
Midterm Study Guide
Midterm Study GuideMidterm Study Guide
Midterm Study Guide
vhiggins1
 
Drawing trigonometric graphs.
Drawing trigonometric graphs.Drawing trigonometric graphs.
Drawing trigonometric graphs.
RoseBlakeney
 
P2 Graphs Function
P2  Graphs FunctionP2  Graphs Function
P2 Graphs Function
guestcc333c
 
Quadratic Function by Jasmine & Cristina
Quadratic Function by Jasmine & CristinaQuadratic Function by Jasmine & Cristina
Quadratic Function by Jasmine & Cristina
Hope Scott
 

What's hot (20)

April 10, 2015
April 10, 2015April 10, 2015
April 10, 2015
 
Higher Maths 1.2.3 - Trigonometric Functions
Higher Maths 1.2.3 - Trigonometric FunctionsHigher Maths 1.2.3 - Trigonometric Functions
Higher Maths 1.2.3 - Trigonometric Functions
 
3 Forms Of A Quadratic Function
3 Forms Of A Quadratic Function3 Forms Of A Quadratic Function
3 Forms Of A Quadratic Function
 
April 14, 2015
April 14, 2015April 14, 2015
April 14, 2015
 
0101: Graphing Quadratic Functions
0101: Graphing Quadratic Functions0101: Graphing Quadratic Functions
0101: Graphing Quadratic Functions
 
Graphing A Parabola
Graphing A ParabolaGraphing A Parabola
Graphing A Parabola
 
Kadieng oll mod 3 blog posting
Kadieng   oll mod 3 blog postingKadieng   oll mod 3 blog posting
Kadieng oll mod 3 blog posting
 
Exp&log graphs it worksheet
Exp&log graphs it worksheetExp&log graphs it worksheet
Exp&log graphs it worksheet
 
Kem akademik sept 16
Kem akademik  sept 16Kem akademik  sept 16
Kem akademik sept 16
 
Add Maths 2
Add Maths 2Add Maths 2
Add Maths 2
 
Teknik menjawab matematik tambahan 1
Teknik menjawab matematik tambahan 1Teknik menjawab matematik tambahan 1
Teknik menjawab matematik tambahan 1
 
Integration
IntegrationIntegration
Integration
 
MODULE 5- Inequalities
MODULE 5- InequalitiesMODULE 5- Inequalities
MODULE 5- Inequalities
 
Midterm Study Guide
Midterm Study GuideMidterm Study Guide
Midterm Study Guide
 
2.7 more parabolas a& hyperbolas (optional) t
2.7 more parabolas a& hyperbolas (optional) t2.7 more parabolas a& hyperbolas (optional) t
2.7 more parabolas a& hyperbolas (optional) t
 
Lista de derivadas e integrais
Lista de derivadas e integraisLista de derivadas e integrais
Lista de derivadas e integrais
 
Drawing trigonometric graphs.
Drawing trigonometric graphs.Drawing trigonometric graphs.
Drawing trigonometric graphs.
 
Lista de integrais Calculo IV
Lista de integrais Calculo IVLista de integrais Calculo IV
Lista de integrais Calculo IV
 
P2 Graphs Function
P2  Graphs FunctionP2  Graphs Function
P2 Graphs Function
 
Quadratic Function by Jasmine & Cristina
Quadratic Function by Jasmine & CristinaQuadratic Function by Jasmine & Cristina
Quadratic Function by Jasmine & Cristina
 

Similar to Classzone Chapter 4

C2 st lecture 2 handout
C2 st lecture 2 handoutC2 st lecture 2 handout
C2 st lecture 2 handout
fatima d
 
April 3, 2014
April 3, 2014April 3, 2014
April 3, 2014
khyps13
 
02.21.2020 Algebra I Quadraic Functions.ppt
02.21.2020  Algebra I Quadraic Functions.ppt02.21.2020  Algebra I Quadraic Functions.ppt
02.21.2020 Algebra I Quadraic Functions.ppt
jannelewlawas
 
5 indices & logarithms
5  indices & logarithms5  indices & logarithms
5 indices & logarithms
linusshy
 
Graphing Quadratics
Graphing QuadraticsGraphing Quadratics
Graphing Quadratics
swartzje
 
Graphing y = ax^2 + bx + c
Graphing  y = ax^2 + bx + cGraphing  y = ax^2 + bx + c
Graphing y = ax^2 + bx + c
DaisyListening
 
graphs of functions 2
 graphs of functions 2 graphs of functions 2
graphs of functions 2
larasati06
 
Quadratic Function Presentation
Quadratic Function PresentationQuadratic Function Presentation
Quadratic Function Presentation
RyanWatt
 

Similar to Classzone Chapter 4 (20)

10.2
10.210.2
10.2
 
C2 st lecture 2 handout
C2 st lecture 2 handoutC2 st lecture 2 handout
C2 st lecture 2 handout
 
April 3, 2014
April 3, 2014April 3, 2014
April 3, 2014
 
Quadratic equations
Quadratic equationsQuadratic equations
Quadratic equations
 
Quadratic equations
Quadratic equationsQuadratic equations
Quadratic equations
 
Mathematics 8 Linear Functions
Mathematics 8 Linear FunctionsMathematics 8 Linear Functions
Mathematics 8 Linear Functions
 
02.21.2020 Algebra I Quadraic Functions.ppt
02.21.2020  Algebra I Quadraic Functions.ppt02.21.2020  Algebra I Quadraic Functions.ppt
02.21.2020 Algebra I Quadraic Functions.ppt
 
Graphing quadratics
Graphing quadraticsGraphing quadratics
Graphing quadratics
 
5 indices & logarithms
5  indices & logarithms5  indices & logarithms
5 indices & logarithms
 
Graphing Quadratics
Graphing QuadraticsGraphing Quadratics
Graphing Quadratics
 
Module 3 quadratic functions
Module 3   quadratic functionsModule 3   quadratic functions
Module 3 quadratic functions
 
Add maths 2
Add maths 2Add maths 2
Add maths 2
 
Module 1 linear functions
Module 1   linear functionsModule 1   linear functions
Module 1 linear functions
 
Graphing y = ax^2 + bx + c
Graphing  y = ax^2 + bx + cGraphing  y = ax^2 + bx + c
Graphing y = ax^2 + bx + c
 
Função quadrática
Função quadráticaFunção quadrática
Função quadrática
 
graphs of functions 2
 graphs of functions 2 graphs of functions 2
graphs of functions 2
 
Kim Solving
Kim SolvingKim Solving
Kim Solving
 
Math 17 midterm exam review jamie
Math 17 midterm exam review jamieMath 17 midterm exam review jamie
Math 17 midterm exam review jamie
 
Sistem pertidaksamaan kuadrat 2 variabel
Sistem pertidaksamaan kuadrat 2 variabelSistem pertidaksamaan kuadrat 2 variabel
Sistem pertidaksamaan kuadrat 2 variabel
 
Quadratic Function Presentation
Quadratic Function PresentationQuadratic Function Presentation
Quadratic Function Presentation
 

Classzone Chapter 4

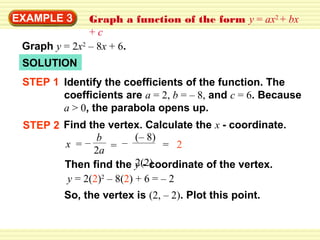
  • 1. EXAMPLE 3 Graph a function of the form y = ax2 + bx +c Graph y = 2x2 – 8x + 6. SOLUTION STEP 1 Identify the coefficients of the function. The coefficients are a = 2, b = – 8, and c = 6. Because a > 0, the parabola opens up. STEP 2 Find the vertex. Calculate the x - coordinate. b (– 8) x =– = – = 2 2a 2(2) Then find the y - coordinate of the vertex. y = 2(2)2 – 8(2) + 6 = – 2 So, the vertex is (2, – 2). Plot this point.
  • 2. EXAMPLE 3 Graph a function of the form y = ax2 + bx +c STEP 3 Draw the axis of symmetry x = 2. STEP 4 Identify the y - intercept c, which is 6. Plot the point (0, 6). Then reflect this point in the axis of symmetry to plot another point, (4, 6). STEP 5 Evaluate the function for another value of x, such as x = 1. y = 2(1)2 – 8(1) + 6 = 0 Plot the point (1, 0) and its reflection (3, 0) in the axis of symmetry.
  • 3. EXAMPLE 3 Graph a function of the form y = ax2 + bx +c STEP 6 Draw a parabola through the plotted points.
  • 4. GUIDED PRACTICE for Example 3 Graph the function. Label the vertex and axis of symmetry. 4. y = x2 – 2x – 1 SOLUTION STEP 1 Identify the coefficients of the function. The coefficients are a = 1, b = – 2, and c = – 1. Because a > 0, the parabola opens up. STEP 2 Find the vertex. Calculate the x - coordinate. b (– 2) x = – = 1 2a = 2(1) Then find the y - coordinate of the vertex. y = 12 – 2 1 + 1 = – 2
  • 5. GUIDED PRACTICE for Example 3 So, the vertex is (1, – 2). Plot this point. STEP 3 Draw the axis of symmetry x = 1.
  • 6. GUIDED PRACTICE for Example 3 5. y = 2x2 + 6x + 3 SOLUTION STEP 1 Identify the coefficients of the function. The coefficients are a = 2, b = 6, and c = 3. Because a > 0, the parabola opens up. STEP 2 Find the vertex. Calculate the x - coordinate. –b –6 –3 x = = = 2a 2 2 2 Then find the y - coordinate of the vertex. y=2 ( ) –3 2 +6 ( ) –3 2 + 3 =–9 –3 So, the vertex is , – 9. Plot this point. 2
  • 7. GUIDED PRACTICE for Example 3 –3 STEP 3 Draw the axis of symmetry x = 2
  • 8. GUIDED PRACTICE for Example 3 1 2 6. f (x) = – x – 5x + 2 3 SOLUTION STEP 1 Identify the coefficients of the function. The 1 coefficients are a = – , b = – 5, and c = 2 . 3 Because a > 0, the parabola opens up. STEP 2 Find the vertex. Calculate the x - coordinate. –b ( – 5) 15 x = = = 2a 2 –3 2 ( ) 2 Then find the y - coordinate of the vertex.
  • 9. GUIDED PRACTICE for Example 3 ( ) ( ) y = – 3 15 – 5 15 + 2 = – 76 2 2 2 2 15 – 76 So, the vertex is , . Plot this point. 2 2 15 STEP 3 Draw the axis of symmetry x = 2
  • 10. GUIDED PRACTICE for Example 3 ( ) ( ) y = – 3 15 – 5 15 + 2 = – 76 2 2 2 2 15 – 76 So, the vertex is , . Plot this point. 2 2 15 STEP 3 Draw the axis of symmetry x = 2