Model Call Girl in Tilak Nagar Delhi reach out to us at 🔝9953056974🔝
Ftir intro
1. FOURIER-TRANSFORM INFRARED SPECTROSCOPY
INTRODUCTION
Infrared spectroscopy is a powerful analytical tool to reveal the functional groups
in a molecule. More specifically, it provides information about the nature of the
bonds in the analyzed sample.
Chemical bonds absorb electromagnetic waves at certain energy levels and convert
them into rotational or vibrational kinetic energy form or electronic excitation
takes place depending upon the energy absorbed. The ratio of energy required for
these transitions is 1: 100: 10000 respectively. IR radiation is capable of producing
rotational and vibrational changes only.
The bond can be differentiated by that absorbed radiation since different bonds
absorb waves at different frequencies. In infrared spectroscopy, as the name
implies, incident light is sent to the sample at frequencies within the infrared
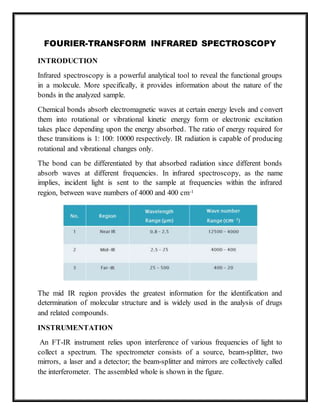
region, between wave numbers of 4000 and 400 cm-1
The mid IR region provides the greatest information for the identification and
determination of molecular structure and is widely used in the analysis of drugs
and related compounds.
INSTRUMENTATION
An FT-IR instrument relies upon interference of various frequencies of light to
collect a spectrum. The spectrometer consists of a source, beam-splitter, two
mirrors, a laser and a detector; the beam-splitter and mirrors are collectively called
the interferometer. The assembled whole is shown in the figure.
2. The IR light from the source strikes the beam-splitter, which produces two beams
of roughly the same intensity. One beam strikes a fixed mirror and returns, while
the second strikes a moving mirror. A laser parallels the IR light, and also goes
through the interferometer. The moving mirror oscillates at a constant velocity,
timed using the laser frequency. The two beams are reflected from the mirrors and
are recombined at the beam-splitter. If the distance the two beams travel is the
same, then they will recombine constructively. However, if the beam from the
moving mirror has travelled a different distance (further or shorter) than the beam
from the fixed mirror, then recombination will result in some destructive
interference. The movement of the mirror thus generates an interference pattern
during the motion. The IR beam next passes through the sample, where some
energy is absorbed and some is transmitted. The transmitted portion reaches the
detector, which records the total intensity. The raw detector response yields an
interferogram. The interference pattern contains information about all wavelengths
being transmitted at once, which is a function of the source, beam-splitter, mirrors
and sample. This signal is digitized and processed using a computer.
The untangling of the frequencies into a spectrum is done by the Fourier transform
algorithm, which gives the name to the entire spectrometer. This produces a
3. “single beam” spectrum. A reference or “background” single beam is collected
without a sample; the sample single beam is collected with the only change being
the presence of the sample. The ratio of these two leads to the spectrum.
Sources:
FTIR spectrometers use a Globar or Nernst source for the mid-infrared
region.
If the far-infrared region is to be examined, then a high-pressure mercury
lamp can be used.
For the near-infrared, tungsten–halogen lamps are used as sources.
Detectors:
There are two commonly used detectors employed for the mid-infrared region.
The normal detector for routine use is a pyroelectric device incorporating
deuterium tryglycine sulfate (DTGS) in a temperature-resistant alkali halide
window.
For more sensitive work, mercury cadmium telluride (MCT) can be used.
In the far-infrared region, germanium or indium–antimony detectors are employed.
For the near-infrared region, the detectors used are generally lead sulfide
photoconductors.
IR SPECTRUM:
IR spectrum is the plot of Transmittance or Absorbance as a function of
wavenumber.
4. The location of peaks in the spectrum provides information for the presenceof
certain functional groups and bonds in the structure.
The region to the right-hand side of the diagram (from about 1650 to 500 cm-1). It
usually contains a very complicated series of absorptions. The region contains
peaks due to bending vibrations. It is rarely possible to assign a specific peak to a
specific group.
The computing device compares the obtained spectrum with the standard spectraof
thousands of compounds saved in its library and provides the match results. Thus,
making the identification easier.
APPLICATIONS OF FTIR SPECTROSCOPY IN PHARMACEUTICALS
Pharmaceutical laboratories face strong regulatory requirements and market
pressures at every step along the product development pipeline. FTIR is an
excellent technique for pharmaceutical analysis because it is easy to use, sensitive,
fast, and helps ensure regulatory compliance through validation protocols.
Applications include:
Basic drug research and structural elucidation
Formulation development and validation
Quality control processes for incoming and outgoing materials
Packaging testing