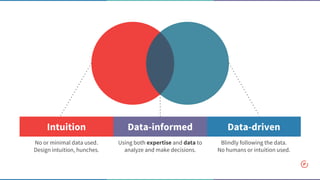
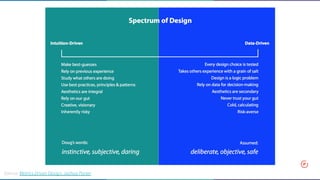
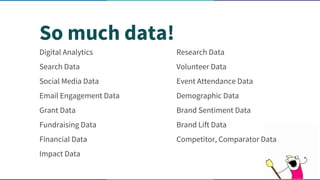
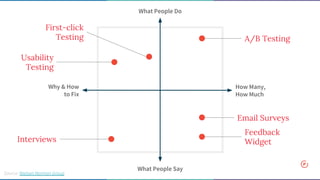
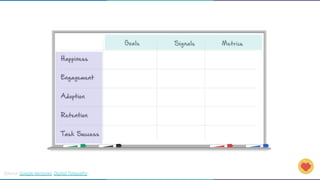
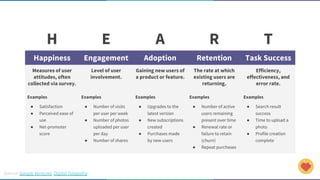
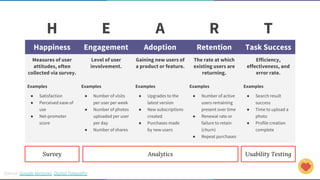
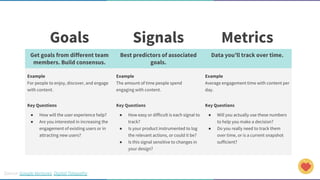
May 23, 2018
Good Tech Fest
DATA
INFORMED
DESIGN
Pied Piper Design Concept
from Silicon Valley (HBO)
I have no idea what
you’re going to want.
Source: HBO's Silicon Valley, Pied Piper Design Concept
Who are you?
1
Courtney Clark
Managing Director of User Experience
@circlish
https://www.linkedin.com/in/clarkcourtney/
What is the difference between
data-informed and data-driven?
2
Intuition Data-informed Data-driven
No or minimal data used.
Design intuition, hunches.
Using both expertise and data to
analyze and make decisions.
Blindly following the data.
No humans or intuition used.
Source: Metrics Driven Design, Joshua Porter
Why data-informed design?
3
Discover Improve
Justify Tell Better Stories
Support discussion.
Justify decisions.
Support marketing.
Support your cause.
Uncover new information.
Discover possibilities.
Optimize. Increase conversions.
Measure before / after.
Grow Skill
Communicate with analysts.
Improve your portfolio.
Be Strategic
Confirm you’re headed in the
right direction.
Create the Best Possible Product
Achieving business goals. Supporting primary audience.
You Probably Have Some Data
Use it!
What data can I use to
inform my design?
4
Da·ta (ˈdadə,ˈdādə/) n. facts and
statistics collected together for
reference and analysis
Digital Analytics
Search Data
Social Media Data
Email Engagement Data
Grant Data
Fundraising Data
Financial Data
Impact Data
Research Data
Volunteer Data
Event Attendance Data
Demographic Data
Brand Sentiment Data
Brand Lift Data
Competitor, Comparator Data
So much data!
What People Do
What People Say
Why & How
to Fix
How Many,
How Much
First-click
Testing
Interviews
Usability
Testing
Source: Nielsen Norman Group
A/B Testing
Feedback
Widget
Email Surveys
HEART Framework
Source: Google Ventures
Happiness, Engagement, Adoption, Retention, Task Success
Source: Google Ventures, Digital Telepathy
H E A R T
Happiness Engagement Adoption Retention Task Success
Measures of user
attitudes, often
collected via survey.
Level of user
involvement.
Gaining new users of
a product or feature.
The rate at which
existing users are
returning.
Efficiency,
effectiveness, and
error rate.
Examples
● Satisfaction
● Perceived ease of
use
● Net-promoter
score
Examples
● Number of visits
per user per week
● Number of photos
uploaded per user
per day
● Number of shares
Examples
● Upgrades to the
latest version
● New subscriptions
created
● Purchases made
by new users
Examples
● Number of active
users remaining
present over time
● Renewal rate or
failure to retain
(churn)
● Repeat purchases
Examples
● Search result
success
● Time to upload a
photo
● Profile creation
complete
Survey Analytics Usability Testing
Source: Google Ventures, Digital Telepathy
Goals Signals Metrics
Get goals from different team
members. Build consensus.
Best predictors of associated
goals.
Data you’ll track over time.
Example
For people to enjoy, discover, and engage
with content.
Example
The amount of time people spend
engaging with content.
Example
Average engagement time with content per
day.
Key Questions
● How will the user experience help?
● Are you interested in increasing the
engagement of existing users or in
attracting new users?
Key Questions
● How easy or difficult is each signal to
track?
● Is your product instrumented to log
the relevant actions, or could it be?
● Is this signal sensitive to changes in
your design?
Key Questions
● Will you actually use these numbers
to help you make a decision?
● Do you really need to track them
over time, or is a current snapshot
sufficient?
Source: Google Ventures, Digital Telepathy
You only need to use
categories or data
relevant to your product.
How to build a data-informed
approach?
5
1. Set up a meeting with your business analyst,
analytics team, data person
2. Inventory the data you have on your project now
3. Fill out the HEART worksheet
4. Design!
5. Iterate, test, improve
6. Reflect and debrief with your team
Get Started
Ask yourself:
What data do we have to support this?
How will we get data to validate this?
What does data-informed design
look like in the wild?
6
Quantitative data tells
you what is happening.
Qualitative data tells you
why it’s happening.
Usability Testing
“But I want to know
more about the work, so
I’m going to click on
‘Our Work.’ Oh! I can’t
do that for some
reason.”
“The very first link is ‘Our Work,’ so
I believe I would just click on that. It
doesn’t seem to be an accessible
feature or maybe I’m already on that
page… oh, it’s just not an accessible
feature at this point.”
A/B Testing
Search Analytics
Search Analytics Question Why ask?
Search + Time on Site
How much time are users spending on the site after
they've conducted a search?
If users are spending a significant amount of time on the site after a search, and
the average search depth is high, it suggests users are finding value in search
and combing through the site to learn more, especially when a site is content rich
the way this site is. It is also an indicator that the user is well engaged.
Top Terms
What are the top search terms?
This will help us understand the type of content people are looking for and can
help inform content hierarchy.
Top Terms + Exits
What are the top terms that have high percentages of
search exits and search refinements?
This may indicate that the content users are searching for doesn't exist.
Channels + Search
Which traffic channel segments drive the most internal
searches?
If they are using the search to refine, it could mean that they didn’t find the site
from the right landing page.
Pages + Search
What pages do users start their searches on the most?
And, what search terms do they use on those pages?
From there we can look at those pages and determine how those pages are
structured, and if the information they were looking for is obvious and easy to
find on that page.
Search + Page Depth
What is the average search depth (the average # of pages
people viewed after running a search)?
An average search depth higher than 2 usually means people don’t find what
they want from the first search.
What challenges will I face with
data-informed design?
7
Data Availability & Skills
GOOD BAD UGLY
90% of nonprofits are
collecting data
49% don’t know ways
their org is collecting
13% never or rarely use
data.
Source: Everyaction • 2016 • The State of Nonprofit Data white paper
Not collecting enough data 36%
Source: Everyaction • 2016 • The State of Nonprofit Data white paper
Lack of tools to help analyze data
Data isn’t kept in one place
Don’t have enough experience using data
Not enough time, or personnel to focus on data
42%
46%
55%
79%
Over-indexing on Data-driven
I had a recent debate
over whether a border
should be 3, 4 or 5
pixels wide, and was
asked to prove my case.
Source: Goodbye Google, Douglas Bowman
Source: Metrics Driven Design, Joshua Porter
Wait, why should I care about this?
8
How Designers are Building Careers in Silicon Valley
from KPCB
To achieve great
design, you need great
business thinking /
doing…
Source: How Designers are Building Careers in Silicon Valley
To achieve great
design, you need great
business thinking /
doing…
Yay data-informed design!
Now what?
9
Keep Reading
Data Informed Design, Not Data-Driven
How to Choose the Right UX Metrics
The Agony and Ecstasy of Building with Data
Data-informed Design (5 Things I Learned the Hard Way)
Data-driven vs Data-informed Design in Enterprise Products
Questions
& Answers

Data Informed Design - Good Tech Test - May 2018

  • 1.
    May 23, 2018 GoodTech Fest DATA INFORMED DESIGN
  • 2.
    Pied Piper DesignConcept from Silicon Valley (HBO)
  • 3.
    I have noidea what you’re going to want. Source: HBO's Silicon Valley, Pied Piper Design Concept
  • 4.
  • 5.
    Courtney Clark Managing Directorof User Experience @circlish https://www.linkedin.com/in/clarkcourtney/
  • 8.
    What is thedifference between data-informed and data-driven? 2
  • 9.
    Intuition Data-informed Data-driven Noor minimal data used. Design intuition, hunches. Using both expertise and data to analyze and make decisions. Blindly following the data. No humans or intuition used.
  • 10.
    Source: Metrics DrivenDesign, Joshua Porter
  • 11.
    Source: Metrics DrivenDesign, Joshua Porter
  • 12.
  • 13.
    Discover Improve Justify TellBetter Stories Support discussion. Justify decisions. Support marketing. Support your cause. Uncover new information. Discover possibilities. Optimize. Increase conversions. Measure before / after. Grow Skill Communicate with analysts. Improve your portfolio. Be Strategic Confirm you’re headed in the right direction.
  • 14.
    Create the BestPossible Product Achieving business goals. Supporting primary audience.
  • 15.
    You Probably HaveSome Data Use it!
  • 16.
    What data canI use to inform my design? 4
  • 17.
    Da·ta (ˈdadə,ˈdādə/) n.facts and statistics collected together for reference and analysis
  • 18.
    Digital Analytics Search Data SocialMedia Data Email Engagement Data Grant Data Fundraising Data Financial Data Impact Data Research Data Volunteer Data Event Attendance Data Demographic Data Brand Sentiment Data Brand Lift Data Competitor, Comparator Data So much data!
  • 19.
    What People Do WhatPeople Say Why & How to Fix How Many, How Much First-click Testing Interviews Usability Testing Source: Nielsen Norman Group A/B Testing Feedback Widget Email Surveys
  • 20.
    HEART Framework Source: GoogleVentures Happiness, Engagement, Adoption, Retention, Task Success
  • 21.
    Source: Google Ventures,Digital Telepathy
  • 22.
    Source: Google Ventures,Digital Telepathy H E A R T Happiness Engagement Adoption Retention Task Success Measures of user attitudes, often collected via survey. Level of user involvement. Gaining new users of a product or feature. The rate at which existing users are returning. Efficiency, effectiveness, and error rate. Examples ● Satisfaction ● Perceived ease of use ● Net-promoter score Examples ● Number of visits per user per week ● Number of photos uploaded per user per day ● Number of shares Examples ● Upgrades to the latest version ● New subscriptions created ● Purchases made by new users Examples ● Number of active users remaining present over time ● Renewal rate or failure to retain (churn) ● Repeat purchases Examples ● Search result success ● Time to upload a photo ● Profile creation complete
  • 23.
    Source: Google Ventures,Digital Telepathy H E A R T Happiness Engagement Adoption Retention Task Success Measures of user attitudes, often collected via survey. Level of user involvement. Gaining new users of a product or feature. The rate at which existing users are returning. Efficiency, effectiveness, and error rate. Examples ● Satisfaction ● Perceived ease of use ● Net-promoter score Examples ● Number of visits per user per week ● Number of photos uploaded per user per day ● Number of shares Examples ● Upgrades to the latest version ● New subscriptions created ● Purchases made by new users Examples ● Number of active users remaining present over time ● Renewal rate or failure to retain (churn) ● Repeat purchases Examples ● Search result success ● Time to upload a photo ● Profile creation complete Survey Analytics Usability Testing
  • 24.
    Source: Google Ventures,Digital Telepathy Goals Signals Metrics Get goals from different team members. Build consensus. Best predictors of associated goals. Data you’ll track over time. Example For people to enjoy, discover, and engage with content. Example The amount of time people spend engaging with content. Example Average engagement time with content per day. Key Questions ● How will the user experience help? ● Are you interested in increasing the engagement of existing users or in attracting new users? Key Questions ● How easy or difficult is each signal to track? ● Is your product instrumented to log the relevant actions, or could it be? ● Is this signal sensitive to changes in your design? Key Questions ● Will you actually use these numbers to help you make a decision? ● Do you really need to track them over time, or is a current snapshot sufficient?
  • 25.
    Source: Google Ventures,Digital Telepathy
  • 26.
    You only needto use categories or data relevant to your product.
  • 27.
    How to builda data-informed approach? 5
  • 28.
    1. Set upa meeting with your business analyst, analytics team, data person 2. Inventory the data you have on your project now 3. Fill out the HEART worksheet 4. Design! 5. Iterate, test, improve 6. Reflect and debrief with your team Get Started
  • 29.
    Ask yourself: What datado we have to support this? How will we get data to validate this?
  • 30.
    What does data-informeddesign look like in the wild? 6
  • 31.
    Quantitative data tells youwhat is happening. Qualitative data tells you why it’s happening.
  • 32.
  • 33.
    “But I wantto know more about the work, so I’m going to click on ‘Our Work.’ Oh! I can’t do that for some reason.” “The very first link is ‘Our Work,’ so I believe I would just click on that. It doesn’t seem to be an accessible feature or maybe I’m already on that page… oh, it’s just not an accessible feature at this point.”
  • 34.
  • 37.
  • 38.
    Search Analytics QuestionWhy ask? Search + Time on Site How much time are users spending on the site after they've conducted a search? If users are spending a significant amount of time on the site after a search, and the average search depth is high, it suggests users are finding value in search and combing through the site to learn more, especially when a site is content rich the way this site is. It is also an indicator that the user is well engaged. Top Terms What are the top search terms? This will help us understand the type of content people are looking for and can help inform content hierarchy. Top Terms + Exits What are the top terms that have high percentages of search exits and search refinements? This may indicate that the content users are searching for doesn't exist. Channels + Search Which traffic channel segments drive the most internal searches? If they are using the search to refine, it could mean that they didn’t find the site from the right landing page. Pages + Search What pages do users start their searches on the most? And, what search terms do they use on those pages? From there we can look at those pages and determine how those pages are structured, and if the information they were looking for is obvious and easy to find on that page. Search + Page Depth What is the average search depth (the average # of pages people viewed after running a search)? An average search depth higher than 2 usually means people don’t find what they want from the first search.
  • 39.
    What challenges willI face with data-informed design? 7
  • 40.
  • 41.
    GOOD BAD UGLY 90%of nonprofits are collecting data 49% don’t know ways their org is collecting 13% never or rarely use data. Source: Everyaction • 2016 • The State of Nonprofit Data white paper
  • 42.
    Not collecting enoughdata 36% Source: Everyaction • 2016 • The State of Nonprofit Data white paper Lack of tools to help analyze data Data isn’t kept in one place Don’t have enough experience using data Not enough time, or personnel to focus on data 42% 46% 55% 79%
  • 43.
  • 44.
    I had arecent debate over whether a border should be 3, 4 or 5 pixels wide, and was asked to prove my case. Source: Goodbye Google, Douglas Bowman
  • 45.
    Source: Metrics DrivenDesign, Joshua Porter
  • 46.
    Wait, why shouldI care about this? 8
  • 47.
    How Designers areBuilding Careers in Silicon Valley from KPCB
  • 48.
    To achieve great design,you need great business thinking / doing… Source: How Designers are Building Careers in Silicon Valley
  • 49.
    To achieve great design,you need great business thinking / doing… Yay data-informed design!
  • 50.
  • 52.
    Keep Reading Data InformedDesign, Not Data-Driven How to Choose the Right UX Metrics The Agony and Ecstasy of Building with Data Data-informed Design (5 Things I Learned the Hard Way) Data-driven vs Data-informed Design in Enterprise Products
  • 53.