1. 2015 Mid-Year
Orange County, CA | Office
Integra Realty Resources - Orange County
Steve Calandra, MAI
Senior Managing Director
24411 Ridge Route Drive, Suite 100
Laguna Hills, CA 92653
Phone: 949-709-7200 x237
scalandra@irr.com
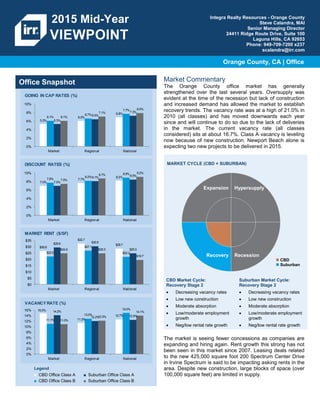
Office Snapshot Market Commentary
The Orange County office market has generally
strengthened over the last several years. Oversupply was
evident at the time of the recession but lack of construction
and increased demand has allowed the market to establish
recovery trends. The vacancy rate was at a high of 21.0% in
2010 (all classes) and has moved downwards each year
since and will continue to do so due to the lack of deliveries
in the market. The current vacancy rate (all classes
considered) sits at about 16.7%. Class A vacancy is leveling
now because of new construction. Newport Beach alone is
expecting two new projects to be delivered in 2015.
MARKET CYCLE (CBD + SUBURBAN)
CBD Market Cycle:
Recovery Stage 2
Decreasing vacancy rates
Low new construction
Moderate absorption
Low/moderate employment
growth
Neg/low rental rate growth
Suburban Market Cycle:
Recovery Stage 2
Decreasing vacancy rates
Low new construction
Moderate absorption
Low/moderate employment
growth
Neg/low rental rate growth
The market is seeing fewer concessions as companies are
expanding and hiring again. Rent growth this strong has not
been seen in this market since 2007. Leasing deals related
to the new 425,000 square foot 200 Spectrum Center Drive
in Irvine Spectrum is said to be impacting asking rents in the
area. Despite new construction, large blocks of space (over
100,000 square feet) are limited in supply.
Legend
■ CBD Office Class A ■ Suburban Office Class A
■ CBD Office Class B ■ Suburban Office Class B
Expansion Hypersupply
Recovery Recession
CBD
Suburban
5.3%
6.0%
6.9%
6.1%
6.7%
7.7%
5.3%
6.5%
7.3%
6.1%
7.1%
8.0%
0%
2%
4%
6%
8%
10%
Market Regional National
GOING IN CAP RATES (%)
7.0%
7.7%
8.2%
7.8%
8.2%
8.9%
7.0%
8.1%
8.5%
7.5%
8.7%
9.2%
0%
2%
4%
6%
8%
10%
Market Regional National
DISCOUNT RATES (%)
$26.8
$32.7
$28.7
$22.5
$27.1
$22.2
$29.6 $30.6
$25.0$24.9 $25.0
$19.7
$0
$5
$10
$15
$20
$25
$30
$35
Market Regional National
MARKET RENT ($/SF)
15.0%
11.3%
12.7%
11.1%
13.0%
15.0%
14.2%
12.2% 12.5%
11.0%
12.3%
14.1%
0%
2%
4%
6%
8%
10%
12%
14%
16%
Market Regional National
VACANCY RATE (%)
2. 2015 Mid-Year
Orange County, CA | Office
Integra Realty Resources - Orange County
Steve Calandra, MAI
Senior Managing Director
24411 Ridge Route Drive, Suite 100
Laguna Hills, CA 92653
Phone: 949-709-7200 x237
scalandra@irr.com
About IRR
Integra Realty Resources (IRR) is the largest independent commercial
real estate valuation and consulting firm in North America, with over 200
MAI-designated members of the of the Appraisal Institute among over 900
professionals based in our 66 offices throughout the United States and
the Caribbean. Founded in 1999, the firm specializes in real estate
appraisals, feasibility and market studies, expert testimony, and related
property consulting services across all local and national markets. Our
valuation and counseling services span all commercial property types and
locations, from individual properties to large portfolio assignments. For
more information, visit www.irr.com or blog.irr.com.
Disclaimer
While the great majority of data and content contained herein is proprietary to IRR, this publication includes data provided by
third parties, and while the available data is presumed to be accurate, no representation or warranty is made regarding the
accuracy of the information contained in this publication. This publication does not render legal, accounting, appraisal,
counseling, investment or other professional advice. Should such services or other expert assistance be needed, it is
recommended that the services of a competent person or firm, having access to the details of the situation, be employed.
ORANGECOUNTY 12 MONTH FORECASTS
Categories CBD Office Class A CBD Office Class B Suburban Office Class A Suburban Office Class B
Going In Cap Rate Remain Steady - no change Remain Steady - no change Remain Steady - no change Remain Steady - no change
Discount Rate Remain Steady - no change Remain Steady - no change Remain Steady - no change Remain Steady - no change
Market Rent Change (%) 1.10% 0.30% 1.70% 0.90%
Expense Change (%) 3.00% 3.00% 3.00% 3.00%
Absorption (SF) 177,933 177,933 355,867 355,867
Construction (SF)
Tenant Improvement ($/SF) $25 $15 $25 $15
Years to Balance 3 1 3 1
AVERAGEANNUAL CHANGEIN VALUE
Time CBD Office Class A CBD Office Class B Suburban Office Class A Suburban Office Class B
Previous 36 Months Increase 2% - 3.9% Increase 2% - 3.9% Increase 2% - 3.9% Increase 2% - 3.9%
Previous 12 Months Increase .1% - 1.9% Increase .1% - 1.9% Increase .1% - 1.9% Increase .1% - 1.9%
Future 12 Months Increase 4%+ Increase 2% - 3.9% Increase 4%+ Increase 2% - 3.9%
Future 36 Months Increase 4%+ Increase 4%+ Increase 4%+ Increase 4%+
89,388 89,871
TOP SEVEN CAP RATEFACTORS
National economic conditions/GDP growth
Local economy, job growth, unemployment
Property income growth
Risk premium of private real estate
Supply/demand
Availability of financing
Interest rates