1. Modelling of igneous geochemical data
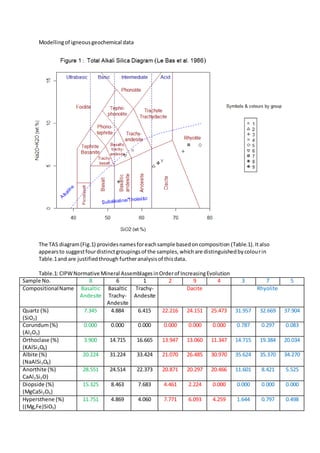
The TAS diagram (Fig.1) provides names for each sample based on composition (Table.1). It also
appears to suggest four distinct groupings of the samples, which are distinguished by colou r in
Table.1 and are justified through further analysis of this data.
Table.1: CIPW Normative Mineral Assemblages in Order of Increasing Evolution
Sample No.
8
6
1
2
9
4
Compositional Name Basaltic Basaltic TrachyDacite
Andesite Trachy- Andesite
Andesite
Quartz (%)
7.345
4.884
6.415
22.216 24.151 25.473
(SiO2)
Corundum (%)
0.000
0.000
0.000
0.000
0.000
0.000
(Al 2O3 )
Orthoclase (%)
3.900
14.715
16.665
13.947 13.060 11.347
(KAlSi 3O8)
Albite (%)
20.224
31.224
33.424
21.070 26.485 30.970
(NaAlSi 3O8 )
Anorthite (%)
28.551
24.514
22.373
20.871 20.297 20.466
CaAl 2Si 2O)
Diopside (%)
15.325
8.463
7.683
4.461
2.224
0.000
(MgCaSi 2O6)
Hypersthene (%)
11.751
4.869
4.060
7.771
6.093
4.259
((Mg,Fe)SiO3)
3
7
Rhyolite
5
31.957
32.669
37.904
0.787
0.297
0.083
14.715
19.384
20.034
35.624
35.370
34.270
11.601
8.421
5.525
0.000
0.000
0.000
1.644
0.797
0.498
2. Ilmentite (%)
(FeTiO3)
Sphene/Titanite (%)
(CaTiSiO5)
Rutile (%)
(TiO2)
Apatite (%)
(Ca5(PO4) 3 (F,Cl,OH))
Sum (%)
0.364
0.364
0.321
0.321
0.278
0.235
0.193
0.107
0.107
1.298
1.936
1.500
1.328
1.555
0.524
0.000
0.000
0.000
0.000
0.000
0.000
0.000
0.000
0.503
0.309
0.204
0.134
0.189
0.924
0.687
0.284
0.284
0.261
0.237
0.095
0.047
88.947
91.893
93.128
92.269
94.428
94.038
97.067
97.343
98.602
Major Element Data (Fig.2)
Many of the trends and anomalies seen in the Harker Plots for the Major elements (Fig.x) can be
related to the normative mineral composition of each sample – as defined by the Cross, Iddings,
Pirsson and Washington rules (Table.1).
Figure.2: Major Harker Plots
3. TiO2 Harker:
TiO2 increase between samples 8 and 6 is due to an increase in Sphene, which then decreases in
sample 1. Sample 4 shows the first formation of Rutile. The trend between samples 3, 7 and 5 is
caused by decreasing Rutile and Ilmentite.
Al 2O3 Harker:
The jump in Al 2O3 from samples 8 to 6 reflects the increase in Albite and Orthoclase, which continues
to trend upwards to sample 1. Samples 2, 9 and 4 also show a trend of increasing Albite to account
for increased aluminium. Samples 3, 7 and 5 show a trend of decreasing Corundum, Anorthite and
Albite.
FeOt Harker:
The continuous downward trend in iron content, from the least evolved to most the evolved sample,
is in agreement with a general decrease in Ilmentite and Hypersthene content.
MgO Harker:
This plot suggests that the Hypersthene of sample 2 is more magnesium rich as there is an increase
of MgO compared with sample 1. Sample 9 also appears to be magnesium rich Hypersthene. The
large drop in MgO between samples 8 and 6 is matched by a noticeable reduction in Diopside and
Hypersthene crystallisation.
CaO Harker:
Although there are estimated to be up to four minerals that contain calcium in any one sample –
Anorthite, Diopside, Sphene and Apatite – their proportions allow for a trend of steadily decreasing
calcium content from the least evolved to the most evolved sample.
Na2 O Harker:
An increased the proportion of Albite to Anorthite in a sample directly translates to increased Na 2O
content. The Na2 O plot highlights clear compositional trend differences between the intermediate
Basaltic Andesite (8) and Trachy-Andesites (6, 1) as well as between the acidic Dacites (2, 9, 4) and
Rhyolites (3, 7, 5).
K2O Harker:
This plot tracks the Orthoclase content of a sample since it is the only mineral to accept potassium
into its lattice. The Dacites have a trend of decreasing K 2 O content, whereas the Rhyolites have a
trend of increasing K 2 O with increasing evolution. A large gap between the potassium content of
sample 8 and samples 6 and 1 can be seen.
P2O5 Harker:
Apatite appears to be the alone mineral that controls this plot. There is a substantial jump in apatite
crystallisation from sample 8 to sample 6 but a decrease from 6 to sample 1. The Dacties show a
relatively flat, constant apatite content. The Rhyolites trend towards the lowest P 2 O5 content.
4. Trace Element Data (Fig.3)
Figure.3: Trace Harker Plots
Rb Harker:
Rb is an incompatible element that can replace K in Orthoclase, which noticeably occurs in samples 6
and 1. The concentration of Rb is diluted between samples 1 and 2 then steadily climbs through the
more evolved samples.
Sr Harker:
Sr readily replaces calcium in Anorthite. Enrichment of Sr in Anorthite of samples 6 and 2 is apparent
but then there is a reduction in Sr concentration between samples 2 and 1, followed by a downward
trend for the acidic samples.
Y Harker:
Variations in the Y content of all samples could be attributed to fluctuations in the proportions of
Sphene and Apatite, which both uptake the usually strongly incompatible Y.
5. Zr Harker:
Highly incompatible and does not substitute in common silica minerals. Replacement of Ti in a
combination of Sphene and Rutile maintains Zr content through the Dacites. Zr saturated magma
caused the Rutile in the Rhyolites to be more Zr-rich.
Ba Harker:
Ba is incompatible in most minerals but it will be uptaken by Orthoclase. Ba content increases
greatly in samples 6 and 1 due to a spike in Orthoclase crystallisation. However, the Ba content
greatly decreases for sample 2 suggesting that the magmatic system has been opened in some way.
Cr and Ni Hackers:
Both follow essentially the same trend: being extremely concentrated in sample 8 and depleted in all
other samples. This is explained by Cr and Ni being compatible in Hypersthene.
Bi-variant Trace Element Plot Analysis
Figure.4: Bi-variant Trace Plots
Zr and Nb are both highly incompatible elements and therefore if their ratio remains approximately
the same between samples it can be suggested that fractionation is the main source of
compositional evolution, not magma mixing (Murphy 2007). Sample 6 appears to have evolved 1 by
fractionation. Considering sample 3 to be a quirk of Zr saturation, the Dacites evolved the Rhyolites
by fractionation (Fig.4).
6. Analysis of Spider Plots
Figure.5:
Figure 5 compares the composition of the samples against a primitive mantle source for trace and
rare earth elements. The high field strength elements Nb, P and Ti are notably depleted in many of
the samples and this is indicative of a subduction related magmatic arc (Gill, 2010). Nb is depleted in
all samples because it is insoluble in melt produced by subduction (Gill, 2010). P is concentrated in
samples 6 and 1 because they are Apatite-rich. Ti depletion is most noticeable in the Rhyolite
magmas because they contain lesser amounts of Ti accepting minerals (Table. 1).
Figure.6:
7. All samples show moderate enrichment in the lighter REEs and a flat trend for heavier REEs (Fig.6),
both of which Murphy (2007) notes as being characteristics of a depleted, upper mantle source. It
also appears that figure 6 can be interpreted as showing magmas generated by partial melting of
two different depths of the upper mantle. The first is partial melting of a spinel lherzolite mantle at
<50km depth that had already undergone partial melting (Murphy 2007). This explains why sample 8
is more depleted in all REEs relative to the other samples, since the incompatible REEs had already
been depleted by the first melt(s) of the spinel lherzolite mantle. The second magma, and source for
all other samples, was generated by partial melting of mantle at a depth of <40km. This explains why
all other samples are relatively more enriched in REEs because of accumulation of incompatible-rich
melts from the deeper shallow mantle (e.g. 50km) that pool at the crust-mantle boundary where the
second magma was generated. The most convincing argument for the <40km origin of the second
magma is the Eu deficiency because Eu can be incorporated in plagioclase instead of calcium. At
<40km, plagioclase enriched in Eu could be left as residuum in the mantle and thus, the source
magma for all but sample 8 is depleted in Eu.
Stable and Radiogenic Isotope Analysis
Figure.7: Isotope Harker Plots
8. Sample 8 has initial Sr below present day Basaltic Achondritic Best Intial (BABI) (0.7040) and initial
Nd above present day Chondritic Uniform Reservoir (CHUR) (upper value, 0.512638), both of which
require it to have a depleted mantle source (Fig.7 and 8). Samples 6 and 1 have an initial Nd that
justifies a depleted mantle source; however, their initial Sr ratios are both above present day BABI
and therefore they must be partially contaminated by crustal melt. All stable and radiogenic isotope
plots show a sizable gap between sample 1 and the Dacites and Rhyolites. This can only be
accounted for by crustal contamination.
Figure.8: Bi-variant Isotope Plots
Estimating Percentage of Crustal Contamination
Applying the Lever Rule to isotope data from samples 1 and 2, combined wi th values for the local
crust, it is possible to estimate a percentage of crustal contamination required to turn the
composition of sample 1 into that of sample 2.
Sample 1 + %crust = Sample 2
%crust = [(sample 2)-(sample 1)] / [(crust)-(sample 1)]
Calculation with ( 87Sr/86Sr) i data:
[0.70538-0.70470]/[0.71030-0.70470]
= [0.00060]/[0.00560]
= 0.107
= 10.7%
Therefore,
From ( 87 Sr/86 Sr) i: Sample 1 + 10.7% local crust = Sample 2
9. The same procedure can be applied to the ( 143Nd/144 Nd)i and δ18O data with the following results.
From δ18 O: Sample 1 + 12.9% local crust = Sample 2
From ( 143 Nd/144Nd)i: Sample 1 + 59.5% local crust = Sample 2
While the ( 87 Sr/86 Sr) i and δ18O estimates are in plausible agreement, the ( 143 Nd/144Nd)i estimate
disagrees with both significantly. This indicates that there are discrepancies in the isotope data. The
reasons for this are unclear and contested in literature.
Petrogenetic Model
Mount Mary is a continental subduction arc volcano in the Andes of South America.
Subduction fluids caused remelting of depleted spinel lherzolite <50km deep in the mantle.
Basaltic Andesite, erupted to form the main cone, emptying the magma reservoir.
Magma reservoir is refilled by partial melt of depleted mantle <40km deep, with some
crustal contamination. Basaltic Trachy-Andesite, is erupted to form the main cone.
Trachy-Andesite, is evolved by fractional crystallisation before being partly erupted to add to
the main cone.
Xenoliths of local crust contaminated the magma reservoir, resulting in Dacite magma.
Dacite magmas are repeatedly erupted to form recent lava flows.
Fractional crystallisation of the Dacite formed Rhyolite magma.
The crater floor lava flows are made up of Rhyolite.
References:
Gill, R. 2010. Igneous rocks and processes: A practical guide. Wiley-Blackwell.
Murphy, J. B. 2007. Igneous Rock Associations 8. Arc Magmatism II: Geo-chemical and Isotopic
Characteristics. Journal of the Geological Association of Canada, 34.