Evaluation of three universal extractants for the determination of p, no3 an...
ESRF
1. Experiment title:
Influence of the rhizosphere on the speciation of lead
in a smelter contaminated site.
Experiment
number:
30-02-1
Beamline:
BM30B
Date of experiment:
from: 01 November 2002 to: 05 November 2002
Date of report:
24/11/2003
Shifts:
12
Local contact(s):
Dr. Olivier PROUX
Received at ESRF:
Names and affiliations of applicants (* indicates experimentalists):
PhD student Chaden DIYAB*, Dr. Farid JUILLOT*, Dr. Camille DUMAT, Dr Philippe
HINSINGER, Dr. Andre MARIOTTI, Dr. Guillaume MORIN
Report:
Materials and methods
Five soil samples with Pb concentration ranging from 1500 to 3000 mg Pb / kg soil and a sample of
pyromorphite (Pb5(PO4)3OH), which serve as a model compound for Pb chemical form in soil samples, were
studied during this project.
EXAFS data were recorded at the Pb LIII-edge (13.055 keV) at cryogenic temperature (20K), with a
monochromator equipped with two Si(111) crystals. Due to their low Pb concentration, EXAFS data of the
five soil samples were collected in fluorescence mode using a germanium 30-element solid state detector.
Since these soil samples contain large amount of Fe (5 wt%), a Cr filter was used to damp the fluorescence of
this element. No filter was used to attenuate the Rayleigh scattering of the beam. Between 6 and 8 scans were
recorded for each sample. Due to its large Pb concentration, the pyromorphite sample was dilute in cellulose
to reach the optimal Pb concentration for EXAFS experiment in transmission mode. Only two scans were
necessary to reach a good signal/noise ratio for this sample.
Quality of the raw EXAFS spectra of soil samples
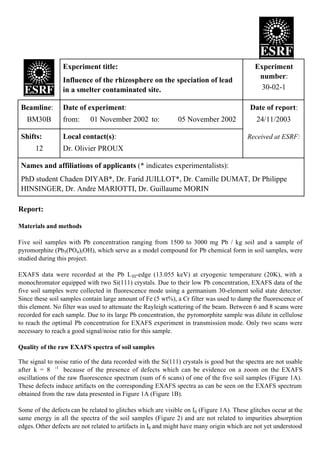
The signal to noise ratio of the data recorded with the Si(111) crystals is good but the spectra are not usable
after k = 8 -1
because of the presence of defects which can be evidence on a zoom on the EXAFS
oscillations of the raw fluorescence spectrum (sum of 6 scans) of one of the five soil samples (Figure 1A).
These defects induce artifacts on the corresponding EXAFS spectra as can be seen on the EXAFS spectrum
obtained from the raw data presented in Figure 1A (Figure 1B).
Some of the defects can be related to glitches which are visible on I0 (Figure 1A). These glitches occur at the
same energy in all the spectra of the soil samples (Figure 2) and are not related to impurities absorption
edges. Other defects are not related to artifacts in I0 and might have many origin which are not yet understood
2. (heterogeneity of the samples, diffraction peaks in the sample, non-linearity between I0 and IF combined with
a noisy I0 ). These defects appear at various positions among the spectra of the soil samples (Figure 2).
0.085
0.086
0.087
0.088
0.089
0.09
0.091
2.6 106
2.8 10
6
3 10
6
3.2 10
6
3.4 10
6
3.6 10
6
3.8 10
6
4 10
6
13100 13200 13300 13400 13500 13600
I/I0
I0
(counts/second)
E (eV)
1
2 3
4
5
6
7 8
9
2 4 6 8 1 0 1 2
k (Å-1
)
k
3
χ(k)
0.5
1
2
3
4 5
6
7
8
9
A B
Figure 1 . A - EXAFS region of the Pb-LIII edge raw spectrum of the rhizospheric soil after 1 week Pea growth with double solid
phosphate adding (I0 is also plotted for comparison). B — EXAFS spectrum corresponding to the raw spectrum presented in Figure
1A. Arrows indicate defects which are labelled from 1 to 9. Dotted lines indicate glitches which are visible on I0 on Figure 1A.
Interpretation of the EXAFS spectra of soil samples
The EXAFS spectra of the five soil samples studied during this project are presented in Figure 2.
2 4 6 8 1 0 1 2
k (Å
-1
)
k3
χ(k)
2
a
b
c
d
e
Figure 2 . Pb-LIII edge EXAFS spectra of a — reference soil, b — rhizospheric soil after 1 week Pea growth with soluble phosphat
adding, c —rhizospheric soil after 1 week Tomato growth with soluble phosphate adding, d —rhizospheric soil after 1 week Pea
growth with double soluble phosphate adding and e - rhizospheric soil after 1 week Pea growth with double solid phosphate
adding. Dotted lines indicate glitches which are visible on I0 on Figure 1A.
Comparison of the spectra in the 2-8 -1
k-range does not indicate major changes among the samples studied,
although some slight differences can be observed in the amplitude and position of the third EXAFS
oscillation. Unfortunately, the 8-10 -1
k-space region, which might have contained diagnostic information
about Pb - 2nd
neighbors in the samples studied, was not usable. Consequently, it is difficult to relate these
slight differences to changes in Pb speciation or to instrumental and/or numerical artifacts.
3. Conclusions
EXAFS data recorded in transmission mode on the pyromorphite reference sample did not show the artifacts
encountered during EXAFS experiments in fluorescence mode on dilute soil samples. For these latter
samples, systematic bias in the data above k = 8 -1
precluded a reliable interpretation of the data in terms of
change in Pb speciation among the samples.
Some of the artifacts, especially the glitches, observed on our data should not be topical since the Si(111) set
of crystals used during this project was replaced by a new set of Si(220) crystals. Attention should be put on
the quality of EXAFS data recorded with this new set of crystals at the Pb LIII-edge energy on dilute samples.
Concerning other artifacts, their origin needs to be found to help improvements on BM30B FAME beamline
and on samples quality.