SlideShare a Scribd company logo
1 of 1
Download to read offline
MLN5
MLN8
SCB3
SCB1
SCB2
SCB5
SCB6
SCB8
SCB7
MLN7
MLN1
MLN3
MLN6
MLN2
MLN4
SCB4
Samples
0
2
4
6
Distance
Size Class
MLN1
MLN2
SCB1
SCB2
MLN3
MLN6
MLN1
MLN4
MLN7
MLN5
MLN8
MLN2
SCB5
SCB8
SCB1
SCB2
SCB3
SCB7
SCB4
SCB6
Samples
0
2
4
6
Distance
Site
Milnerton
Scarborough
The influence of size of the mussel Mytilus
galloprovincialis on the uptake of trace metals.
Introduction
Materials & Methods
Results
Discussion & Conclusions
Two sites were selected namely Milnerton Lagoon (MLN) and Scarborough
(SCB). Approximately 30 mussel samples were taken and 6 sediment and water
samples at each site.
Mussels were measured and weighed and divided into two size classes, the
largest 50 – 75 mm (size class 1) and the smallest 30 – 45 mm (size class 2).The
tissues of eight mussels from each site and eight sediment samples were dried at 60
ºC for 48 hours and homogenised.
Samples (mussel and sediment) were digested with 10 ml HNO3 (Nitric Acid).
The Water samples were digested by adding 10 ml sea water and 5 ml HNO3 (Nitric
Acid). All samples were digested at 40 º C for one hour and afterwards at 120 º C for
3 hours. All samples were filtered and diluted (5 ml digested sample and 10 ml
distilled water). Trace metal analysis was done by means of ICP - AES. A range of
metals were tested for namely Al, Cr, Mn, Fe, Co, Ni, Cu, Zn, Cd and Pb.
Statistics Conducted
STATISTICA v.9 (Statsoft) was used for the data analysis.
T-tests were used to determine differences in trace metal concentrations of sites
and mussels.
Non-parametric Spearman Rank Order Correlations were used to determine the
relationships between the trace metal concentrations in Mytilus galloprovincialis to
the concentration found in the sediment and water.
PRIMER v. 6 (Plymouth Routines in Multivariate Ecological Research) was used to
analyse the relationship between the environmental factors for both Milnerton
Lagoon and Scarborough and indicate the relative dissimilarities of the samples.
Fig. 2. An aerial photograph of both study sites
Milnerton Lagoon and Scarborough
Fig. 3 A - C. Dendrogram representing the cluster analysis of the trace metal levels in a) mussel b) water
and c) sediment at MLN (Milnerton) and SCB (Scarborough) . The data was log x +1 transformed and
normalised. The Euclidean distance was used for the site and size classes.
A significant correlation (R > 0.5) was found between the sediment trace metal
concentration and the concentration in the mussels for Al (R= 0,60), Mn (R= 0,53)
and Cu (R=0,55). Correlations are significant at p< 0.05.
.
Fig. 1. Mytilus galloprovincialis on a rocky shore on the
west coast of South Africa
Bivalves have been used extensively as bio-monitors of heavy metals in
contaminated aquatic ecosystems.
Estuaries, coastal areas and oceans are very sensitive ecosystems that are often
subjected to chemical pollution. Some pollutants and chemicals do occur in the
environment naturally but the increases in levels of contaminants entering coastal
areas are a cause for concern.
Mytilus galloprovincialis (Fig. 1) can either be exposed to contaminants through
uptake of contaminated water or ingestion of contaminated algae or suspended
material.
The South African coast experiences rich upwelling and is therefore highly
productive; therefore one would expect filter feeders to accumulate higher levels of
contaminants. The size of the mussel may be significant in the rate of metal uptake
as smaller mussels having higher metabolic rates than larger mussels and may filter
metals faster.
This study was conducted on the blue mussel Mytilus galloprovincialis to assess
the effect of the size of the mussels on the uptake of trace metals in the
environment.
The aim of this study is:
•To determine the trace metal concentrations in the mussels Mytilus galloprovincialis,
sediment and water in two study sites (Milnerton and Scarborough) (Fig.2).
•To determine whether size affects trace metal uptake.
A
C
Table 1. Results of the one-Way ANOVA performed on the mean trace metal concentrations for the two
sites MLN (Milnerton) and SCB (Scarborough. The mean (± SD) metal
concentrations for MLN and SCB
are presented in Table 1. Most
ANOVA’s between the size classes
and locations showed no
significant differences, except for
Al (p = 0.02) where MLN size class
2 is significantly different from size
class 1 at SCB (Table. 1).All trace
metals were used in the analyses
but only significant relationships
(p<0.05) are presented on the
poster
Table 2. T-test results indicating trace metal concentrations in a)mussel, b)sediment and c) water at MLN
and SCB and trace metal concentrations between size class 1 and size class 2 (d).
Water samples taken at MLN and SCB were similar. Both study areas are influenced
by the Benguela Current and could be the cause, due to long shore and cross shelf
currents transporting water away from the land. Trace metal concentrations found in
the sediment at MLN was higher than sediment sampled at SCB. MLN differs widely
from SCB in terms of trace metal concentrations in the sediment due to MLN being
highly urbanised with more human disturbance than SCB . MLN is influenced by
heavy vehicular activities; oil run off in contrast SCB does not. Mussels sampled at
MLN showed overall increased trace metal concentrations than mussels sampled at
SCB. Trace metal concentrations in smaller mussels (size class 2) was higher than
concentrations in larger mussels (size class 1). Indicating smaller mussels are
better bio indicators for trace metals than larger mussels.
It was demonstrated by several other studies that higher metal concentrations
have been found in smaller mussels compared to larger mature mussels. Smaller
mussels expend their energy on growth rather than on reproduction and therefore
their metal concentrations will be higher.
In conclusion, MLN has relatively higher trace metal concentrations than SCB
which indicates that MLN is more polluted. Size class 2 showed elevated trace
metal concentrations for most of the trace metals tested compared to size class 1.
Therefore the data obtained in this study serves as a baseline for the future
monitoring of the South African coastline, as well as a more integrated study on
the responses of these metals on the fauna and flora in those areas.
The mean (± SD) metal concentrations in mussels, sediment and water for MLN
and SCB as well as metal concentrations between size class 1 (50-75mm) and
size class 2 (30-45mm) are displayed in Table 2. Mussels had significant
differences (p<0.05) in Al, whereas sediment had significant differences in Al, Mn,
Fe, Co, Zn and Pb. Water had significant differences in Cr, Mn, Fe and Co and Cr
and Ni were significantly different between the two size classes.
MLN7
MLN6
MLN2
MLN3
MLN5
MLN1
MLN4
SCB2
SCB3
SCB4
SCB5
SCB1
SCB7
SCB6
Samples
0
2
4
6
8
Distance
SITE
Milnerton
Scarborough
The trace metal concentrations measured in Mytilus galloprovincialis, water and
sediment is illustrated in Fig. 3. Mussels (a) and water (b) indicated no distinct
clusters, meaning all samples are very similar. Sediment shows clustering with
a Euclidian distance of 2 which proves dissimilarities in terms of overall trace
metal concentrations at the two sites.
(a) Al Milnerton Scarborough
Size class 1 Size Class 2 Size class 1 Size Class 2
Mean 86.025 133.23 41.759 80.522
M1
M2
0,293317
S1
0,343401 0,016415
S2
0,996246 0,214172 0,451144
Significant at p< 0.05
(a) MUSSELS
Mean MLN Mean SCB p Standard Deviation
MLN
Standard
Deviation SCB
Al 109,6 61,1 0,030900 45,4523 34,6502
(b) SEDIMENT
Al 392,182 56,6731 0,000001 111,3677 12,0250
Mn 7,1247 4,3030 0,009854 2,5493 0,8084
Fe 545,1961 126,9491 0,000008 171,3798 20,1448
Co 0,1480 0,0759 0,004113 0,0569 0,0177
Zn 1,0480 18,2224 0,000412 2,9641 10,1329
Pb 2,8989 0,3427 0,000008 0,9894 0,3541
(c) WATER
Cr 0,0698 0,0000 0,023685 0,0779 0,0000
Mn 0,1239 0,0053 0,000000 0,0353 0,0151
Fe 1,0820 0,0531 0,000504 0,6297 0,1502
Co 0,0002 0,0000 0,008125 0,0002 0,0000
(d) SIZE CLASS Size class 1 Size class 2
Cr 7,6411 18,7638 0,015291 7,0484 8,9493
Ni 5,8593 12,6957 0,030132 5,2765 6,0328
Chaentine Geduld; Rashieda Toefy1 and Conrad Sparks1
1Department of Biodiversity and Conservation
geduld.chaentine@gmail.com; ToefyR@cput.ac.za and csparks@cput.ac.za
B

More Related Content

What's hot

SasAqS Powerpoint Presentation
SasAqS Powerpoint PresentationSasAqS Powerpoint Presentation
SasAqS Powerpoint PresentationEveFisher
 
Article Raoui, rjpbcs 9(2), 1100 1110, 2018
Article Raoui, rjpbcs 9(2), 1100 1110, 2018Article Raoui, rjpbcs 9(2), 1100 1110, 2018
Article Raoui, rjpbcs 9(2), 1100 1110, 2018sidi mohammed RAOUI
 
Masters Proposal Powerpoint Presentation
Masters Proposal Powerpoint PresentationMasters Proposal Powerpoint Presentation
Masters Proposal Powerpoint PresentationEveFisher
 
Response of Ocean Biogeochemistry and Isotopes to Different Iron Fluxes and C...
Response of Ocean Biogeochemistry and Isotopes to Different Iron Fluxes and C...Response of Ocean Biogeochemistry and Isotopes to Different Iron Fluxes and C...
Response of Ocean Biogeochemistry and Isotopes to Different Iron Fluxes and C...Andreas Schmittner
 
GSA Presentation Poster
GSA Presentation PosterGSA Presentation Poster
GSA Presentation PosterMax Barnett
 
ASLO 2015: Eukaryotic metatranscriptome profiling at Station ALOHA
ASLO 2015: Eukaryotic metatranscriptome profiling at Station ALOHAASLO 2015: Eukaryotic metatranscriptome profiling at Station ALOHA
ASLO 2015: Eukaryotic metatranscriptome profiling at Station ALOHAhalexand
 
English for Academic Purposes
English for Academic PurposesEnglish for Academic Purposes
English for Academic PurposesCeciliaFenech
 
Investigation of heavy metals content (Cd , Ni and Pb) in the muscle tissue o...
Investigation of heavy metals content (Cd , Ni and Pb) in the muscle tissue o...Investigation of heavy metals content (Cd , Ni and Pb) in the muscle tissue o...
Investigation of heavy metals content (Cd , Ni and Pb) in the muscle tissue o...Innspub Net
 
Vinh et al Methanogenic Diversity Two Vegetation Types
Vinh et al Methanogenic Diversity Two Vegetation TypesVinh et al Methanogenic Diversity Two Vegetation Types
Vinh et al Methanogenic Diversity Two Vegetation TypesVinh Tran
 
Trace Metals Concentration in Shallow Well Water in Enugu Metropolis
Trace Metals Concentration in Shallow Well Water in Enugu MetropolisTrace Metals Concentration in Shallow Well Water in Enugu Metropolis
Trace Metals Concentration in Shallow Well Water in Enugu Metropolispaperpublications3
 
Harbour eem overview, ppt.
Harbour eem overview, ppt.Harbour eem overview, ppt.
Harbour eem overview, ppt.NAACAP
 
Christoph Jan KUELLS "Ecohydrological principles in economic models of water ...
Christoph Jan KUELLS "Ecohydrological principles in economic models of water ...Christoph Jan KUELLS "Ecohydrological principles in economic models of water ...
Christoph Jan KUELLS "Ecohydrological principles in economic models of water ...Global Risk Forum GRFDavos
 

What's hot (17)

SasAqS Powerpoint Presentation
SasAqS Powerpoint PresentationSasAqS Powerpoint Presentation
SasAqS Powerpoint Presentation
 
Article Raoui, rjpbcs 9(2), 1100 1110, 2018
Article Raoui, rjpbcs 9(2), 1100 1110, 2018Article Raoui, rjpbcs 9(2), 1100 1110, 2018
Article Raoui, rjpbcs 9(2), 1100 1110, 2018
 
Sample_MRSchiller
Sample_MRSchillerSample_MRSchiller
Sample_MRSchiller
 
Masters Proposal Powerpoint Presentation
Masters Proposal Powerpoint PresentationMasters Proposal Powerpoint Presentation
Masters Proposal Powerpoint Presentation
 
Hw7 alternative solutions_2011
Hw7 alternative solutions_2011Hw7 alternative solutions_2011
Hw7 alternative solutions_2011
 
Response of Ocean Biogeochemistry and Isotopes to Different Iron Fluxes and C...
Response of Ocean Biogeochemistry and Isotopes to Different Iron Fluxes and C...Response of Ocean Biogeochemistry and Isotopes to Different Iron Fluxes and C...
Response of Ocean Biogeochemistry and Isotopes to Different Iron Fluxes and C...
 
GSA Presentation Poster
GSA Presentation PosterGSA Presentation Poster
GSA Presentation Poster
 
ASLO 2015: Eukaryotic metatranscriptome profiling at Station ALOHA
ASLO 2015: Eukaryotic metatranscriptome profiling at Station ALOHAASLO 2015: Eukaryotic metatranscriptome profiling at Station ALOHA
ASLO 2015: Eukaryotic metatranscriptome profiling at Station ALOHA
 
English for Academic Purposes
English for Academic PurposesEnglish for Academic Purposes
English for Academic Purposes
 
Leporacci_Nicole_Poster
Leporacci_Nicole_PosterLeporacci_Nicole_Poster
Leporacci_Nicole_Poster
 
Investigation of heavy metals content (Cd , Ni and Pb) in the muscle tissue o...
Investigation of heavy metals content (Cd , Ni and Pb) in the muscle tissue o...Investigation of heavy metals content (Cd , Ni and Pb) in the muscle tissue o...
Investigation of heavy metals content (Cd , Ni and Pb) in the muscle tissue o...
 
Vinh et al Methanogenic Diversity Two Vegetation Types
Vinh et al Methanogenic Diversity Two Vegetation TypesVinh et al Methanogenic Diversity Two Vegetation Types
Vinh et al Methanogenic Diversity Two Vegetation Types
 
Trace Metals Concentration in Shallow Well Water in Enugu Metropolis
Trace Metals Concentration in Shallow Well Water in Enugu MetropolisTrace Metals Concentration in Shallow Well Water in Enugu Metropolis
Trace Metals Concentration in Shallow Well Water in Enugu Metropolis
 
Harbour eem overview, ppt.
Harbour eem overview, ppt.Harbour eem overview, ppt.
Harbour eem overview, ppt.
 
Class 10, Stable isotopes
Class 10, Stable isotopesClass 10, Stable isotopes
Class 10, Stable isotopes
 
Christoph Jan KUELLS "Ecohydrological principles in economic models of water ...
Christoph Jan KUELLS "Ecohydrological principles in economic models of water ...Christoph Jan KUELLS "Ecohydrological principles in economic models of water ...
Christoph Jan KUELLS "Ecohydrological principles in economic models of water ...
 
misfinalposter
misfinalpostermisfinalposter
misfinalposter
 

Similar to Trace Metal Uptake in Mussels

Heavy metals in langkawi corals
Heavy metals in langkawi coralsHeavy metals in langkawi corals
Heavy metals in langkawi coralsMasrisazlin Bakri
 
Heavy Metals in Sediment from Alvarado Lagoon System in Veracruz, México
Heavy Metals in Sediment from Alvarado Lagoon System in Veracruz, MéxicoHeavy Metals in Sediment from Alvarado Lagoon System in Veracruz, México
Heavy Metals in Sediment from Alvarado Lagoon System in Veracruz, MéxicoIJEAB
 
SETAC Poster Presentation Holly Pearson Nantes
SETAC Poster Presentation Holly Pearson NantesSETAC Poster Presentation Holly Pearson Nantes
SETAC Poster Presentation Holly Pearson NantesHolly Pearson
 
An Assignment On Biotechnological Methods In Pollution Abatement
An Assignment On Biotechnological Methods In Pollution AbatementAn Assignment On Biotechnological Methods In Pollution Abatement
An Assignment On Biotechnological Methods In Pollution AbatementDaphne Smith
 
Study of the Sediments Metallic Contamination in Oum Er-Rbia Estuary
Study of the Sediments Metallic Contamination in Oum Er-Rbia EstuaryStudy of the Sediments Metallic Contamination in Oum Er-Rbia Estuary
Study of the Sediments Metallic Contamination in Oum Er-Rbia EstuaryIOSRJAC
 
LD_JSG_Symposium Poster_2015
LD_JSG_Symposium Poster_2015LD_JSG_Symposium Poster_2015
LD_JSG_Symposium Poster_2015Laura Dafov
 
Red Algae (Rhodophyta) in Biomonitoring of Coastal Ecosystems
Red Algae (Rhodophyta) in Biomonitoring of Coastal Ecosystems Red Algae (Rhodophyta) in Biomonitoring of Coastal Ecosystems
Red Algae (Rhodophyta) in Biomonitoring of Coastal Ecosystems Agriculture Journal IJOEAR
 
Pearce and Mann 2006
Pearce and Mann 2006Pearce and Mann 2006
Pearce and Mann 2006Vicky Mann
 
Comparative study of rates of biosorption for selected single and mixed metal...
Comparative study of rates of biosorption for selected single and mixed metal...Comparative study of rates of biosorption for selected single and mixed metal...
Comparative study of rates of biosorption for selected single and mixed metal...Alexander Decker
 
Bioaccumulation of Lead (Pb) content in three species bivalves in Jakarta Bay...
Bioaccumulation of Lead (Pb) content in three species bivalves in Jakarta Bay...Bioaccumulation of Lead (Pb) content in three species bivalves in Jakarta Bay...
Bioaccumulation of Lead (Pb) content in three species bivalves in Jakarta Bay...Open Access Research Paper
 
Bioaccumulation of Lead (Pb) content in three species bivalves in Jakarta Ba...
 Bioaccumulation of Lead (Pb) content in three species bivalves in Jakarta Ba... Bioaccumulation of Lead (Pb) content in three species bivalves in Jakarta Ba...
Bioaccumulation of Lead (Pb) content in three species bivalves in Jakarta Ba...Innspub Net
 
SETAC Poster Presentation Holly Pearson final reformatted margin
SETAC Poster Presentation Holly Pearson final reformatted marginSETAC Poster Presentation Holly Pearson final reformatted margin
SETAC Poster Presentation Holly Pearson final reformatted marginHolly Pearson
 

Similar to Trace Metal Uptake in Mussels (20)

J045035767
J045035767J045035767
J045035767
 
Heavy metals in langkawi corals
Heavy metals in langkawi coralsHeavy metals in langkawi corals
Heavy metals in langkawi corals
 
EVALUATION OF HEAVY METALS IN SEDIMENT OF SOME SELECTED DAMS FROM KATSINA STA...
EVALUATION OF HEAVY METALS IN SEDIMENT OF SOME SELECTED DAMS FROM KATSINA STA...EVALUATION OF HEAVY METALS IN SEDIMENT OF SOME SELECTED DAMS FROM KATSINA STA...
EVALUATION OF HEAVY METALS IN SEDIMENT OF SOME SELECTED DAMS FROM KATSINA STA...
 
Heavy Metals in Sediment from Alvarado Lagoon System in Veracruz, México
Heavy Metals in Sediment from Alvarado Lagoon System in Veracruz, MéxicoHeavy Metals in Sediment from Alvarado Lagoon System in Veracruz, México
Heavy Metals in Sediment from Alvarado Lagoon System in Veracruz, México
 
SETAC Poster Presentation Holly Pearson Nantes
SETAC Poster Presentation Holly Pearson NantesSETAC Poster Presentation Holly Pearson Nantes
SETAC Poster Presentation Holly Pearson Nantes
 
Gjesm150161451593800
Gjesm150161451593800Gjesm150161451593800
Gjesm150161451593800
 
Nature13667
Nature13667Nature13667
Nature13667
 
An Assignment On Biotechnological Methods In Pollution Abatement
An Assignment On Biotechnological Methods In Pollution AbatementAn Assignment On Biotechnological Methods In Pollution Abatement
An Assignment On Biotechnological Methods In Pollution Abatement
 
Study of the Sediments Metallic Contamination in Oum Er-Rbia Estuary
Study of the Sediments Metallic Contamination in Oum Er-Rbia EstuaryStudy of the Sediments Metallic Contamination in Oum Er-Rbia Estuary
Study of the Sediments Metallic Contamination in Oum Er-Rbia Estuary
 
LD_JSG_Symposium Poster_2015
LD_JSG_Symposium Poster_2015LD_JSG_Symposium Poster_2015
LD_JSG_Symposium Poster_2015
 
Poster
PosterPoster
Poster
 
Red Algae (Rhodophyta) in Biomonitoring of Coastal Ecosystems
Red Algae (Rhodophyta) in Biomonitoring of Coastal Ecosystems Red Algae (Rhodophyta) in Biomonitoring of Coastal Ecosystems
Red Algae (Rhodophyta) in Biomonitoring of Coastal Ecosystems
 
Pearce and Mann 2006
Pearce and Mann 2006Pearce and Mann 2006
Pearce and Mann 2006
 
Comparative study of rates of biosorption for selected single and mixed metal...
Comparative study of rates of biosorption for selected single and mixed metal...Comparative study of rates of biosorption for selected single and mixed metal...
Comparative study of rates of biosorption for selected single and mixed metal...
 
Devonian Rocks
Devonian RocksDevonian Rocks
Devonian Rocks
 
Bioaccumulation of Lead (Pb) content in three species bivalves in Jakarta Bay...
Bioaccumulation of Lead (Pb) content in three species bivalves in Jakarta Bay...Bioaccumulation of Lead (Pb) content in three species bivalves in Jakarta Bay...
Bioaccumulation of Lead (Pb) content in three species bivalves in Jakarta Bay...
 
Bioaccumulation of Lead (Pb) content in three species bivalves in Jakarta Ba...
 Bioaccumulation of Lead (Pb) content in three species bivalves in Jakarta Ba... Bioaccumulation of Lead (Pb) content in three species bivalves in Jakarta Ba...
Bioaccumulation of Lead (Pb) content in three species bivalves in Jakarta Ba...
 
8 0201 gaikwad
8 0201 gaikwad8 0201 gaikwad
8 0201 gaikwad
 
SETAC Poster Presentation Holly Pearson final reformatted margin
SETAC Poster Presentation Holly Pearson final reformatted marginSETAC Poster Presentation Holly Pearson final reformatted margin
SETAC Poster Presentation Holly Pearson final reformatted margin
 
A41010108
A41010108A41010108
A41010108
 

Trace Metal Uptake in Mussels

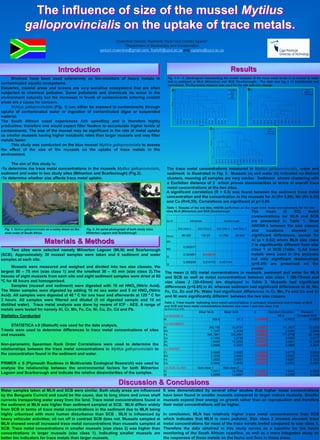
  • 1. MLN5 MLN8 SCB3 SCB1 SCB2 SCB5 SCB6 SCB8 SCB7 MLN7 MLN1 MLN3 MLN6 MLN2 MLN4 SCB4 Samples 0 2 4 6 Distance Size Class MLN1 MLN2 SCB1 SCB2 MLN3 MLN6 MLN1 MLN4 MLN7 MLN5 MLN8 MLN2 SCB5 SCB8 SCB1 SCB2 SCB3 SCB7 SCB4 SCB6 Samples 0 2 4 6 Distance Site Milnerton Scarborough The influence of size of the mussel Mytilus galloprovincialis on the uptake of trace metals. Introduction Materials & Methods Results Discussion & Conclusions Two sites were selected namely Milnerton Lagoon (MLN) and Scarborough (SCB). Approximately 30 mussel samples were taken and 6 sediment and water samples at each site. Mussels were measured and weighed and divided into two size classes, the largest 50 – 75 mm (size class 1) and the smallest 30 – 45 mm (size class 2).The tissues of eight mussels from each site and eight sediment samples were dried at 60 ºC for 48 hours and homogenised. Samples (mussel and sediment) were digested with 10 ml HNO3 (Nitric Acid). The Water samples were digested by adding 10 ml sea water and 5 ml HNO3 (Nitric Acid). All samples were digested at 40 º C for one hour and afterwards at 120 º C for 3 hours. All samples were filtered and diluted (5 ml digested sample and 10 ml distilled water). Trace metal analysis was done by means of ICP - AES. A range of metals were tested for namely Al, Cr, Mn, Fe, Co, Ni, Cu, Zn, Cd and Pb. Statistics Conducted STATISTICA v.9 (Statsoft) was used for the data analysis. T-tests were used to determine differences in trace metal concentrations of sites and mussels. Non-parametric Spearman Rank Order Correlations were used to determine the relationships between the trace metal concentrations in Mytilus galloprovincialis to the concentration found in the sediment and water. PRIMER v. 6 (Plymouth Routines in Multivariate Ecological Research) was used to analyse the relationship between the environmental factors for both Milnerton Lagoon and Scarborough and indicate the relative dissimilarities of the samples. Fig. 2. An aerial photograph of both study sites Milnerton Lagoon and Scarborough Fig. 3 A - C. Dendrogram representing the cluster analysis of the trace metal levels in a) mussel b) water and c) sediment at MLN (Milnerton) and SCB (Scarborough) . The data was log x +1 transformed and normalised. The Euclidean distance was used for the site and size classes. A significant correlation (R > 0.5) was found between the sediment trace metal concentration and the concentration in the mussels for Al (R= 0,60), Mn (R= 0,53) and Cu (R=0,55). Correlations are significant at p< 0.05. . Fig. 1. Mytilus galloprovincialis on a rocky shore on the west coast of South Africa Bivalves have been used extensively as bio-monitors of heavy metals in contaminated aquatic ecosystems. Estuaries, coastal areas and oceans are very sensitive ecosystems that are often subjected to chemical pollution. Some pollutants and chemicals do occur in the environment naturally but the increases in levels of contaminants entering coastal areas are a cause for concern. Mytilus galloprovincialis (Fig. 1) can either be exposed to contaminants through uptake of contaminated water or ingestion of contaminated algae or suspended material. The South African coast experiences rich upwelling and is therefore highly productive; therefore one would expect filter feeders to accumulate higher levels of contaminants. The size of the mussel may be significant in the rate of metal uptake as smaller mussels having higher metabolic rates than larger mussels and may filter metals faster. This study was conducted on the blue mussel Mytilus galloprovincialis to assess the effect of the size of the mussels on the uptake of trace metals in the environment. The aim of this study is: •To determine the trace metal concentrations in the mussels Mytilus galloprovincialis, sediment and water in two study sites (Milnerton and Scarborough) (Fig.2). •To determine whether size affects trace metal uptake. A C Table 1. Results of the one-Way ANOVA performed on the mean trace metal concentrations for the two sites MLN (Milnerton) and SCB (Scarborough. The mean (± SD) metal concentrations for MLN and SCB are presented in Table 1. Most ANOVA’s between the size classes and locations showed no significant differences, except for Al (p = 0.02) where MLN size class 2 is significantly different from size class 1 at SCB (Table. 1).All trace metals were used in the analyses but only significant relationships (p<0.05) are presented on the poster Table 2. T-test results indicating trace metal concentrations in a)mussel, b)sediment and c) water at MLN and SCB and trace metal concentrations between size class 1 and size class 2 (d). Water samples taken at MLN and SCB were similar. Both study areas are influenced by the Benguela Current and could be the cause, due to long shore and cross shelf currents transporting water away from the land. Trace metal concentrations found in the sediment at MLN was higher than sediment sampled at SCB. MLN differs widely from SCB in terms of trace metal concentrations in the sediment due to MLN being highly urbanised with more human disturbance than SCB . MLN is influenced by heavy vehicular activities; oil run off in contrast SCB does not. Mussels sampled at MLN showed overall increased trace metal concentrations than mussels sampled at SCB. Trace metal concentrations in smaller mussels (size class 2) was higher than concentrations in larger mussels (size class 1). Indicating smaller mussels are better bio indicators for trace metals than larger mussels. It was demonstrated by several other studies that higher metal concentrations have been found in smaller mussels compared to larger mature mussels. Smaller mussels expend their energy on growth rather than on reproduction and therefore their metal concentrations will be higher. In conclusion, MLN has relatively higher trace metal concentrations than SCB which indicates that MLN is more polluted. Size class 2 showed elevated trace metal concentrations for most of the trace metals tested compared to size class 1. Therefore the data obtained in this study serves as a baseline for the future monitoring of the South African coastline, as well as a more integrated study on the responses of these metals on the fauna and flora in those areas. The mean (± SD) metal concentrations in mussels, sediment and water for MLN and SCB as well as metal concentrations between size class 1 (50-75mm) and size class 2 (30-45mm) are displayed in Table 2. Mussels had significant differences (p<0.05) in Al, whereas sediment had significant differences in Al, Mn, Fe, Co, Zn and Pb. Water had significant differences in Cr, Mn, Fe and Co and Cr and Ni were significantly different between the two size classes. MLN7 MLN6 MLN2 MLN3 MLN5 MLN1 MLN4 SCB2 SCB3 SCB4 SCB5 SCB1 SCB7 SCB6 Samples 0 2 4 6 8 Distance SITE Milnerton Scarborough The trace metal concentrations measured in Mytilus galloprovincialis, water and sediment is illustrated in Fig. 3. Mussels (a) and water (b) indicated no distinct clusters, meaning all samples are very similar. Sediment shows clustering with a Euclidian distance of 2 which proves dissimilarities in terms of overall trace metal concentrations at the two sites. (a) Al Milnerton Scarborough Size class 1 Size Class 2 Size class 1 Size Class 2 Mean 86.025 133.23 41.759 80.522 M1 M2 0,293317 S1 0,343401 0,016415 S2 0,996246 0,214172 0,451144 Significant at p< 0.05 (a) MUSSELS Mean MLN Mean SCB p Standard Deviation MLN Standard Deviation SCB Al 109,6 61,1 0,030900 45,4523 34,6502 (b) SEDIMENT Al 392,182 56,6731 0,000001 111,3677 12,0250 Mn 7,1247 4,3030 0,009854 2,5493 0,8084 Fe 545,1961 126,9491 0,000008 171,3798 20,1448 Co 0,1480 0,0759 0,004113 0,0569 0,0177 Zn 1,0480 18,2224 0,000412 2,9641 10,1329 Pb 2,8989 0,3427 0,000008 0,9894 0,3541 (c) WATER Cr 0,0698 0,0000 0,023685 0,0779 0,0000 Mn 0,1239 0,0053 0,000000 0,0353 0,0151 Fe 1,0820 0,0531 0,000504 0,6297 0,1502 Co 0,0002 0,0000 0,008125 0,0002 0,0000 (d) SIZE CLASS Size class 1 Size class 2 Cr 7,6411 18,7638 0,015291 7,0484 8,9493 Ni 5,8593 12,6957 0,030132 5,2765 6,0328 Chaentine Geduld; Rashieda Toefy1 and Conrad Sparks1 1Department of Biodiversity and Conservation geduld.chaentine@gmail.com; ToefyR@cput.ac.za and csparks@cput.ac.za B