1. Analysis of soil pH and soil texture among four reforestation study
sites and two different depths at Mount Cuba Center, Hockessin, DE
Cheryl Mauch, Lukas Bernhardt and Jessica Schedlbauer
West Chester University’s College of Arts and Sciences, Department of Biology
• Growth of vegetation can be influenced by the type of soil.
• The pH of a soil greatly influences soil fertility by controlling the solubility of
required plant nutrients (Pidwirny 2013).
• High pH contributes to insoluble nutrients, whereas low pH contributes to
soluble nutrients.
• The texture of the soil can influence nutrient availability, water holding capacity,
pH buffering capacity and cation exchange capacity (Chapin et al. 2011).
• Loamy soils allow for the benefits of each type of soil particle (sand, silt, clay)
with fewer disadvantages than a soil with high clay or sand content (Berry 2007).
• Mt. Cuba Center is conducting an experimental reforestation project with four
different study sites across 75 acres of hayfields.
• Techniques tested: ‘Natural Succession,’ ‘Traditional Orchard-Style Planting,’
‘Low Density-No Shrubs,’ ‘High Density-No Shrubs,’ ‘Low Density-Shrubs and
Understory Trees’ and ‘High Density-Shrubs and Understory Trees.’
• Baseline soil data of the four sites prior to planting can help identify variables
that may influence a tree or shrub’s ability to grow.
• The null hypotheses for both soil pH and soil texture were: There are no
differences among sites, there are no differences between soil depths and there
is no interaction between site and depth.
• The pH values among all four sites were higher than the values cited in the
literature for a temperate deciduous forest (Flinn an Marks 2007, Fraterrigo et
al. 2005).
• In areas with an abundance of rainfall, soil pH tends to increase with depth
because runoff and leaching occurs (Sandall 2015).
• Past agricultural maintenance such as possible liming of the fields for optimal
growth may also account for higher pH values.
• The texture of soils within the four study sites were loam, silt loam and sandy
loam.
• In comparison, southeastern Pennsylvania’s agricultural lands most prevalently
contain a loam or silt loam textured soil (Black and Abrams 2001).
• Study sites which have non-uniform soil characteristics such pH and texture can
cause inconsistencies in the reforestation study and difficulty in analyzing the six
different techniques being tested.
• To determine a repeatable reforestation technique, these soil characteristics
along with future growth data should be analyzed to determine the ideal
technique to reforest an agricultural field
Chapin, S., Matson, P., Vitousek, P. (2011). Principles of terrestrial ecosystem ecology. Springer
Science+Business Media: 82-84.
Flinn, K.M. & Marks, P.L. (2007) Agricultural legacies in forest environments, tree communities,
soil properties, and light availability. Ecological Applications, 17, 452–463.
Fraterrigo, J.M., Turner, M.G., Pearson, S.M. & Dixon, P. (2005) Effects of past land use on
spatial heterogeneity of soil nutrients in southern Appalachian forests. Ecological
Monographs, 75, 215–230.
Gee, G.W. and Bauder, J.W. (1986). Particle-size Analysis. Methods of Soil Analysis Part 1.
Physical and Mineralogical Methods-Agronomy Monograph no.9 2nd Edition. American
Society of Agronomy-Soil Science Society of America. pp. 383-411.
Sandall, L. (2015). Why Does Soil pH Change? Plant and Soil Sciences elibrary. Retrieved from:
http://passel.unl.edu/pages/index2col.php?category=soilscience
Pidwirny, Michael. (2013). Soil. The Encyclopedia of Earth. Retrieved from
http://www.eoearth.org/view/article/156081
Taiz, L., Zeiger, E. (2010) Plant Physiology, Fifth Edition. Sinauer Associates, Inc. pp.113-120.
• Study sites were determined by Mt. Cuba Center.
• Ramsey-1 and Ramsey-2 are adjacent sites within a single hayfield and Barley
Mill-1 and Barley Mill-2 are adjacent sites from a second hayfield (Fig.4)
• Within six plots per site, composite soil samples were collected 10-15 meters
from each plot center in the north and south direction at 0-10 cm and 10-20 cm
depths (Fig. 6).
• Measurements of pH were taken with the VWR Scientific Products pH probe
(model number 8005, Orion Research Inc.)
• Soil texture was assessed with hydrometer measurements used to determine
the rate at which suspended particles settled to the bottom of a solution at time
intervals of 30 s, 60 s, 90 min and 24 h (Fig. 5).
• The effects of depth and site on pH values were evaluated using a two-way
ANOVA, and significant main effects assessed with a post-hoc Tukey test.
• Texture values obtained were used to determine the percent make-up of clay,
silt and sand following the methods of Gee and Bauder (1986), texture triangle
was utilized once percentages were determined.
0
1
2
3
4
5
6
7
8
Ramsey-1 Ramsey-2 Barley Mill-1 Barley Mill-2
MeanpH
Site
0-10 Mean pH 10-20 Mean pH
A C C
0-10 cm - a
10-20 cm - a
B
Table 1. This table displays the p-value output from R analysis for each
hypothesis tested with a two-way ANOVA test. Null hypotheses for both
mean pH and soil texture of the study are: There is no difference among
sites, there is no difference between depths, and there is no interaction
between site and depth. The null was rejected for both site and depth
when analyzing pH significance.
Figure 2. These two contour filled maps represent average pH across all sites at a depth of 0-10 cm.
The top map displays pH values for Ramsey-2 on the left half of the map and Ramsey-1 on the right
portion of the map. The bottom map shows the two Barley Mill sites with Barley Mill-1 on the left
and Barley Mill-2 on the right. The sites are situated in the same layout as they are seen at Mt.
Cuba Center. The cooler colors within these maps display lower pH values while the warm colors
signify higher pH values.
Figure 1. This double bar graph displays the average pH value
for the four study sites and two depth intervals; Error bars
represent standard error. Letters A, B and C signify statistical
differences among the sites. Both of the Ramsey sites had
significantly different pH values from all four sites tested (A
and B), the Barley Mill sites were significantly different than
the Ramsey sites but did not differ from each other (C and C).
Depth intervals among the sites showed a significant
difference, however the Tukey test was unable to separate the
means (a).
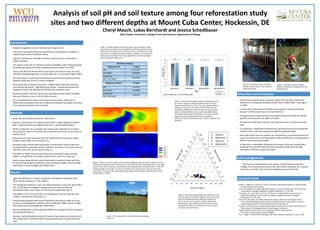
Figure 3. This tertiary graph displays the percent silt, clay,
and sand within each sample analyzed. The various study
sites are distinguished by four different symbols and
colors. The textures found did not differ significantly
among study sites or depth intervals and each site was
composed of a different combination of loam, silt loam
and sandy loam soil textures.
Figure 4. This is Barley Mill-1 field on the day soil sampling
occurred.
This study was possible due to the support of West Chester University’s
College of Arts and Sciences and the Mt. Cuba Center, Hockessin, DE. A special
thank you to the Mt. Cuba Center for allowing access to their lands.
Figure 5. This picture shows 16 texture
samples and one blank to be measured
with a hydrometer.
Introduction
Methods
Statistical Analysis
Response: pH P-value
Site 2.2 x 10⁻¹⁶
Soil Depth 0.006814
Interaction:
Site* Soil Depth
0.579567
Response: Texture P-value
Site 0.07547
Soil Depth 0.19908
Interaction:
Site*Soil Depth
0.25447 Discussion and Conclusions
Acknowledgements
Literature Cited
Results
• Significant differences in values among sites and between soil depths were
found with pH analysis (p < 0.05, Table 1).
• The average pH of Ramsey-1 was 7.02 whereas Ramsey-2 was 6.66. Barley Mill-1
and -2 had lower pH averages in comparison to the Ramsey sites and
maintained similar mean values of 5.93 and 5.89 respectively (Fig. 1).
• Soil depths of 0-10 cm and 10-20 cm were significant, yet the Tukey test was
unable to separate the means (Fig. 1).
• Texture values obtained were used to determine the percent make-up of clay,
silt and sand following the methods of Gee and Bauder (1986), texture triangle
was utilized once percentages were determined.
• Texture findings did not show significant differences among the sites or between
the soil depths (Table 1).
• Ramsey-1 was dominated by loam soil, Ramsey-2 was made up of loam and silt
loam, Barley Mill-1 and Barley Mill-2 had equal dominance of sandy loam and
loam.
Figure 6. In the picture above, Cheryl
Mauch is collecting a soil sample from the
Barley Mill site.