1. New York Credit Union Profile
Year End 2015
CUNA ECONOMICS & STATISTICS 22 YEAR END 2015
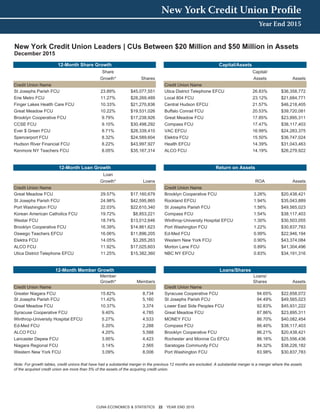
New York Credit Union Leaders | CUs Between $20 Million and $50 Million in Assets
December 2015
Share Capital/
Growth* Shares Assets Assets
Credit Union Name Credit Union Name
St Josephs Parish FCU 23.89% $45,077,551 Utica District Telephone EFCU 26.83% $36,358,772
Erie Metro FCU 11.27% $28,269,489 Local 804 FCU 23.12% $21,684,771
Finger Lakes Health Care FCU 10.33% $21,270,836 Central Hudson EFCU 21.57% $46,218,405
Great Meadow FCU 10.22% $19,531,026 Buffalo Conrail FCU 20.53% $39,720,081
Brooklyn Cooperative FCU 9.79% $17,238,926 Great Meadow FCU 17.85% $23,895,311
CCSE FCU 9.10% $30,498,292 Compass FCU 17.47% $38,117,403
Ever $ Green FCU 8.71% $28,339,410 VAC EFCU 16.99% $24,283,375
Spencerport FCU 8.32% $24,589,604 Elektra FCU 15.50% $36,747,024
Hudson River Financial FCU 8.22% $43,997,927 Health EFCU 14.39% $31,043,463
Kenmore NY Teachers FCU 8.05% $35,167,314 ALCO FCU 14.19% $26,279,922
Loan
Growth* Loans ROA Assets
Credit Union Name Credit Union Name
Great Meadow FCU 29.57% $17,160,679 Brooklyn Cooperative FCU 3.26% $20,438,421
St Josephs Parish FCU 24.98% $42,595,865 Rockland EFCU 1.94% $35,043,889
Port Washington FCU 22.03% $22,610,340 St Josephs Parish FCU 1.56% $49,565,023
Korean American Catholics FCU 19.72% $8,853,221 Compass FCU 1.54% $38,117,403
Westar FCU 18.74% $13,012,646 Winthrop-University Hospital EFCU 1.30% $30,503,055
Brooklyn Cooperative FCU 16.39% $14,861,623 Port Washington FCU 1.22% $30,837,783
Oswego Teachers EFCU 16.06% $11,896,205 Ed-Med FCU 0.99% $22,946,194
Elektra FCU 14.05% $3,265,263 Western New York FCU 0.90% $43,374,084
ALCO FCU 11.92% $17,025,603 Morton Lane FCU 0.89% $41,304,496
Utica District Telephone EFCU 11.25% $15,382,360 NBC NY EFCU 0.83% $34,191,316
Member Loans/
Growth* Members Shares Assets
Credit Union Name Credit Union Name
Greater Niagara FCU 15.82% 8,734 Syracuse Cooperative FCU 94.65% $22,658,072
St Josephs Parish FCU 11.42% 5,160 St Josephs Parish FCU 94.49% $49,565,023
Great Meadow FCU 10.37% 3,374 Lower East Side Peoples FCU 92.83% $45,931,222
Syracuse Cooperative FCU 9.40% 4,785 Great Meadow FCU 87.86% $23,895,311
Winthrop-University Hospital EFCU 5.27% 4,533 MONEY FCU 86.70% $40,082,454
Ed-Med FCU 5.20% 2,288 Compass FCU 86.40% $38,117,403
ALCO FCU 4.20% 5,588 Brooklyn Cooperative FCU 86.21% $20,438,421
Lancaster Depew FCU 3.95% 4,423 Rochester and Monroe Co EFCU 86.16% $25,556,436
Niagara Regional FCU 3.14% 2,565 Saratogas Community FCU 84.32% $38,226,182
Western New York FCU 3.09% 8,006 Port Washington FCU 83.98% $30,837,783
Note: For growth tables, credit unions that have had a substantial merger in the previous 12 months are excluded. A substantial merger is a merger where the assets
of the acquired credit union are more than 5% of the assets of the acquiring credit union.
12-Month Member Growth Loans/Shares
12-Month Share Growth Capital/Assets
12-Month Loan Growth Return on Assets