Recommended

Recommended
More Related Content
What's hot
What's hot (20)
Similar to fall2016_symposium2
Similar to fall2016_symposium2 (20)
fall2016_symposium2
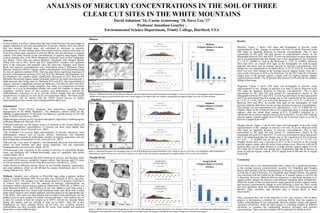
- 1. ANALYSIS OF MERCURY CONCENTRATIONS IN THE SOIL OF THREE CLEAR CUT SITES IN THE WHITE MOUNTAINS David Johnston ‘16, Cassia Armstrong ’18, Steve Leo ‘17 Professor Jonathan Gourley , Environmental Science Department, Trinity College, Hartford, USA Abstract: In past studies, a positive relationship has been found between the percentage of organic materials in soil and concentrations of mercury. Studies have also shown that less densely forested areas are correlated to increases in mercury concentrations. In clear cutting, these observations seem to contrast each other, as forest loss means more exposure to airborne fallout, but also decreases in organic content. This study focuses on the concentrations of mercury and organic matter in three separate sites in the White Mountains National Forest in New Hampshire and Maine. These sites are named Milstone, Hogsback, and Douglas Brook, which were cut in 2014, 2014, and 2015 respectively. Samples were gathered prior to the clear-cuts, and annually since the clear-cuts. Samples were freeze dried, and mercury concentrations were determined using a Milestone Direct Mercury Analyzer (DMA). Organic matter concentrations were determined using the loss on ignitions method (LOI). Thus far, data shows significant decreases in mercury concentrations between 2013 and 2014 for Millstone and Hogsback. For the Hogsback site, organic matter significantly decreased as well, however for Millstone the percent organic matter remained relatively the same showing only a slight decrease after being clear-cut. Between 2014 and 2015, the concentration of mercury showed a significant increase for Millstone. The data for 2014 and 2015 of Hogsback is currently being compiled. This study is a comparison of results overtime, so it is to be determined whether this trend will continue in future site samplings. Another focus of this summer was determining a method for methylmercury extraction so as to provide further insight into the binding characteristics of mercury to soil and its environmental effects. The final results of this study will be shared with the USDA Forest Service to further understanding on how current clear-cutting methods affect soils. Introduction: •The USDA Forest Service proposed four alternatives regarding forest management on the White Mountains. The alternative chosen called for the addition of approximately 34,500 acres of wilderness, and the harvest of 281,300 acres. (USDA Forest Service, 2005). •High-elevation forests receive elevated atmospheric deposition of anthropogenic pollutants (Blackwell, Driscoll, 2015) •Airborne emissions are the largest source of mercury in the United States and globally. Atmospheric concentrations of mercury are three times higher than preanthropogenic levels (Driscoll et al., 2007) •The Northeast U.S receives high concentrations of mercury deposition from anthropogenic sources such as electric utilities, incinerators, and industrial processes. Forest regions are particularly sensitive to mercury deposition, and can lead to high Hg concentrations in fish. (Driscoll et al., 2007) •Mercury has a vast array of cognitive, developmental, physical, and behavioural effects on both humans and other living organisms, and can experience biomagnification in ecosystems. (Bank, 2012). •Characteristics that contribute to the cycling of mercury in watersheds include slope, soil thickness, pH, wetland percentage, types of vegetation, and carbon content (Bank, 2012). •High carbon conent increases the soil's retention of mercury, and therefore alone can predict 44% mercury variability. Organic carbon, fine fraction, and C/N ratios in soil can predict mercury levels with close accuracy. (Gruba et al., 2014). •Other factors in affected mercury fluxes in soil include moisture, temperature, and solar radiation, which are all affected by canopy disturbances due to clear cutting (Mazur et al., 2014). Methods: Samples were collected in Whirl-Pak bags using a transect method (using a Garmin Montana 650). Pre-cut data was collected in 2013, and post- clearcut in 2014. The samples were then freeze dried in a Labconco FreeZone 6 to remove any moisture. For the analysis of mercury concentrations, an instrument called a direct mercury analyzer (Milestone's DMA-80, or DMA) was used. Between 0.0100 g and 0.0200 g of soil was added to each boat using a sterilized spatula that was rinsed with deionized water and dried with a clean paper towel between each sample addition, and then placed in the appropriate slot in the DMA. This mass was then labeled and recorded in the instrument, and the method used for each sample was called "stream sediment." This method was set to take ten seconds to heat the sample up to 200°C, left for ten seconds before taking one minute and ten seconds to heat up to 650°C, then left at this temperature for three minutes before let to cool. The resulting mercury concentration was then recorded, and the file saved. Each sample was analyzed three times on three different days. 2013 2014 2015 2013 2014 2015 0 0.1 0.2 0.3 0.4 Numberofsamplesasfraction oftotal Range of Mercury level in ppb Milstone O horizon Mercury Precut 2013 Postcut 2014 Postcut 2015 0 0.2 0.4 0.6 Numberofsamplesasfraction oftotal Range of Mercury level in ppb Milstone B horizon Mercury Precut 2013 Postcut 2014 Postcut 2015 0 0.1 0.2 0.3 Numberofsamplesasfraction oftotal Range of Mercury level in ppb Hogsback O horizon Mercury Precut (2013) Postcut 2014 Postcut (2015) 0 0.1 0.2 0.3 0.4 Numberofsamplesasfraction oftotal Range of Mercury level in ppb Hogsback B horizon Mercury Precut (2013) Postcut 2014 Postcut (2015) Milstone Hogsback Douglas Brook Results: Milstone: Figure 1 shows GIS maps and histographs to provide visual representations of the changes in mercury over time. It can be observed in the GIS maps an apparent decrease in mercury concentrations. This is also represented in the shift left and spread of concentrations shown in the histographs between 2013 and 2014. A t-test was performed on these data points and it was determined that this change was in fact significant for the O-horizon (t = 5.6, P <0.0001) as well as the B-horizon (t =5.65, P <0.0001). Between 2014 and 2015, an overall shift right on the histographs for both horizons indicates that there was an average increase in mercury concentrations. This change was also determined to be significant (t=-2.33, P= 0.0219). For Milstone there was very little change in the average percent organic matter from the 3 years in the O horizon as well as the B horizon. For the 2015 data the O horizon ranges from 0-100 percent organic content with the highest percent organic content between 60-80. The B horizon falls between 0-40 with all the samples falling in that range. Hogsback: Figure 2 shows GIS maps and histographs to provide visual representations of the changes in mercury over time. It can be observed in the GIS maps an apparent decrease in mercury concentrations. This is also represented in the shift left and spread of concentrations shown in the histographs between 2013 and 2014. A t-test was performed on these data points and it was determined that this change was in fact significant for the O-horizon (t = 4.71, P = 6.49 x10⁻⁶ ) as well as the B-horizon (t = 4.13, P = 5.66 x10⁻⁵ ). Between 2014 and 2015, an overall shift right on the histographs for both horizons indicates that there was an average increase in mercury concentrations. This change was also determined to be significant (t= -3.83, P= 0.000274). For Organic matter in the O horizon there was a significant drop in average percent organics after the initial clear cutting (t=8.15, P<0.0001) followed by a significant rise in percen organics between 2014 and 2015. For the 2015 data the percent organic content ranged from 0-100 in the O horizon where as in the B horizon it ranged from 0-60. Douglas Brook: Figure 3 shows GIS maps and histographs to provide visual representations of the changes in mercury over time. It can be observed in the GIS maps an apparent decrease in mercury concentrations. This is also represented in the shift left and spread of concentrations shown in the histographs between 2013 and 2015. A t-test was performed on these data points and it was determined that this change was in fact significant for the O-horizon (t= -4.93 = , P <0.0001) but not for the B-horizon (t =-1.47, P = 0.145). For Douglas Brook there was a decrease in 2015 in the O horizon in the average percent organic matter after the initial clear cutting event. However with the B horizon there was an slight increase in average percent organic matter. For the 2015 data the O horizon was spread more consistently than the B horizon in terms of percent organic content. The O ranged from 0-100 and the B ranged from 0-60. Conclusion: For all three sites it was determined that after a clear-cut, a significant decrease in the average mercury concentrations occurred. For Hogsback and Douglas Brook, after another year the concentrations of mercury increased. This occured in both the O and B horizons. For Hogsback and Douglas Brook, this pattern was consistent with the results for the change in % organic matter as well for the O Horizons. However, Milstone did not experience a significant decrease in % organic matter, despite the mercury concentrations changing rather dramatically. While the results of this research answer many questions in how organic matter and mercury concentrations change in soils following a clear cut, these results also raise questions about the relationship between these two components, and whether slope, elevation, and direction play a crucial factor in these observations. These questions have led to the initiation of two new projects. One of these projects is determining a method for extracting MeHg from the samples to further understanding of the relationship between organic matter and organic variations of mercury, while the other project is collecting samples at different elevations to examine the relationship between elevation and mercury concentrations. These elevated samples will be analyzed for MeHg as well. 0 0.1 0.2 0.3 0.4 Numberofsamplesasfractionof total Range of Mercury level in ppb Douglas Brook O Horizon Mercury 2013 2015 0 0.1 0.2 0.3 0.4 Numberofsamplesasfractionof total Range of Mercury level in ppb Douglas Brook B Horizon Mercury 2013 2015 Figure 1: Millstone GIS maps of the Milstone clear-cut site (left) displaying the spatial distribution and change in mercury over time, and histographs (right) displaying the distribution of mercury concentrations over time. The bar graph on the right shows the change in average percent organic matter over time for both horizons. Figure 2: Millstone GIS maps of the Hogsback clear-cut site (left) displaying the spatial distribution and change in mercury over time, and histographs (right) displaying the distribution of concentrations over time. The bar graph on the right shows the change in average percent organic matter over time for both horizons. Figure 3: Millstone GIS maps of the Douglas Brook clear-cut site (left) displaying the spatial distribution and change in mercury over time, and histographs (right) displaying the distribution of concentrations over time. The bar graph on the right shows the change in average percent organic matter over time for both horizons. 0 20 40 60 80 100 120 O Horizon 2013 O Horizon 2014 O Horizon 2015 B Horizon 2013 B Horizon 2014 B Horizon 2015 AverageOrangics(%) Horizon Milstone % Organic Matter in O and B Horizons 0 20 40 60 80 100 120 O 2013 O 2014 O 2015 B 2013 B 2014 B 2015 AverageOrangics(%) Horizon Hogsback % Organic Matter in O and B Horizons 0 20 40 60 80 100 120 pre cut O O horizon 2015 pre cut B B horizon 2015 AverageOrangics(%) Horizon Douglas Brook % Organic Matter in O and B Horizons