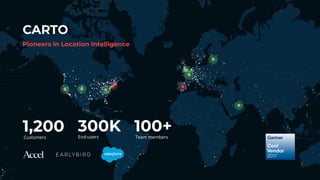
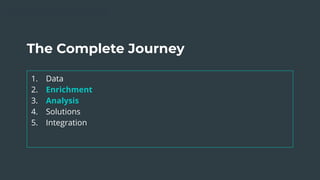
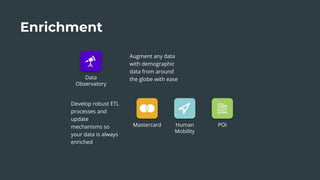
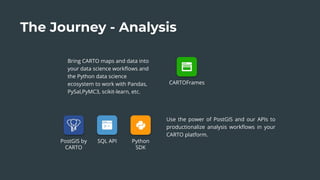
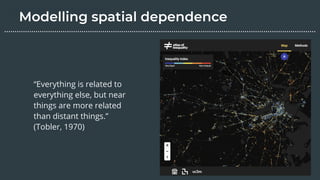
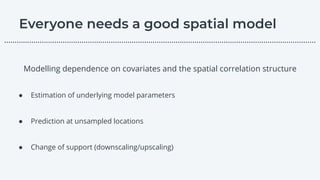
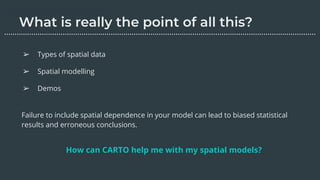
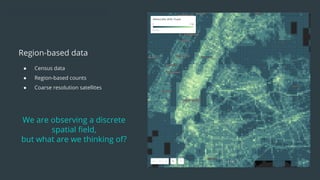
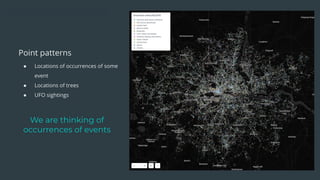
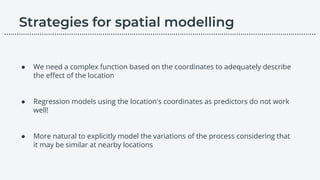
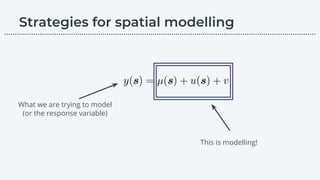
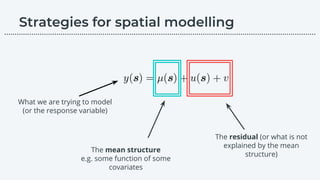
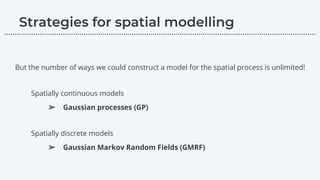
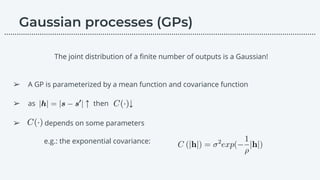
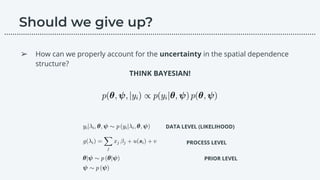
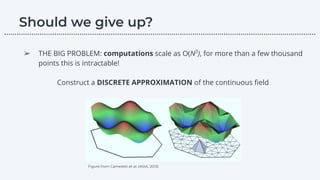
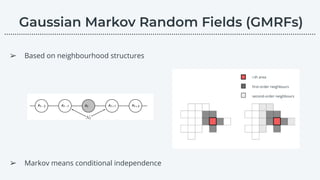
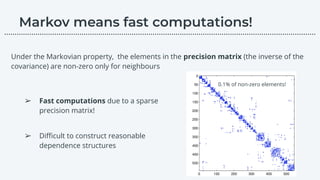
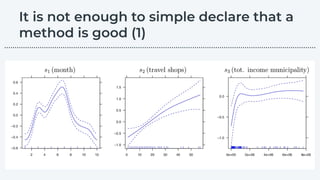
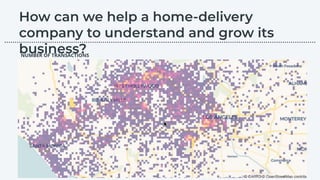
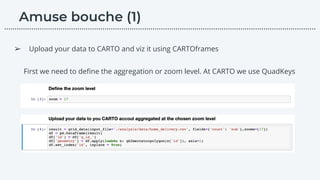
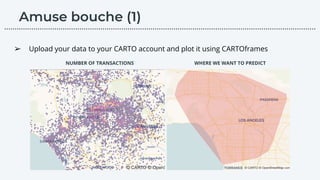
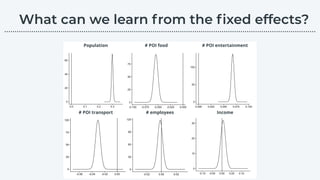
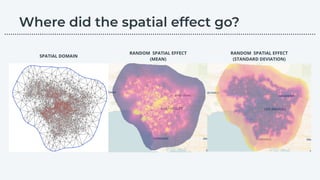
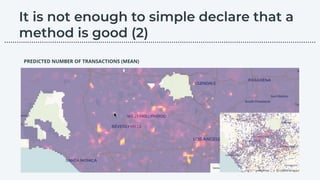
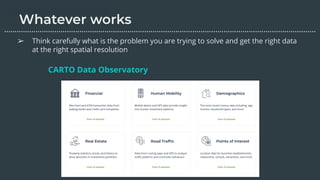
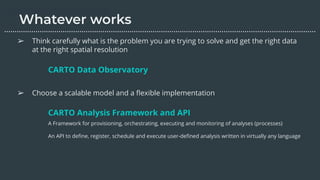
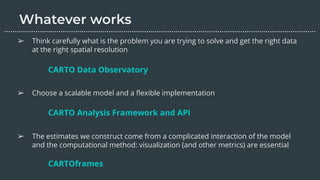
FOLLOW @CARTO ON TWITTER
The Sum of Our Parts
Data Scientist Content Marketing Manager
CARTO is the platform to build
powerful Location Intelligence apps
with the best data streams available.
CARTO
Customers
Pioneers in Location Intelligence
1,200 End-users
300K Team members
100+
The Complete Journey
1. Data
2. Enrichment
3. Analysis
4. Solutions
5. Integration
The Complete Journey
1. Data
2. Enrichment
3. Analysis
4. Solutions
5. Integration
Enrichment
Augment any data
with demographic
data from around
the globe with easeData
Observatory
Develop robust ETL
processes and
update
mechanisms so
your data is always
enriched
Mastercard Human
Mobility
POI
The Journey - Analysis
Bring CARTO maps and data into
your data science workflows and
the Python data science
ecosystem to work with Pandas,
PySal,PyMC3, scikit-learn, etc.
CARTOFrames
Use the power of PostGIS and our APIs to
productionalize analysis workflows in your
CARTO platform.
PostGIS by
CARTO
SQL API Python
SDK
John Snow’s map of cholera cases in London 1854. Red circles indicate locations of cholera
cases and blue circles indicate locations of water pumps.
………………………………………………………………………………………………………….………………….…...
“Everything is related to
everything else, but near
things are more related
than distant things.”
(Tobler, 1970)
………………………………………………………………………………………………………….………………….…...
Modelling dependence on covariates and the spatial correlation structure
● Estimation of underlying model parameters
● Prediction at unsampled locations
● Change of support (downscaling/upscaling)
………………………………………………………………………………………………………….………………….…...
Failure to include spatial dependence in your model can lead to biased statistical
results and erroneous conclusions.
How can CARTO help me with my spatial models?
➢ Types of spatial data
➢ Spatial modelling
➢ Demos
………………………………………………………………………………………………………….………………….…...
● GPS tracking
● Fixed measuring devices
● High resolution satellites
Geostatistical data
We are thinking of a
continuous spatial field
● Census data
● Region-based counts
● Coarse resolution satellites
Region-based data
We are observing a discrete
spatial field,
but what are we thinking of?
● Census data
● Region-based counts
● Coarse resolution satellites
Region-based data
We are observing a discrete
spatial field,
but what are we thinking of?
● Locations of occurrences of some
event
● Locations of trees
● UFO sightings
Point patterns
We are thinking of
occurrences of events
● We need a complex function based on the coordinates to adequately describe
the effect of the location
● Regression models using the location's coordinates as predictors do not work
well!
● More natural to explicitly model the variations of the process considering that
it may be similar at nearby locations
………………………………………………………………………………………………………….………………….…...
What we are trying to model
(or the response variable)
This is modelling!
………………………………………………………………………………………………………….………………….…...
The mean structure
e.g. some function of some
covariates
The residual (or what is not
explained by the mean
structure)
What we are trying to model
(or the response variable)
………………………………………………………………………………………………………….………………….…...
But the number of ways we could construct a model for the spatial process is unlimited!
Spatially continuous models
➢ Gaussian processes (GP)
Spatially discrete models
➢ Gaussian Markov Random Fields (GMRF)
………………………………………………………………………………………………………….………………….…...
➢ A GP is parameterized by a mean function and covariance function
➢ as ↑ then ↓
➢ depends on some parameters
e.g.: the exponential covariance:
The joint distribution of a finite number of outputs is a Gaussian!
………………………………………………………………………………………………………….………………….…...
………………………………………………………………………………………………………….………………….…...
Empirical
………………………………………………………………………………………………………….………………….…...
Empirical
Model
………………………………………………………………………………………………………….………………….…...
………………………………………………………………………………………………………….………………….…...
➢ How can we properly account for the uncertainty in the spatial dependence
structure?
THINK BAYESIAN!
DATA LEVEL (LIKELIHOOD)
PROCESS LEVEL
PRIOR LEVEL
………………………………………………………………………………………………………….………………….…...
➢ THE BIG PROBLEM: computations scale as O(N3
), for more than a few thousand
points this is intractable!
Construct a DISCRETE APPROXIMATION of the continuous field
Figure from Cameletti et al. (AStA, 2013)
………………………………………………………………………………………………………….………………….…...
➢ Based on neighbourhood structures
𝑖-th area
first-order neighbours
second-order neighbours
➢ Markov means conditional independence
………………………………………………………………………………………………………….………………….…...
Under the Markovian property, the elements in the precision matrix (the inverse of the
covariance) are non-zero only for neighbours
➢ Fast computations due to a sparse
precision matrix!
➢ Difficult to construct reasonable
dependence structures
0.1% of non-zero elements!
………………………………………………………………………………………………………….………………….…...
………………………………………………………………………………………………………….………………….…...
➢ Compare revenues from each travel agency to market performance
➢ We can use data from credit cards from purchases in the travel sector
………………………………………………………………………………………………………….………………….…...
Travel agencies
Credit card data
………………………………………………………………………………………………………….………………….…...
➢ Compare revenues from each travel agency to market performance
➢ We can use data from credit cards from purchases in the travel sector
➢ BUT… credit card data get anonymized in many locations
………………………………………………………………………………………………………….………………….…...
1 month of data
5 months of data
12 months of data
………………………………………………………………………………………………………….………………….…...
➢ Compare revenues from each travel agency to market performance
➢ We can use data from credit cards from purchases in the travel sector
➢ BUT… credit card data get anonymized in many locations
………………………………………………………………………………………………………….………………….…...
CAN WE PREDICT AT LOCATIONS WHERE THERE ARE NO DATA?
R package: mgcv, Wood (2011, Journal of the Royal Statistical Society: Series B)
CAN WE PREDICT AT LOCATIONS WHERE THERE ARE NO DATA?
➢ Compare revenues from each travel agency to market performance
➢ We can use data from credit cards from purchases in the travel sector
➢ BUT… credit card data get anonymized in many locations
………………………………………………………………………………………………………….………………….…...
R package: mgcv, Wood (2011, Journal of the Royal Statistical Society: Series B)
w/ GRMF smoothw/o GRMF smooth
PREDICTED
ORIGINAL ORIGINAL
………………………………………………………………………………………………………….………………….…...
………………………………………………………………………………………………………….………………….…...
………………………………………………………………………………………………………….………………….…...
………………………………………………………………………………………………………….………………….…...
NUMBER OF TRANSACTIONS
➢ Upload your data to CARTO and viz it using CARTOframes
First we need to define the aggregation or zoom level. At CARTO we use QuadKeys
………………………………………………………………………………………………………….………………….…...
NUMBER OF TRANSACTIONS WHERE WE WANT TO PREDICT
➢ Upload your data to your CARTO account and plot it using CARTOframes
………………………………………………………………………………………………………….………………….…...
➢ Before modelling, enrich your data with CARTO DATA OBSERVATORY (DO)
………………………………………………………………………………………………………….………………….…...
➢ Before modelling, enrich your data with CARTO DATA OBSERVATORY (DO)
………………………………………………………………………………………………………….………………….…...
➢ Before modelling, enrich your data with CARTO DATA OBSERVATORY (DO)
………………………………………………………………………………………………………….………………….…...
NUMBER OF TRANSACTIONS DATA WE WANT TO USE AS COVARIATES
e.g. POPULATION
➢ Before modelling, viz with CARTOframes
………………………………………………………………………………………………………….………………….…...
NUMBER OF TRANSACTIONS DATA WE WANT TO USE AS COVARIATES
e.g. NUMBER OF FOOD POIs
➢ Before modelling, viz with CARTOframes
………………………………………………………………………………………………………….………………….…...
PRIORS
HYPER PRIORS
PROCESS
DATA
………………………………………………………………………………………………………….………………….…...
NUMBER OF TRANSACTIONS
R package: R-INLA, Lindgren and Rue (2015, JSS)
PREDICTED NUMBER OF TRANSACTIONS
(MEAN)
NUMBER OF TRANSACTIONS
………………………………………………………………………………………………………….………………….…...
PREDICTED NUMBER OF TRANSACTIONS
(STANDARD DEVIATION)
NUMBER OF TRANSACTIONS
………………………………………………………………………………………………………….………………….…...
Population # POI food # POI entertainment
Income# POI transport # employees
………………………………………………………………………………………………………….………………….…...
RANDOM SPATIAL EFFECT
(MEAN)
RANDOM SPATIAL EFFECT
(STANDARD DEVIATION)
SPATIAL DOMAIN
………………………………………………………………………………………………………….………………….…...
PREDICTED NUMBER OF TRANSACTIONS (MEAN)
………………………………………………………………………………………………………….………………….…...
➢ Think carefully what is the problem you are trying to solve and get the right data
at the right spatial resolution
CARTO Data Observatory
………………………………………………………………………………………………………….………………….…...
➢ Think carefully what is the problem you are trying to solve and get the right data
at the right spatial resolution
➢ Choose a scalable model and a flexible implementation
CARTO Data Observatory
………………………………………………………………………………………………………….………………….…...
CARTO Analysis Framework and API
A Framework for provisioning, orchestrating, executing and monitoring of analyses (processes)
An API to define, register, schedule and execute user-defined analysis written in virtually any language
➢ Think carefully what is the problem you are trying to solve and get the right data
at the right spatial resolution
➢ Choose a scalable model and a flexible implementation
➢ The estimates we construct come from a complicated interaction of the model
and the computational method: visualization (and other metrics) are essential
CARTO Data Observatory
………………………………………………………………………………………………………….………………….…...
CARTO Analysis Framework and API
CARTOframes
Request a demo at CARTO.COM
Data Scientist // giulia@carto.com
Content Marketing Manager // sisaac@carto.com

Think Spatial: Don't Ignore Location in your Models! [CARTOframes]

  • 1.
  • 2.
    The Sum ofOur Parts Data Scientist Content Marketing Manager
  • 3.
    CARTO is theplatform to build powerful Location Intelligence apps with the best data streams available.
  • 4.
    CARTO Customers Pioneers in LocationIntelligence 1,200 End-users 300K Team members 100+
  • 5.
    The Complete Journey 1.Data 2. Enrichment 3. Analysis 4. Solutions 5. Integration
  • 6.
    The Complete Journey 1.Data 2. Enrichment 3. Analysis 4. Solutions 5. Integration
  • 7.
    Enrichment Augment any data withdemographic data from around the globe with easeData Observatory Develop robust ETL processes and update mechanisms so your data is always enriched Mastercard Human Mobility POI
  • 8.
    The Journey -Analysis Bring CARTO maps and data into your data science workflows and the Python data science ecosystem to work with Pandas, PySal,PyMC3, scikit-learn, etc. CARTOFrames Use the power of PostGIS and our APIs to productionalize analysis workflows in your CARTO platform. PostGIS by CARTO SQL API Python SDK
  • 9.
    John Snow’s mapof cholera cases in London 1854. Red circles indicate locations of cholera cases and blue circles indicate locations of water pumps. ………………………………………………………………………………………………………….………………….…...
  • 10.
    “Everything is relatedto everything else, but near things are more related than distant things.” (Tobler, 1970) ………………………………………………………………………………………………………….………………….…...
  • 11.
    Modelling dependence oncovariates and the spatial correlation structure ● Estimation of underlying model parameters ● Prediction at unsampled locations ● Change of support (downscaling/upscaling) ………………………………………………………………………………………………………….………………….…...
  • 12.
    Failure to includespatial dependence in your model can lead to biased statistical results and erroneous conclusions. How can CARTO help me with my spatial models? ➢ Types of spatial data ➢ Spatial modelling ➢ Demos ………………………………………………………………………………………………………….………………….…...
  • 14.
    ● GPS tracking ●Fixed measuring devices ● High resolution satellites Geostatistical data We are thinking of a continuous spatial field
  • 15.
    ● Census data ●Region-based counts ● Coarse resolution satellites Region-based data We are observing a discrete spatial field, but what are we thinking of?
  • 16.
    ● Census data ●Region-based counts ● Coarse resolution satellites Region-based data We are observing a discrete spatial field, but what are we thinking of?
  • 17.
    ● Locations ofoccurrences of some event ● Locations of trees ● UFO sightings Point patterns We are thinking of occurrences of events
  • 19.
    ● We needa complex function based on the coordinates to adequately describe the effect of the location ● Regression models using the location's coordinates as predictors do not work well! ● More natural to explicitly model the variations of the process considering that it may be similar at nearby locations ………………………………………………………………………………………………………….………………….…...
  • 20.
    What we aretrying to model (or the response variable) This is modelling! ………………………………………………………………………………………………………….………………….…...
  • 21.
    The mean structure e.g.some function of some covariates The residual (or what is not explained by the mean structure) What we are trying to model (or the response variable) ………………………………………………………………………………………………………….………………….…...
  • 22.
    But the numberof ways we could construct a model for the spatial process is unlimited! Spatially continuous models ➢ Gaussian processes (GP) Spatially discrete models ➢ Gaussian Markov Random Fields (GMRF) ………………………………………………………………………………………………………….………………….…...
  • 23.
    ➢ A GPis parameterized by a mean function and covariance function ➢ as ↑ then ↓ ➢ depends on some parameters e.g.: the exponential covariance: The joint distribution of a finite number of outputs is a Gaussian! ………………………………………………………………………………………………………….………………….…...
  • 24.
  • 25.
  • 26.
  • 27.
  • 28.
    ➢ How canwe properly account for the uncertainty in the spatial dependence structure? THINK BAYESIAN! DATA LEVEL (LIKELIHOOD) PROCESS LEVEL PRIOR LEVEL ………………………………………………………………………………………………………….………………….…...
  • 29.
    ➢ THE BIGPROBLEM: computations scale as O(N3 ), for more than a few thousand points this is intractable! Construct a DISCRETE APPROXIMATION of the continuous field Figure from Cameletti et al. (AStA, 2013) ………………………………………………………………………………………………………….………………….…...
  • 30.
    ➢ Based onneighbourhood structures 𝑖-th area first-order neighbours second-order neighbours ➢ Markov means conditional independence ………………………………………………………………………………………………………….………………….…...
  • 31.
    Under the Markovianproperty, the elements in the precision matrix (the inverse of the covariance) are non-zero only for neighbours ➢ Fast computations due to a sparse precision matrix! ➢ Difficult to construct reasonable dependence structures 0.1% of non-zero elements! ………………………………………………………………………………………………………….………………….…...
  • 32.
  • 33.
    ➢ Compare revenuesfrom each travel agency to market performance ➢ We can use data from credit cards from purchases in the travel sector ………………………………………………………………………………………………………….………………….…...
  • 34.
    Travel agencies Credit carddata ………………………………………………………………………………………………………….………………….…...
  • 35.
    ➢ Compare revenuesfrom each travel agency to market performance ➢ We can use data from credit cards from purchases in the travel sector ➢ BUT… credit card data get anonymized in many locations ………………………………………………………………………………………………………….………………….…...
  • 36.
    1 month ofdata 5 months of data 12 months of data ………………………………………………………………………………………………………….………………….…...
  • 37.
    ➢ Compare revenuesfrom each travel agency to market performance ➢ We can use data from credit cards from purchases in the travel sector ➢ BUT… credit card data get anonymized in many locations ………………………………………………………………………………………………………….………………….…... CAN WE PREDICT AT LOCATIONS WHERE THERE ARE NO DATA? R package: mgcv, Wood (2011, Journal of the Royal Statistical Society: Series B)
  • 38.
    CAN WE PREDICTAT LOCATIONS WHERE THERE ARE NO DATA? ➢ Compare revenues from each travel agency to market performance ➢ We can use data from credit cards from purchases in the travel sector ➢ BUT… credit card data get anonymized in many locations ………………………………………………………………………………………………………….………………….…... R package: mgcv, Wood (2011, Journal of the Royal Statistical Society: Series B)
  • 39.
    w/ GRMF smoothw/oGRMF smooth PREDICTED ORIGINAL ORIGINAL ………………………………………………………………………………………………………….………………….…...
  • 40.
  • 41.
  • 42.
  • 43.
    ➢ Upload yourdata to CARTO and viz it using CARTOframes First we need to define the aggregation or zoom level. At CARTO we use QuadKeys ………………………………………………………………………………………………………….………………….…...
  • 44.
    NUMBER OF TRANSACTIONSWHERE WE WANT TO PREDICT ➢ Upload your data to your CARTO account and plot it using CARTOframes ………………………………………………………………………………………………………….………………….…...
  • 45.
    ➢ Before modelling,enrich your data with CARTO DATA OBSERVATORY (DO) ………………………………………………………………………………………………………….………………….…...
  • 46.
    ➢ Before modelling,enrich your data with CARTO DATA OBSERVATORY (DO) ………………………………………………………………………………………………………….………………….…...
  • 47.
    ➢ Before modelling,enrich your data with CARTO DATA OBSERVATORY (DO) ………………………………………………………………………………………………………….………………….…...
  • 48.
    NUMBER OF TRANSACTIONSDATA WE WANT TO USE AS COVARIATES e.g. POPULATION ➢ Before modelling, viz with CARTOframes ………………………………………………………………………………………………………….………………….…...
  • 49.
    NUMBER OF TRANSACTIONSDATA WE WANT TO USE AS COVARIATES e.g. NUMBER OF FOOD POIs ➢ Before modelling, viz with CARTOframes ………………………………………………………………………………………………………….………………….…...
  • 50.
  • 51.
    PREDICTED NUMBER OFTRANSACTIONS (MEAN) NUMBER OF TRANSACTIONS ………………………………………………………………………………………………………….………………….…...
  • 52.
    PREDICTED NUMBER OFTRANSACTIONS (STANDARD DEVIATION) NUMBER OF TRANSACTIONS ………………………………………………………………………………………………………….………………….…...
  • 53.
    Population # POIfood # POI entertainment Income# POI transport # employees ………………………………………………………………………………………………………….………………….…...
  • 54.
    RANDOM SPATIAL EFFECT (MEAN) RANDOMSPATIAL EFFECT (STANDARD DEVIATION) SPATIAL DOMAIN ………………………………………………………………………………………………………….………………….…...
  • 55.
    PREDICTED NUMBER OFTRANSACTIONS (MEAN) ………………………………………………………………………………………………………….………………….…...
  • 56.
    ➢ Think carefullywhat is the problem you are trying to solve and get the right data at the right spatial resolution CARTO Data Observatory ………………………………………………………………………………………………………….………………….…...
  • 57.
    ➢ Think carefullywhat is the problem you are trying to solve and get the right data at the right spatial resolution ➢ Choose a scalable model and a flexible implementation CARTO Data Observatory ………………………………………………………………………………………………………….………………….…... CARTO Analysis Framework and API A Framework for provisioning, orchestrating, executing and monitoring of analyses (processes) An API to define, register, schedule and execute user-defined analysis written in virtually any language
  • 58.
    ➢ Think carefullywhat is the problem you are trying to solve and get the right data at the right spatial resolution ➢ Choose a scalable model and a flexible implementation ➢ The estimates we construct come from a complicated interaction of the model and the computational method: visualization (and other metrics) are essential CARTO Data Observatory ………………………………………………………………………………………………………….………………….…... CARTO Analysis Framework and API CARTOframes
  • 59.
    Request a demoat CARTO.COM Data Scientist // giulia@carto.com Content Marketing Manager // sisaac@carto.com