Mifty kit IN Salmiya (+918133066128) Abortion pills IN Salmiyah Cytotec pills
Artist Budget
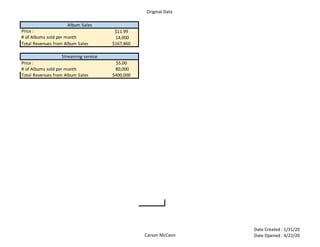
1. Original Data
Carson McCann
Date Created : 1/31/20
Date Opened : 4/22/20
$11.99
14,000
$167,860
Price : $5.00
# of Albums sold per month 80,000
Total Revenues from Album Sales $400,000
Album Sales
Total Revenues from Album Sales
Streaming service
# of Albums sold per month
Price :
2. Original Budget
Carson McCann
Date Created : 1/31/20
Date Opened : 4/22/20
Jan Feb Mar Apr May Jun Jul Aug Sep Oct Nov Dec Annual
Album Sales $167,860 $167,860 $167,860 $167,860 $167,860 $167,860 $167,860 $167,860 $167,860 $167,860 $167,860 $167,860 $2,014,320
Streaming service $400,000 $400,000 $400,000 $400,000 $400,000 $400,000 $400,000 $400,000 $400,000 $400,000 $400,000 $400,000 $4,800,000
Subtotal Revenues $567,860 $567,860 $567,860 $567,860 $567,860 $567,860 $567,860 $567,860 $567,860 $567,860 $567,860 $567,860 $6,814,320
Manager Cut $56,786 $56,786 $56,786 $56,786 $56,786 $56,786 $56,786 $56,786 $56,786 $56,786 $56,786 $56,786 $681,432
Lawyer $0 $500 $0 $0 $0 $0 $0 $500 $0 $0 $0 $0 $0
Building Bills $20,000 $20,000 $20,000 $20,000 $20,000 $20,000 $20,000 $20,000 $20,000 $20,000 $20,000 $20,000 $240,000
Development $60 $60 $60 $60 $60 $60 $60 $60 $60 $60 $60 $60 $720
Marketing $80,000 $80,000 $100,000 $80,000 $80,000 $80,000 $80,000 $80,000 $80,000 $80,000 $100,000 $200,000 $1,120,000
Subtotal Expenses $156,846 $157,346 $176,846 $156,846 $156,846 $156,846 $156,846 $157,346 $156,846 $156,846 $176,846 $276,846 $2,043,152
Profits $411,014 $410,514 $391,014 $411,014 $411,014 $411,014 $411,014 $410,514 $411,014 $411,014 $391,014 $291,014 $4,771,168
# Of Expenses 5
Average Profits Per Month $397,597
Revenues
Expenses
3. Revised Budget
Carson McCann
Date Created : 1/31/20
Date Opened : 4/22/20
Jan Feb Mar Apr May Jun Jul Aug Sep Oct Nov Dec Annual
Album Sales $167,860 $168,699 $169,543 $170,391 $171,242 $172,099 $172,959 $173,824 $174,693 $175,567 $176,444 $177,327 $2,070,647
Streaming service $400,000 $400,000 $400,000 $400,000 $400,000 $400,000 $400,000 $400,000 $400,000 $400,000 $400,000 $400,000 $4,800,000
Subtotal Revenues $567,860 $568,699 $569,543 $570,391 $571,242 $572,099 $572,959 $573,824 $574,693 $575,567 $576,444 $577,327 $6,870,647
Manager Cut $56,786 $56,870 $56,954 $57,039 $57,124 $57,210 $57,296 $57,382 $57,469 $57,557 $57,644 $57,733 $687,065
Lawyer $0 $500 $0 $0 $0 $0 $0 $500 $0 $0 $0 $0 $1,000
Building Bills $20,000 $20,000 $20,000 $20,000 $20,000 $20,000 $20,000 $20,000 $20,000 $20,000 $20,000 $20,000 $240,000
Development $60 $60 $60 $60 $60 $60 $60 $60 $60 $60 $60 $60 $720
Marketing $80,000 $80,000 $100,000 $80,000 $80,000 $80,000 $80,000 $80,000 $80,000 $80,000 $100,000 $200,000 $1,120,000
Subtotal Expenses $156,846 $157,430 $177,014 $157,099 $157,184 $157,270 $157,356 $157,942 $157,529 $157,617 $177,704 $277,793 $2,048,785
Profits $411,014 $411,269 $392,529 $413,291 $414,058 $414,829 $415,603 $415,882 $417,164 $417,950 $398,740 $299,534 $4,821,863
0.50%
0.50% 0.50% 0.50% 0.50% 0.50% 0.50% 0.50% 0.50% 0.50% 0.50%
Revenues
Expenses
Percentage Increase Sales Per Month
Percentage Change Month to Month
$411,014 $411,269
$392,529
$413,291 $414,058 $414,829 $415,603 $415,882 $417,164 $417,950
$398,740
$299,534
$0
$50,000
$100,000
$150,000
$200,000
$250,000
$300,000
$350,000
$400,000
$450,000
Jan Feb Mar Apr May Jun Jul Aug Sep Oct Nov Dec
Profit
Month
October Made the Most Money For the Year