1. CARLY S. QUEEN
GIS TRANSIT PLANNING TOOLS
CP 6521. ADVANCED GIS
PROFESSOR. MARTY SUNG
SCHOOL OF CITY AND REGIONAL PLANNING
GEORGIA INSTITUTE OF TECHNOLOGY
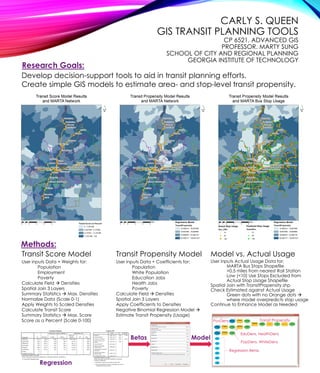
Transit Score Model
User inputs Data + Weights for:
Population
Employment
Poverty
Calculate Field Densities
Spatial Join 3 Layers
Summary Statistics Max. Densities
Normalize Data (Scale 0-1)
Apply Weights to Scaled Densities
Calculate Transit Score
Summary Statistics Max. Score
Score as a Percent (Scale 0-100)
Transit Propensity Model
User inputs Data + Coefficients for:
Population
White Population
Education Jobs
Health Jobs
Poverty
Calculate Field Densities
Spatial Join 3 Layers
Apply Coefficients to Densities
Negative Binomial Regression Model
Estimate Transit Propensity (Usage)
Model vs. Actual Usage
User inputs Actual Usage Data for:
MARTA Bus Stops Shapefile
>0.5 miles from nearest Rail Station
Low (<10) Use Stops Excluded from
Actual Stop Usage Shapefile
Spatial Join with TransitPropensity.shp
Check Estimated against Actual Usage
Green dots with no Orange dots
where model overpredicts stop usage
Continue to Enhance Model as Needed
Develop decision-support tools to aid in transit planning efforts.
Create simple GIS models to estimate area- and stop-level transit propensity.
Regression Betas
PopDens, WhiteDens
EduDens, HealthDens
PovDens Transit Propensity