More Related Content
Similar to Attachment 5_Wheatstone Type 2_6th Aug 2012
Similar to Attachment 5_Wheatstone Type 2_6th Aug 2012 (20)
More from CangTo Cheah (20)
Attachment 5_Wheatstone Type 2_6th Aug 2012
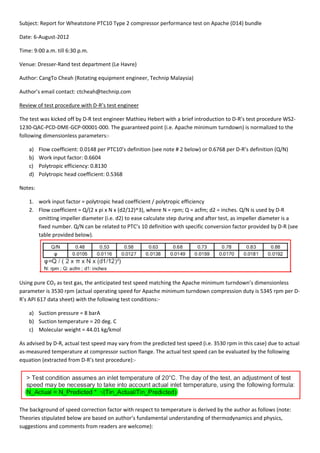
- 2. From thermodynamics perspective, energy can be related to temperature; Energy = Cp x temperature. Assuming
constant Cp due to small change from Tpredicted to Tactual, energy is therefore directly proportional to temperature, i.e.
Energy ∝ T.
And in term of Newtonian physics: Kinetic energy added to the gas at impeller exit channel can be related by
Energykinetic = 0.5 x mass x velocity2
. (0.5 can be omitted as it is a numerical constant, mass can also be eliminated
from the equation since mass flow within the test loop shall consider constant, i.e. conservation of mass).
Rotational speed N (in rpm) can be related to impeller tip velocity by the following formula, N = 60 x velocity / (pi x
diameter); 60, pi and diameter can be omitted from the equation since these are mere numerical constants, then
Energykinetic ∝ N2
.
By equating equations of thermodynamics and physics, temperature change is therefore directly proportional to the
squared of rotational speed, i.e. T ∝ N2
. And T1/T2 = (N1/N2)2
.
For example, if the actual temperature at compressor suction flange is measured at 23 deg. C, then actual test speed
shall be adjusted to: Nactual = square root ((273.15+23)/(273.15+20)) x 3530 rpm = 3548 rpm.
There will be 5 (five) test points covering from the Stonewall to Surge limit of compressor at test speed (or 100%
similarity speed per D‐R’s terminology), please refer to snap shot (extract from D‐R’s test agenda) provided below.
For 100% similarity speed, first point will be started at the Stonewall limit (i.e. point at the right of performance
curve), gradually progress towards the guaranteed point on the left by reducing inlet volume flow rate (manually
closing of suction throttling valve), and finally reaching the surge limit at point 5.
- 8. Polytropic head (or discharge pressure) requirement: Discharge pressure of 15.50 barA can be achieved by increasing
compressor speed from 3530 rpm to 3569 rpm. Derivation as follows:‐
Ntest is numerically solved using Newton’s method:‐
Equating Mu: 0.48793 + 0.55623 (Qtest / Ntest) – 0.74771 (Qtest / Ntest)^2 = 38418 / (3.142 x Ntest x Deq / 60)^2 [where:
Qtest = 2389 ft^3/minute and Deq = 1.4474 meters], which is further simplified to: 0 = 0.48793 + (1328.833 / Ntest) –
(10956408 / Ntest ^2)
Note: Deq (equivalent impeller diameter) is defined as square root (D1
2
+ D2
2
+ D3
2
+ D4
2
+ D5
2
+ D6
2
+ …), it is used to
calculate equivalent tip speed in order to evaluate overall polytropic head required for a compression duty.
To solve the equation, Newton’s method proceeds as follows.
1. Consider the following equation in one unknown: 0 = 0.48793 + (1328.833/Ntest) – (10956408/Ntest^2)
2. To apply Newton’s method to the solution of this equation, it is best to re‐write the equation in terms of
residual, e, where: e = 0.48793 + (1328.833/Ntest) – (10956408/Ntest^2)
3. Newton’s method requires an estimate of the total derivative of the residual, J. For this equation, the
derivative is: J = de/dNtest = 2 x 10956408/(Ntest^3) – 1328.833/(Ntest^2)
4. An initial guess is made for Ntest, e.g. Ntest = 3000.
5. The value of e is evaluated using the guess value for Ntest. With Ntest = 3000, e = ‐0.286504333.
6. The derivate of J is evaluated. With Ntest = 3000, J = 0.000663938.
7. The change to the guess value for Ntest, i.e. delta Ntest is calculated by solving J x delta Ntest = e. In this
example, delta Ntest is ‐431.522939151.
8. A better value for Ntest is then obtained as Ntest – delta Ntest. In this case, the improved value for Ntest is
3431.522939 (which results in e = ‐0.055279947).
Number of
iteration
1 2 3 4 5 6
Ntest 3000 3431.522939 3560.246012 3568.690074 3568.723019 3568.723019839
e ‐0.286504333 ‐0.055279947 ‐0.003215001 ‐0.000012447 0.000000000 0.000000000
J 0.000663938 0.000429449 0.000380741 0.000377798 0.000377786 0.000377786
delta Ntest ‐431.52293915 ‐128.72307249 ‐8.444062559 ‐0.032945134 ‐0.000000498 0.000000000
- 10. For Apache minimum turndown; the predicted operating speed is 5345 rpm and adjusted speed according to test
curves is calculated at 5405 rpm:‐
Equating Mu: 0.48793 + 0.55623 (Qtest / Ntest) – 0.74771 (Qtest / Ntest)^2 = 88081 / (3.142 x Ntest x Deq / 60)^2 [where:
Qtest = 3617 ft^3/minute and Deq = 1.4474 meters], which is further simplified to: 0 = 0.48793 + (2011.88391 / Ntest) –
(25117907.5109 / Ntest ^2)
To solve the equation, Newton’s method proceeds as follows.
1. Consider the following equation in one unknown: 0 = 0.48793 + (2011.88391/Ntest) – (25117907.5109/Ntest^2)
2. To apply Newton’s method to the solution of this equation, it is best to re‐write the equation in terms of
residual, e, where: e = (2011.88391/Ntest) – (25117907.5109/Ntest^2)
3. Newton’s method requires an estimate of the total derivative of the residual, J. For this equation, the
derivative is: J = de/dNtest = 2 x 25117907.5109/(Ntest^3) – 2011.88391/(Ntest^2)
4. An initial guess is made for Ntest, e.g. Ntest = 4000.
5. The value of e is evaluated using the guess value for Ntest. With Ntest = 4000, e = ‐0.578968242.
6. The derivate of J is evaluated. With Ntest = 4000, J = 0.000659192.
7. The change to the guess value for Ntest, i.e. delta Ntest is calculated by solving J x delta Ntest = e. In this
example, delta Ntest is ‐878.3000404.
8. A better value for Ntest is then obtained as Ntest – delta Ntest. In this case, the improved value for Ntest is
4878.30004 (which results in e = ‐0.155126371).
Number of
iteration
1 2 3 4 5 6
Ntest 4000 4878.30004 5323.834711 5401.616779 5403.526933 5403.52804
e ‐0.578968242 ‐0.155126371 ‐0.020374001 ‐0.000477139 0.000000276 0.000000000
J 0.000659192 0.00034818 0.000261937 0.000249791 0.000249502 0.000249501
delta Ntest ‐878.3000404 ‐445.5346709 ‐77.78206763 ‐1.91015418 ‐0.001107191 0.000000000
- 11. Results from the above calculation for Apache minimum turndown are transferred into Nh and Mu curves:‐
Shaft power requirement: Power = mass flow rate x polytropic head / polytropic efficiency; per D‐R’s API 617 data
sheet, the predicted gas power for Apache minimum turndown is 11340 kW. The gas power calculation based on as‐
tested Mu and Nh curves as follow: 104.6333 kg/s x 88081 J/kg / 0.8191 = 11251 kW (at: Mu = 0.5251, Q/N = 0.6693
and Nh = 0.8191), i.e. calculated gas power based on test curves is 88 kW (0.7793%) less than predicted gas power,
the reduction of gas power is due to improved polytropic efficiency (with test curves) at required polytropic head.
Conclusion
The reduction of polytropic head coefficient causes the following:‐
a) Power (energy) saving of 88 kW due to improved efficiency (i.e. from 0.8120 to 0.8191) occurs at lower flow
coefficient (or Q/N).
b) Increased operating speed (rpm) of 60 rpm (or 1.12%), i.e. from 5345 rpm to 5404 rpm. This is deemed
acceptable as the design speed of high speed power turbine (of PGT25+G4) is rated at 6100 rpm (and
maximum continuous operating speed of PGT25+G4 is 6405 rpm).
Based on dimensionless parameters obtained from the test (i.e. Nh, Wi and Mu), D‐R will then develop as‐tested
compressor performance curves, namely polytropic head vs. actual inlet volume flow rate, discharge pressure vs.
inlet volume flow rate, polytropic efficiency vs. actual inlet volume flow rate.