More Related Content Similar to Attachment 4_How to trim LP stage flow limits for 2-stage compressions Similar to Attachment 4_How to trim LP stage flow limits for 2-stage compressions (20) More from CangTo Cheah (20) 1. ©2007 Dresser-Rand Company
Contract / Sales File #
DR Reference File:
DR Curve Reference:
Plotted By:
Date Created:
Revision:
Revision Date:
MW
Zs
Zavg
pKavg
Ps
Pd
Ts
Td
Flow
Basis of Curves Comments
Volume Flow, m³/min
PolytropicHead,kJ/kg
350 400 450 500 550 600 650 700 750 800 850
25
50
75
100
125
150
175
105.00 %
100.00 %
95.00 %
90.00 %
85.00 %
80.00 %
75.01 %
70.00 %
Polytropic Head Vs Volume Flow
Volume Flow, m³/min
PolytropicEfficiency
350 400 450 500 550 600 650 700 750 800 850
0.675
0.700
0.725
0.750
0.775
0.800
0.825
0.850
0.875
105.00%
100.00%
95.00%
90.00%
85.00%
80.00%
75.01%
70.00%
Polytropic Efficiency Vs Volume Flow
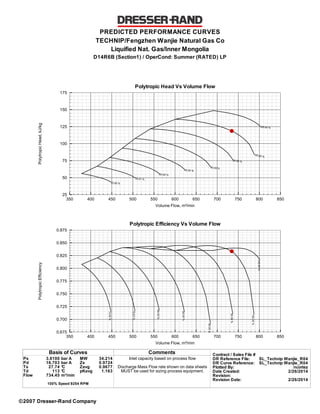
PREDICTED PERFORMANCE CURVES
TECHNIP/Fengzhen Wanjie Natural Gas Co
Liquified Nat. Gas/Inner Mongolia
D14R6B (Section1) / OperCond: Summer (RATED) LP
3.8100
16.703
27.74
113
734.45
bar A
bar A
°C
°C
m³/min
34.214
0.9724
0.9677
1.163
100% Speed 9254 RPM
Inlet capacity based on process flow
Discharge Mass Flow rate shown on data sheets
MUST be used for sizing process equipment.
-7SL_Technip Wanjie_R04
-7SL_Technip Wanjie_R04
ncortez
2/26/2014
2/26/2014
For the sake of extended operating flexibility (i.e. greater flow range), most of the centrifugal compressions in the oil and
gas industries are designed (aero-dynamically and rotor-dynamically) to operate in between 70% to 105% of design speed.
The minimum speed (70% of design speed) curve is achievable in most of single stage machine (aero and rotor-
dynamically), however it may not be aero-dynamically feasible for multi-stage compressions.
To illustrate this idea, consider point "A" and "B" in the Head vs. Volume flow curve marked in this page. Discharge volume
flow rates are calculated as follows (based on suction pressure 3.81 barA and suction temperature 27.74 deg. C):-
1) Point A: Discharge volume flow rate = 11141 m^3/hr (inter-cooled at 37.86 deg. C)
2) Point B: Discharge volume flow rate = 15514 m^3/hr (inter-cooled at 37.86 deg. C)
Transferring these volume flow rates into HP stage (see next page), it can be seen that these rates are located way beyond
the choke limit of HP compression stage.
Point "B"
Point "A"
2. ©2007 Dresser-Rand Company
Contract / Sales File #
DR Reference File:
DR Curve Reference:
Plotted By:
Date Created:
Revision:
Revision Date:
MW
Zs
Zavg
pKavg
Ps
Pd
Ts
Td
Flow
Basis of Curves Comments
Volume Flow, m³/min
PolytropicHead,kJ/kg
60 70 80 90 100 110 120 130 140 150 160 170 180 190 200
20
30
40
50
60
70
80
90
100
110
105.00 %
100.00 %
95.00 %
90.00 %
85.00 %
80.00 %
75.01 %
70.00 %
Polytropic Head Vs Volume Flow
Volume Flow, m³/min
PolytropicEfficiency
60 70 80 90 100 110 120 130 140 150 160 170 180 190 200
0.700
0.725
0.750
0.775
0.800
0.825
0.850
0.875
105.00%
100.00%
95.00%
90.00%
85.00%
80.00%
75.01%
70.00%
Polytropic Efficiency Vs Volume Flow
PREDICTED PERFORMANCE CURVES
TECHNIP/Fengzhen Wanjie Natural Gas Co
Liquified Nat. Gas/Inner Mongolia
D14R6B (Section2) / OperCond: Summer (RATED) HP
16.103
44.722
37.86
104
153.38
bar A
bar A
°C
°C
m³/min
31.878
0.9060
0.8936
1.188
100% Speed 9254 RPM
Inlet capacity based on process flow
Discharge Mass Flow rate shown on data sheets
MUST be used for sizing process equipment.
-7SL_Technip Wanjie_R04
-7SL_Technip Wanjie_R04
ncortez
2/26/2014
2/26/2014
11141 m^3/hr (or 185.68 m^3/min)
15514 m^3/hr (or 258.57 m^3/min)
4. ©2007 Dresser-Rand Company
Contract / Sales File #
DR Reference File:
DR Curve Reference:
Plotted By:
Date Created:
Revision:
Revision Date:
MW
Zs
Zavg
pKavg
Ps
Pd
Ts
Td
Flow
Basis of Curves Comments
Volume Flow, m³/min
DischargePressure,barA
60 70 80 90 100 110 120 130 140 150 160 170 180 190 200
20
25
30
35
40
45
50
55
60
105.00%
100.00%
95.00%
90.00%
85.00
%
80.00
%75.01
%70.00 %
Discharge Pressure Vs Volume Flow
Volume Flow, m³/min
BrakePower,kW@Ps=16.1bar
POWER=PWRcrvXPs/16.1bar
60 70 80 90 100 110 120 130 140 150 160 170 180 190 200
750
1500
2250
3000
3750
4500
5250
6000
6750
7500
105.00%
100.00%
95.00 %
90.00 %
85.00
%
80.00
%
75.01%
70.00%
Brake Power Vs Volume Flow
PREDICTED PERFORMANCE CURVES
TECHNIP/Fengzhen Wanjie Natural Gas Co
Liquified Nat. Gas/Inner Mongolia
D14R6B (Section2) / OperCond: Summer (RATED) HP
16.103
44.722
37.86
104
153.38
bar A
bar A
°C
°C
m³/min
31.878
0.9060
0.8936
1.188
100% Speed 9254 RPM
Inlet capacity based on process flow
Discharge Mass Flow rate shown on data sheets
MUST be used for sizing process equipment.
-7SL_Technip Wanjie_R04
-7SL_Technip Wanjie_R04
ncortez
2/26/2014
2/26/2014
6425 m^3/hr
7084 m^3/hr
7774 m^3/hr 8493 m^3/hr
9232 m^3/hr
10009 m^3/hr
10727 m^3/hr
11395 m^3/hr
4489 m^3/hr
4862 m^3/hr
5235 m^3/hr
5609 m^3/hr
5982 m^3/hr 6383 m^3/hr
6787 m^3/hr
7200 m^3/hr
Step2:
Transfer both surge and choke limits of second stage in "Discharge volume flow rate vs. inlet
volume flow rate" curves derived earlier (see next page).