SlideShare a Scribd company logo
1 of 18
LEVELS OR SCALES OF MEASUREMENT
Level/Scale Characteristics Example
1. Nominal Nominal variables (also called categorical
variables) can be placed into
categories. They don’t have a numeric
value and so cannot be added, subtracted,
divided or multiplied. They also have no
order
No. reflected at the back
shirts of the athletes
2. Ordinal The ordinal scale contains things that you
can place in order.
Ranks
3. Interval An interval scale has ordered numbers with
meaningful divisions.
Temperature is on the
interval scale: a difference
of 10 degrees between 90
and 100 means the same as
10 degrees between 150
and 160
4. Ratio Has all thecharacteristics of the interval
scale except that it has an absolute zero
point
Height, weight
*a zero weight means no
weight at all
SHAPES, DISTRIBUTIONS AND DISPERSION OF
DATA
1. SYMMETRICALLY SHAPED TEST SCORE
DISTRIBUTION
A. Normal Distribution or Bell Shaped Curve
Frequencies
Test Scores
SHAPES, DISTRIBUTIONS AND DISPERSION OF
DATA
1. SYMMETRICALLY SHAPED TEST SCORE
DISTRIBUTION
A. Rectangular Distribution
Test Scores
Frequencies
SHAPES, DISTRIBUTIONS AND DISPERSION OF
DATA
1. SYMMETRICALLY SHAPED TEST
SCORE DISTRIBUTION
A. U-shaped Curve
Test Scores
Frequencies
SHAPES, DISTRIBUTIONS AND DISPERSION OF
DATA
2. SKEWED DISTRIBUTIONS OF TEST SCORES
A. Positively Skewed Distribution
B. Negatively Skewed Distribution
Scores
No.
of
Students
Scores
What is Variability in Statistics?
Variability (also called spread
or dispersion) refers to how spread out a
set of data is. Variability gives you a way to
describe how much data sets vary and
allows you to use statistics to compare
your data to other sets of data.
The four main ways to describe
variability in a data set are:
• RANGE
• INTERQUARTILE RANGE
• VARIANCE
• STANDARD DEVIATION
MEASURES OF VARIABILITY
A. Range
B. Standard deviation
C. Quartile Deviation or Semi-
interquartile Range
DESCRIPTIVE STATISTICS
• The first step in data analysis is to describe or
summarize the data using descriptive
statistics.
What is Variability in Statistics?
Variability (also called spread
or dispersion) refers to how spread out a
set of data is. Variability gives you a way to
describe how much data sets vary and
allows you to use statistics to compare
your data to other sets of data.
I. MEASURES OF CENTRAL TENDENCY
-numerical values which describe the average or
typical performance of a given groups in terms
of certain attributes.
-basis in determining whether the group is
performing better or poorer than the other
groups.
Descriptive Satistics When to use and
characteristics
a. Mean Arithmetic average, use when
the distribution is
normal/symmetrical or bell
shaped. Most reliable/stable
b. Median Point in a distribution above
and below which are 50% of
the scores/ cases; medpoint of
a distribution; use when the
distribution is skewed
c. Mode Most frequent/ common score
in a distribution
II. MEASURES OF VARIABILITY
- Indicate or describe how spread the scores are.
The larger the measures of variability the
more spread the scores are and the group is
said to be heterogeneous; the smaller the
measure of variability the less spread the
scores are, the group is said to be
homogenous.
MEASURES OF VARIABILITY
A. Range-difference between the highest and lowest
score; counterpart of the mode is also reliable and
unstable
B. Standard deviation-The counterpart of the mean,
used also when the distribution is normal or
symmetrical; Reliable/stable and widely used
C. Quartile Deviation or Semi-interquartile Range-
Defined as one- half of the difference between quartile
3(75th percentile) and quartile 1 (25th percentile) in a
distribution; Counterpart of the median; Used when
the distribution is skewed
III. Measures of Relationship
-describe the degree of relationship or
correlation between twovariables (academic
achievement and motivation). It is express in
terms of correlation coefficient from -1 to 0 to
10.
a. Pearson r
b. Spearman-rank-
order Correlation or
Spearman Rho
IV. Measure of Relative Position
-indicate where the score is in relation to all
other scores in the distribution; they make it
possible to compare the performance of an
individual in two or more different tests.
a. Percentile Ranks
b. Standard Scores
c. Stanine Scores
d. T-Scores

More Related Content

Similar to LEVELS OR SCALES OF MEASUREMENT.pptx

Biostatistics mean median mode unit 1.pptx
Biostatistics mean median mode unit 1.pptxBiostatistics mean median mode unit 1.pptx
Biostatistics mean median mode unit 1.pptxSailajaReddyGunnam
 
Medical Statistics Part-I:Descriptive statistics
Medical Statistics Part-I:Descriptive statisticsMedical Statistics Part-I:Descriptive statistics
Medical Statistics Part-I:Descriptive statisticsRamachandra Barik
 
Frequency Measures for Healthcare Professioanls
Frequency Measures for Healthcare ProfessioanlsFrequency Measures for Healthcare Professioanls
Frequency Measures for Healthcare Professioanlsalberpaules
 
Data measurement techniques
Data measurement techniquesData measurement techniques
Data measurement techniquesJanki Pandya
 
measure of dispersion.pptx
measure of dispersion.pptxmeasure of dispersion.pptx
measure of dispersion.pptxSoujanyaLk1
 
Measurement and instrumentaion
Measurement and instrumentaionMeasurement and instrumentaion
Measurement and instrumentaionahmedabbas1121
 
Research methodology Chapter 6
Research methodology Chapter 6Research methodology Chapter 6
Research methodology Chapter 6Pulchowk Campus
 
EDUCATIONAL STATISTICS_Unit_I.ppt
EDUCATIONAL STATISTICS_Unit_I.pptEDUCATIONAL STATISTICS_Unit_I.ppt
EDUCATIONAL STATISTICS_Unit_I.pptSasi Kumar
 
Week 7 a statistics
Week 7 a statisticsWeek 7 a statistics
Week 7 a statisticswawaaa789
 
Chapter 11 quantitative data
Chapter 11 quantitative dataChapter 11 quantitative data
Chapter 11 quantitative datau59
 
Measurement & scaling ,Research methodology
    Measurement & scaling ,Research methodology    Measurement & scaling ,Research methodology
Measurement & scaling ,Research methodologySONA SEBASTIAN
 
FREQUENCY DISTRIBUTION.pptx
FREQUENCY DISTRIBUTION.pptxFREQUENCY DISTRIBUTION.pptx
FREQUENCY DISTRIBUTION.pptxSreeLatha98
 
Business statistics
Business statisticsBusiness statistics
Business statisticsRavi Prakash
 
LESSON-8-ANALYSIS-INTERPRETATION-AND-USE-OF-TEST-DATA.pptx
LESSON-8-ANALYSIS-INTERPRETATION-AND-USE-OF-TEST-DATA.pptxLESSON-8-ANALYSIS-INTERPRETATION-AND-USE-OF-TEST-DATA.pptx
LESSON-8-ANALYSIS-INTERPRETATION-AND-USE-OF-TEST-DATA.pptxMarjoriAnneDelosReye
 
Types of Data-Introduction.pptx
Types of Data-Introduction.pptxTypes of Data-Introduction.pptx
Types of Data-Introduction.pptxAnusuya123
 
measurementofscales-140430001245-phpapp02.pptx
measurementofscales-140430001245-phpapp02.pptxmeasurementofscales-140430001245-phpapp02.pptx
measurementofscales-140430001245-phpapp02.pptxanitha764188
 

Similar to LEVELS OR SCALES OF MEASUREMENT.pptx (20)

Biostatistics mean median mode unit 1.pptx
Biostatistics mean median mode unit 1.pptxBiostatistics mean median mode unit 1.pptx
Biostatistics mean median mode unit 1.pptx
 
Medical Statistics Part-I:Descriptive statistics
Medical Statistics Part-I:Descriptive statisticsMedical Statistics Part-I:Descriptive statistics
Medical Statistics Part-I:Descriptive statistics
 
Frequency Measures for Healthcare Professioanls
Frequency Measures for Healthcare ProfessioanlsFrequency Measures for Healthcare Professioanls
Frequency Measures for Healthcare Professioanls
 
Data measurement techniques
Data measurement techniquesData measurement techniques
Data measurement techniques
 
measure of dispersion.pptx
measure of dispersion.pptxmeasure of dispersion.pptx
measure of dispersion.pptx
 
Measurement and instrumentaion
Measurement and instrumentaionMeasurement and instrumentaion
Measurement and instrumentaion
 
Research methodology Chapter 6
Research methodology Chapter 6Research methodology Chapter 6
Research methodology Chapter 6
 
1 introduction to psychological statistics
1 introduction to psychological statistics1 introduction to psychological statistics
1 introduction to psychological statistics
 
Spring 2014 chapter 1
Spring 2014 chapter 1Spring 2014 chapter 1
Spring 2014 chapter 1
 
Measurment scales
Measurment scalesMeasurment scales
Measurment scales
 
EDUCATIONAL STATISTICS_Unit_I.ppt
EDUCATIONAL STATISTICS_Unit_I.pptEDUCATIONAL STATISTICS_Unit_I.ppt
EDUCATIONAL STATISTICS_Unit_I.ppt
 
Week 7 a statistics
Week 7 a statisticsWeek 7 a statistics
Week 7 a statistics
 
Chapter 11 quantitative data
Chapter 11 quantitative dataChapter 11 quantitative data
Chapter 11 quantitative data
 
Measurement & scaling ,Research methodology
    Measurement & scaling ,Research methodology    Measurement & scaling ,Research methodology
Measurement & scaling ,Research methodology
 
FREQUENCY DISTRIBUTION.pptx
FREQUENCY DISTRIBUTION.pptxFREQUENCY DISTRIBUTION.pptx
FREQUENCY DISTRIBUTION.pptx
 
Business statistics
Business statisticsBusiness statistics
Business statistics
 
LESSON-8-ANALYSIS-INTERPRETATION-AND-USE-OF-TEST-DATA.pptx
LESSON-8-ANALYSIS-INTERPRETATION-AND-USE-OF-TEST-DATA.pptxLESSON-8-ANALYSIS-INTERPRETATION-AND-USE-OF-TEST-DATA.pptx
LESSON-8-ANALYSIS-INTERPRETATION-AND-USE-OF-TEST-DATA.pptx
 
Types of Data-Introduction.pptx
Types of Data-Introduction.pptxTypes of Data-Introduction.pptx
Types of Data-Introduction.pptx
 
Chapter_1_Lecture.pptx
Chapter_1_Lecture.pptxChapter_1_Lecture.pptx
Chapter_1_Lecture.pptx
 
measurementofscales-140430001245-phpapp02.pptx
measurementofscales-140430001245-phpapp02.pptxmeasurementofscales-140430001245-phpapp02.pptx
measurementofscales-140430001245-phpapp02.pptx
 

More from CVCLSAbegailTeodoro

More from CVCLSAbegailTeodoro (7)

BROKEN VESSELS.pptx
BROKEN VESSELS.pptxBROKEN VESSELS.pptx
BROKEN VESSELS.pptx
 
Suffering—God’s Goodness and God’s Power.pptx
Suffering—God’s Goodness and God’s Power.pptxSuffering—God’s Goodness and God’s Power.pptx
Suffering—God’s Goodness and God’s Power.pptx
 
The Bread of Salt.pptx
The Bread of Salt.pptxThe Bread of Salt.pptx
The Bread of Salt.pptx
 
Speech and Stage Art report.ppt
Speech and Stage Art report.pptSpeech and Stage Art report.ppt
Speech and Stage Art report.ppt
 
MeanMedianMode.ppt
MeanMedianMode.pptMeanMedianMode.ppt
MeanMedianMode.ppt
 
collab-04.pptx
collab-04.pptxcollab-04.pptx
collab-04.pptx
 
PPT for Final DEmo.pptx
PPT for Final DEmo.pptxPPT for Final DEmo.pptx
PPT for Final DEmo.pptx
 

Recently uploaded

APM Welcome, APM North West Network Conference, Synergies Across Sectors
APM Welcome, APM North West Network Conference, Synergies Across SectorsAPM Welcome, APM North West Network Conference, Synergies Across Sectors
APM Welcome, APM North West Network Conference, Synergies Across SectorsAssociation for Project Management
 
1029-Danh muc Sach Giao Khoa khoi 6.pdf
1029-Danh muc Sach Giao Khoa khoi  6.pdf1029-Danh muc Sach Giao Khoa khoi  6.pdf
1029-Danh muc Sach Giao Khoa khoi 6.pdfQucHHunhnh
 
Basic Civil Engineering first year Notes- Chapter 4 Building.pptx
Basic Civil Engineering first year Notes- Chapter 4 Building.pptxBasic Civil Engineering first year Notes- Chapter 4 Building.pptx
Basic Civil Engineering first year Notes- Chapter 4 Building.pptxDenish Jangid
 
Advanced Views - Calendar View in Odoo 17
Advanced Views - Calendar View in Odoo 17Advanced Views - Calendar View in Odoo 17
Advanced Views - Calendar View in Odoo 17Celine George
 
Class 11th Physics NEET formula sheet pdf
Class 11th Physics NEET formula sheet pdfClass 11th Physics NEET formula sheet pdf
Class 11th Physics NEET formula sheet pdfAyushMahapatra5
 
SECOND SEMESTER TOPIC COVERAGE SY 2023-2024 Trends, Networks, and Critical Th...
SECOND SEMESTER TOPIC COVERAGE SY 2023-2024 Trends, Networks, and Critical Th...SECOND SEMESTER TOPIC COVERAGE SY 2023-2024 Trends, Networks, and Critical Th...
SECOND SEMESTER TOPIC COVERAGE SY 2023-2024 Trends, Networks, and Critical Th...KokoStevan
 
Presentation by Andreas Schleicher Tackling the School Absenteeism Crisis 30 ...
Presentation by Andreas Schleicher Tackling the School Absenteeism Crisis 30 ...Presentation by Andreas Schleicher Tackling the School Absenteeism Crisis 30 ...
Presentation by Andreas Schleicher Tackling the School Absenteeism Crisis 30 ...EduSkills OECD
 
Key note speaker Neum_Admir Softic_ENG.pdf
Key note speaker Neum_Admir Softic_ENG.pdfKey note speaker Neum_Admir Softic_ENG.pdf
Key note speaker Neum_Admir Softic_ENG.pdfAdmir Softic
 
SOCIAL AND HISTORICAL CONTEXT - LFTVD.pptx
SOCIAL AND HISTORICAL CONTEXT - LFTVD.pptxSOCIAL AND HISTORICAL CONTEXT - LFTVD.pptx
SOCIAL AND HISTORICAL CONTEXT - LFTVD.pptxiammrhaywood
 
psychiatric nursing HISTORY COLLECTION .docx
psychiatric  nursing HISTORY  COLLECTION  .docxpsychiatric  nursing HISTORY  COLLECTION  .docx
psychiatric nursing HISTORY COLLECTION .docxPoojaSen20
 
PROCESS RECORDING FORMAT.docx
PROCESS      RECORDING        FORMAT.docxPROCESS      RECORDING        FORMAT.docx
PROCESS RECORDING FORMAT.docxPoojaSen20
 
Application orientated numerical on hev.ppt
Application orientated numerical on hev.pptApplication orientated numerical on hev.ppt
Application orientated numerical on hev.pptRamjanShidvankar
 
Unit-IV- Pharma. Marketing Channels.pptx
Unit-IV- Pharma. Marketing Channels.pptxUnit-IV- Pharma. Marketing Channels.pptx
Unit-IV- Pharma. Marketing Channels.pptxVishalSingh1417
 
Seal of Good Local Governance (SGLG) 2024Final.pptx
Seal of Good Local Governance (SGLG) 2024Final.pptxSeal of Good Local Governance (SGLG) 2024Final.pptx
Seal of Good Local Governance (SGLG) 2024Final.pptxnegromaestrong
 
Mixin Classes in Odoo 17 How to Extend Models Using Mixin Classes
Mixin Classes in Odoo 17  How to Extend Models Using Mixin ClassesMixin Classes in Odoo 17  How to Extend Models Using Mixin Classes
Mixin Classes in Odoo 17 How to Extend Models Using Mixin ClassesCeline George
 
Explore beautiful and ugly buildings. Mathematics helps us create beautiful d...
Explore beautiful and ugly buildings. Mathematics helps us create beautiful d...Explore beautiful and ugly buildings. Mathematics helps us create beautiful d...
Explore beautiful and ugly buildings. Mathematics helps us create beautiful d...christianmathematics
 
fourth grading exam for kindergarten in writing
fourth grading exam for kindergarten in writingfourth grading exam for kindergarten in writing
fourth grading exam for kindergarten in writingTeacherCyreneCayanan
 

Recently uploaded (20)

APM Welcome, APM North West Network Conference, Synergies Across Sectors
APM Welcome, APM North West Network Conference, Synergies Across SectorsAPM Welcome, APM North West Network Conference, Synergies Across Sectors
APM Welcome, APM North West Network Conference, Synergies Across Sectors
 
1029-Danh muc Sach Giao Khoa khoi 6.pdf
1029-Danh muc Sach Giao Khoa khoi  6.pdf1029-Danh muc Sach Giao Khoa khoi  6.pdf
1029-Danh muc Sach Giao Khoa khoi 6.pdf
 
Basic Civil Engineering first year Notes- Chapter 4 Building.pptx
Basic Civil Engineering first year Notes- Chapter 4 Building.pptxBasic Civil Engineering first year Notes- Chapter 4 Building.pptx
Basic Civil Engineering first year Notes- Chapter 4 Building.pptx
 
Advanced Views - Calendar View in Odoo 17
Advanced Views - Calendar View in Odoo 17Advanced Views - Calendar View in Odoo 17
Advanced Views - Calendar View in Odoo 17
 
Mattingly "AI & Prompt Design: Structured Data, Assistants, & RAG"
Mattingly "AI & Prompt Design: Structured Data, Assistants, & RAG"Mattingly "AI & Prompt Design: Structured Data, Assistants, & RAG"
Mattingly "AI & Prompt Design: Structured Data, Assistants, & RAG"
 
Class 11th Physics NEET formula sheet pdf
Class 11th Physics NEET formula sheet pdfClass 11th Physics NEET formula sheet pdf
Class 11th Physics NEET formula sheet pdf
 
SECOND SEMESTER TOPIC COVERAGE SY 2023-2024 Trends, Networks, and Critical Th...
SECOND SEMESTER TOPIC COVERAGE SY 2023-2024 Trends, Networks, and Critical Th...SECOND SEMESTER TOPIC COVERAGE SY 2023-2024 Trends, Networks, and Critical Th...
SECOND SEMESTER TOPIC COVERAGE SY 2023-2024 Trends, Networks, and Critical Th...
 
Presentation by Andreas Schleicher Tackling the School Absenteeism Crisis 30 ...
Presentation by Andreas Schleicher Tackling the School Absenteeism Crisis 30 ...Presentation by Andreas Schleicher Tackling the School Absenteeism Crisis 30 ...
Presentation by Andreas Schleicher Tackling the School Absenteeism Crisis 30 ...
 
Key note speaker Neum_Admir Softic_ENG.pdf
Key note speaker Neum_Admir Softic_ENG.pdfKey note speaker Neum_Admir Softic_ENG.pdf
Key note speaker Neum_Admir Softic_ENG.pdf
 
SOCIAL AND HISTORICAL CONTEXT - LFTVD.pptx
SOCIAL AND HISTORICAL CONTEXT - LFTVD.pptxSOCIAL AND HISTORICAL CONTEXT - LFTVD.pptx
SOCIAL AND HISTORICAL CONTEXT - LFTVD.pptx
 
psychiatric nursing HISTORY COLLECTION .docx
psychiatric  nursing HISTORY  COLLECTION  .docxpsychiatric  nursing HISTORY  COLLECTION  .docx
psychiatric nursing HISTORY COLLECTION .docx
 
PROCESS RECORDING FORMAT.docx
PROCESS      RECORDING        FORMAT.docxPROCESS      RECORDING        FORMAT.docx
PROCESS RECORDING FORMAT.docx
 
Application orientated numerical on hev.ppt
Application orientated numerical on hev.pptApplication orientated numerical on hev.ppt
Application orientated numerical on hev.ppt
 
Unit-IV- Pharma. Marketing Channels.pptx
Unit-IV- Pharma. Marketing Channels.pptxUnit-IV- Pharma. Marketing Channels.pptx
Unit-IV- Pharma. Marketing Channels.pptx
 
Seal of Good Local Governance (SGLG) 2024Final.pptx
Seal of Good Local Governance (SGLG) 2024Final.pptxSeal of Good Local Governance (SGLG) 2024Final.pptx
Seal of Good Local Governance (SGLG) 2024Final.pptx
 
Mixin Classes in Odoo 17 How to Extend Models Using Mixin Classes
Mixin Classes in Odoo 17  How to Extend Models Using Mixin ClassesMixin Classes in Odoo 17  How to Extend Models Using Mixin Classes
Mixin Classes in Odoo 17 How to Extend Models Using Mixin Classes
 
Explore beautiful and ugly buildings. Mathematics helps us create beautiful d...
Explore beautiful and ugly buildings. Mathematics helps us create beautiful d...Explore beautiful and ugly buildings. Mathematics helps us create beautiful d...
Explore beautiful and ugly buildings. Mathematics helps us create beautiful d...
 
Advance Mobile Application Development class 07
Advance Mobile Application Development class 07Advance Mobile Application Development class 07
Advance Mobile Application Development class 07
 
fourth grading exam for kindergarten in writing
fourth grading exam for kindergarten in writingfourth grading exam for kindergarten in writing
fourth grading exam for kindergarten in writing
 
Mehran University Newsletter Vol-X, Issue-I, 2024
Mehran University Newsletter Vol-X, Issue-I, 2024Mehran University Newsletter Vol-X, Issue-I, 2024
Mehran University Newsletter Vol-X, Issue-I, 2024
 

LEVELS OR SCALES OF MEASUREMENT.pptx

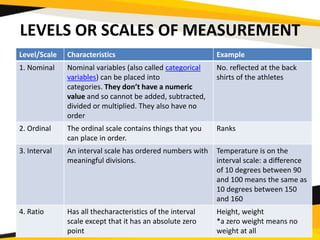
  • 1. LEVELS OR SCALES OF MEASUREMENT Level/Scale Characteristics Example 1. Nominal Nominal variables (also called categorical variables) can be placed into categories. They don’t have a numeric value and so cannot be added, subtracted, divided or multiplied. They also have no order No. reflected at the back shirts of the athletes 2. Ordinal The ordinal scale contains things that you can place in order. Ranks 3. Interval An interval scale has ordered numbers with meaningful divisions. Temperature is on the interval scale: a difference of 10 degrees between 90 and 100 means the same as 10 degrees between 150 and 160 4. Ratio Has all thecharacteristics of the interval scale except that it has an absolute zero point Height, weight *a zero weight means no weight at all
  • 2. SHAPES, DISTRIBUTIONS AND DISPERSION OF DATA 1. SYMMETRICALLY SHAPED TEST SCORE DISTRIBUTION A. Normal Distribution or Bell Shaped Curve Frequencies Test Scores
  • 3. SHAPES, DISTRIBUTIONS AND DISPERSION OF DATA 1. SYMMETRICALLY SHAPED TEST SCORE DISTRIBUTION A. Rectangular Distribution Test Scores Frequencies
  • 4. SHAPES, DISTRIBUTIONS AND DISPERSION OF DATA 1. SYMMETRICALLY SHAPED TEST SCORE DISTRIBUTION A. U-shaped Curve Test Scores Frequencies
  • 5. SHAPES, DISTRIBUTIONS AND DISPERSION OF DATA 2. SKEWED DISTRIBUTIONS OF TEST SCORES A. Positively Skewed Distribution B. Negatively Skewed Distribution Scores No. of Students Scores
  • 6. What is Variability in Statistics? Variability (also called spread or dispersion) refers to how spread out a set of data is. Variability gives you a way to describe how much data sets vary and allows you to use statistics to compare your data to other sets of data.
  • 7. The four main ways to describe variability in a data set are: • RANGE • INTERQUARTILE RANGE • VARIANCE • STANDARD DEVIATION
  • 8. MEASURES OF VARIABILITY A. Range B. Standard deviation C. Quartile Deviation or Semi- interquartile Range
  • 9. DESCRIPTIVE STATISTICS • The first step in data analysis is to describe or summarize the data using descriptive statistics.
  • 10. What is Variability in Statistics? Variability (also called spread or dispersion) refers to how spread out a set of data is. Variability gives you a way to describe how much data sets vary and allows you to use statistics to compare your data to other sets of data.
  • 11. I. MEASURES OF CENTRAL TENDENCY -numerical values which describe the average or typical performance of a given groups in terms of certain attributes. -basis in determining whether the group is performing better or poorer than the other groups.
  • 12. Descriptive Satistics When to use and characteristics a. Mean Arithmetic average, use when the distribution is normal/symmetrical or bell shaped. Most reliable/stable b. Median Point in a distribution above and below which are 50% of the scores/ cases; medpoint of a distribution; use when the distribution is skewed c. Mode Most frequent/ common score in a distribution
  • 13. II. MEASURES OF VARIABILITY - Indicate or describe how spread the scores are. The larger the measures of variability the more spread the scores are and the group is said to be heterogeneous; the smaller the measure of variability the less spread the scores are, the group is said to be homogenous.
  • 14. MEASURES OF VARIABILITY A. Range-difference between the highest and lowest score; counterpart of the mode is also reliable and unstable B. Standard deviation-The counterpart of the mean, used also when the distribution is normal or symmetrical; Reliable/stable and widely used C. Quartile Deviation or Semi-interquartile Range- Defined as one- half of the difference between quartile 3(75th percentile) and quartile 1 (25th percentile) in a distribution; Counterpart of the median; Used when the distribution is skewed
  • 15. III. Measures of Relationship -describe the degree of relationship or correlation between twovariables (academic achievement and motivation). It is express in terms of correlation coefficient from -1 to 0 to 10.
  • 16. a. Pearson r b. Spearman-rank- order Correlation or Spearman Rho
  • 17. IV. Measure of Relative Position -indicate where the score is in relation to all other scores in the distribution; they make it possible to compare the performance of an individual in two or more different tests.
  • 18. a. Percentile Ranks b. Standard Scores c. Stanine Scores d. T-Scores

Editor's Notes

  1. Represent real-valued random variables whose distribution are not-known Heights of people Measurement errors Blood pressure salaries Standard deviation controls the spread of the distribution.
  2. Probability- equally probable Uniform distribution- distribution that has constant probability Rolling a die
  3. A pos. skew means that the extreme data results are larger. The mean will be larger than the median in skewed