
Recommended
More Related Content
Similar to The Nature of Mother Nature
Similar to The Nature of Mother Nature (20)
Recently uploaded
Recently uploaded (20)
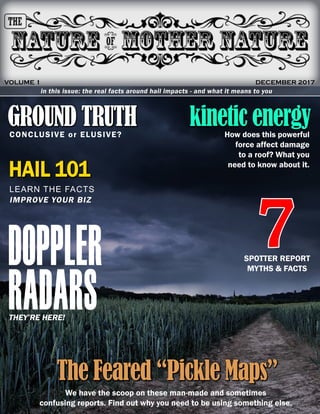
The Nature of Mother Nature
- 2. ©2017 Dynamic Weather Solutions, Inc. The Inside Scoop on Hail, Radar and the Stormy Truth about Weather. ver wonder why weather data is such an inexact science? Why hail “maps” don’t always get it right? What they’re not telling you about all those easy claims of “accuracy” for all those instant calculations? You know it’s more complicated than that, but who has the time to track down the truth? These answers aren’t just academic; they can affect your bottom line. They affect where and how you target your time and effort. They can make-or-break your business. The answer? Turns out Mother Nature doesn’t always play by the numbers. She has her own agenda. Her own rules. And those rules affect the technology we use to take her measure. So if you want to make the most of the weather data we––or anyone else––provide, there are some helpful things you should know about Mother Nature’s… well, nature. The other guys may be fine with you not knowing this stuff. But, HailStrike believes transparency and in educating our customers. HAIL 101 Hail is born in a thunderstorm’s updraft, where powerful winds carry water droplets very high into the super-cooled freezing region. There, temperatures can sink to below MINUS 100 degrees Fahrenheit. Once the liquid changes to ice, it gets tossed around the cell by internal winds. As it gains size, it picks up even more liquid and sometimes merges with other ice formations. Eventually, when the hailstone’s weight exceeds the force of up-drafting winds, the hail falls to the ground. Hail commonly falls fairly straight down when it is unaffected by cross winds. That’s why hail tends to spread evenly over a roof or ground area. TAKE-AWAY: The overall size of a super cell thunderstorm determines the size and density of the hail that makes its way to the ground. Doppler No-Man’s Land Doppler radars are incredible. The National Weather Service's array of WSR-88D Doppler radars can detect intense rain or snow within approximately 155 miles. However, it has limitations. Doppler has trouble detecting light rain, light snow, or drizzle from shallow cloud weather systems. The radars’ base “reflectivity product” E
- 3. ©2017 Dynamic Weather Solutions, Inc. does a great job of picking up normal precipitation as far out as 143 miles, but does not perform as well in those last few miles. And the radar image won’t show scans from precipitation outside its beam––either beyond it or under it. This means that as the activity gets closer to the ground, it becomes much harder, if not impossible, to track. At this point, it enters DOPPLER NO MAN'S LAND, leaving one to either speculate or form a hypothesis based on historical storm activity with similar characteristics. TAKE- AWAY: If you’re relying on Doppler data, allow for the No-Man’s Land margin-of-error. Doppler Drop-Out Doppler radars rotate constantly, picking up and recording dynamics of the atmosphere around it. However, these multi-million dollar installations use highly-sensitive measurement equipment that often goes through frequent upgrades, maintenance and even down-time due to failures, as this chart (right) shows. So, not every station is always going to capture everything that happens every minute of the day. And because they’re forward facing, while they are on a rotation facing East (for example), they have no idea what’s going on in the WEST. Therefore, unless neighboring radars have overlapping coverage, a storm could be missed altogether. In the most sensitive mode, called “Clear Air Mode,” the radar’s data is updated every 10 minutes. This slower Clean Air Mode antenna rotation rate lets the radar sample the atmosphere longer. If it’s in “Precipitation Mode,” it is updated every 5-6 minutes, sacrificing accuracy to detect more storm activity. TAKE-AWAY: Repair and scan mode status can affect the accurate delivery of your Doppler data. THE TROUBLE WITH SPOTTER REPORTS To gather more critical weather information, the National Weather Service (NWS) started the SKYWARN® system with partner organizations. This volunteer program has between 350,000 and 400,000 trained severe weather spotters comprised of citizens, Law Enforcement and Media Stations, to mention a few. These volunteers give timely reports of severe weather to the National Weather Service, allowing it to issue warnings of Potential, Maximum, Possible, or Probable activity. (For good reason, these labels are very vague.) Their primary purpose is to get warnings out to the public as quickly as possible. However, some weather reporting companies rely on them as fact, even though there may be no scientific evidence to support the details of the warning. Generic Certificate upon Completion
- 4. ©2017 Dynamic Weather Solutions, Inc. For example: if a spotter calls in and reports hail activity, the NWS quickly analyzes the reporter’s area. Then, it might determine, for example, that UP TO 2-inch hail may be POSSIBLE. Then it would issue an advisory statement of 2-inch hail at a location. However, this is only an “advisory” to be used as a warning of potential, maximum activity. The majority may in fact be mostly pea sized, with maybe one or two larger pieces. The NWS advisory marker’s reported location (latitude and longitude) are NOT based on the storm’s exact location, but rather the location from where the report was made. In some instances, the difference between the two has been as far as 15 miles! Despite those limitations, some companies maintain websites listing these vague “guess-timations” of size and general locations––even though they are, in essence, expired advisories. The NWS is constantly updating forecasts and issuing advisories anywhere from 5 minutes in advance to 5 days in advance. TAKE-AWAY: Beware of any weather data provider that recycles old spotter reports as fact. HOW FAR IS TOO FAR? A NexRad’s scan pattern is more dense close to the radar. As distance from the radar increases, the area covered by each sweep dilutes, so much more data is collected in the smaller areas nearest the radar. This means accuracy is greatest the closer the hail activity is to the radar. A scan that encompasses 2.5 miles which is 13 miles from the radar is spread out to 30.5 miles when it reaches 155 miles away! So data, maps or reports of hail activity closer to a radar station will always be more reliable than data from many more miles away. TAKE-AWAY: For the best details on a storm’s activity, refer to the radar closest to where it happened. HOW WIND AFFECTS HAIL Have you ever stood outside looking at clouds overhead and noticed another level of clouds just above or behind it, moving the opposite direction? Maybe even at different speeds? Generally storms develop in the West and Northwest and move East and Northeast. Some of the most severe winds will come from the rear-flanking downdraft which is an essential ingredient in tornadoes and large hail. Several forces impact a super cell; even the slightest influences can drastically affect where it falls, how big it is, the volume that falls, and both its composition and duration. Wind’s influence on hail impact comes down to basic physics. How much damage a hailstone inflicts is directly linked to the relationship between its kinetic energy and the roofing material’s resistance.
- 5. ©2017 Dynamic Weather Solutions, Inc. Since roof surfaces have varying pitch, hailstones (whether affected by cross winds or not) pack varying amounts of kinetic energy. Not all hail impacts rooftops at the same angle. Not all storms feature the same wind affect or the same kinetic energy. This is why different events and locations can show such widely different results. A shingle’s granular integrity can also be greatly affected by smaller diameter hail. Some hailstones can be travelling at up to 150 MPH at the point of impact! Strong internal winds can directly affect the angle of impact, as well as, the terminal velocity. The impact energy of a hailstone could either significantly increase or decrease. Studies have revealed that a 3-tab asphalt shingle (the most common roofing material in the US) would need to be struck by a hailstone of 1" diameter in order to cause functional damage. For a 1/2" or even 3/4" hailstone to match the impact energy of a 1" hailstone it would need wind speeds of over 135 MPH. However, these circumstances are quite rare. TAKE-AWAY: A hailstone’s kinetic energy is affected by: 1) Its Size (with varying densities) 2) Its Speed (Terminal velocity + downward and sideways wind gusts) 3) Its angle of impact (hail direction + pitch of roof). OKAY, SO WHAT ABOUT BACKWARDS WINDS? Although straight-falling hailstones routinely strike a building’s upward facing surfaces, they can also affect the structure’s sides; in some cases, even its leeward side as a storm moves across it. That kind of “perfect storm” might be rare, but the internal structure of a super cell is actually fed by a powerful mesocyclone. In those tumultuous parts, winds are going haywire. If a structure faces the right direction as this mesocyclone picks up debris or hailstones, it can certainly impact more than the structure’s facing side. It can even strike all sides! TAKE-AWAY: Don’t limit your inspection for hail damage solely to the roof. Greater angles reduce the Impact Anatomy of a Super Cell
- 6. ©2017 Dynamic Weather Solutions, Inc. PICKLE MAPS How many times have you reviewed a map only to find minimal or possibly even NO damage? You’re right in the middle of a big pickle-looking shape where the map shows the LARGEST hail! Meanwhile, there are also those who will search a storm’s perimeter for fringe areas of damage. Even their best strategies often bring the same result. NO HAIL. How can this be? The majority of these pickle maps show larger sizes of hail in the middle of a swath of activity. But if you look closer, the “smaller” hail layers seem to cover the entire affected area. One would assume this ENTIRE area received SOME sort of hail of varying size. “That wouldn’t be entirely true Mr. President.” No wonder these maps are misinterpreted as showing where MOST hail fell––when they actually show hail SIZE. A graphical representation of a real hail storm would look much more "splotchy" as the effects of wind and other factors would potentially make the hail fall in many directions, with multiple intensities. The internal workings of a storm cell are incredibly violent and widespread. This cutaway (left) shows all the turbulent winds and scattered precipitation. It’s hard to believe this storm would have produced such defined lines of hail according to SIZE only. TAKE-AWAY: pickle maps oversimplify and distort hail results! MELT ZONES? Each storm cell has internal zones referred to as "Melt zones." These layered areas are mostly changes in air temperature that affect the melting of hail. The challenge is that during the hot summer, the temperature on the ground may be 90-100 degrees. This means a hail stone could go through a near 200 degree temperature change in a very short span of time––and the biggest changes in temperature, going from freezing to non-freezing––happen in the last few hundred feet. Do you see the problem here? The point of greatest change happens exactly where the hail falls below the radar’s lowest elevation. Now it has entered the famous DOPPLER NO MAN’S LAND. Dynamics of a Hail Storm
- 7. ©2017 Dynamic Weather Solutions, Inc. What ends up hitting the ground (if anything) is largely speculative at best. There are several ways in which estimations are made, but without a “fantasy measurement grid” – a gynormous network of one- meter-square impact-sensing analysis mats laid side-by-side all across every inch of the continental United States, there is simply no scientifically-backed evidence of ground activity. Human reports (spotters) using no measurement tools, are only able to let us know that hail, in some form or fashion, made it to the ground. How big, how much and where it hit, is an entirely different story. TAKE-AWAY: The conditions of the last fifty feet affect hail almost more than the fifty-thousand feet above them! "ACCURATE" IS THE LONGEST FOUR LETTER WORD Everybody is looking for data that is accurate, and there are no shortages of hail-mapping companies claiming to be “more accurate” than the other guys. Unfortunately, until someone deploys that “fantasy measurement grid,” we’re all limited to the current NWS Doppler Radar System. These radars measure several storm attributes with an analog signal. Remember those old cell phones that used to fade out as you got farther away from a tower? And switching from one company to another over claims of “absolute accuracy” is like buying a new TV because you don’t like a program on Channel 5. Due to radar’s performance and design limitations, there simply is no current way to be 100% accurate when reporting hail activity. While newer technologies are in development, and testing looks favorable, we’ll have to wait several years for a very expensive distribution of these new radars. TAKE-AWAY: Instead of looking at easy claims of competing “accuracy” in your hail-data provider, look for how well their products leverage that information to fuel your business. WHERE DO WE GO FROM HERE? Since the “nature” of Mother Nature is so unpredictable and difficult to completely anticipate with our current equipment limitations, relying on these existing technologies and measurement hardware may be the only option. Variance in almost every aspect of a storm limits our ability to call any form of reporting truly “accurate.” Still, nothing replaces the confirmation of hail damage like feet on the ground. Inconsistent storm effects confirm the need for visual, on-site inspection. While reports, maps and other weather tracking tools are helpful, they still require confirmation and cross-referencing when possible. The key to getting the most from your investments is to fully understand how to interpret data and successfully form a plan of action that will not only bring new business to your company, but also show your existing clients your commitment to them. A hail-data provider who helps you do these is the hail-data provider you want working for you.