The Economic Contribution of Illinois Manufacturing
•
1 like•55 views

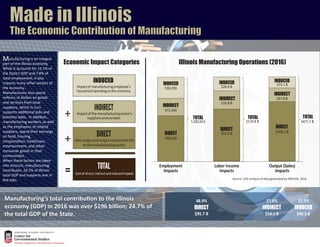
Manufacturing is an integral part of the Illinois economy. While it accounts for 12.1% of the State’s GDP and 7.8% of total employment, it also impacts many other sectors of the economy. Manufacturers also spend millions of dollars on goods and services from local suppliers, which in turn supports addiƟonal jobs and business sales. In addiƟon, manufacturing workers, as well as the employees of related suppliers, spend their earnings on food, housing, ransportaƟon, healthcare, entertainment, and other consumer goods in their communiƟes. When these factors are taken into account, manufacturing contributes 24.7% of Illinois’ total GDP and supports one in five jobs.

Recommended
Recommended
More Related Content
What's hot
What's hot (17)
Similar to The Economic Contribution of Illinois Manufacturing
Similar to The Economic Contribution of Illinois Manufacturing (20)
More from Black Hawk Economic Development
More from Black Hawk Economic Development (20)
Recently uploaded
Recently uploaded (20)
The Economic Contribution of Illinois Manufacturing
- 1. Source: CGS analysis of data generated by IMPLAN, 2016. Economic Impact Categories DIRECT Jobs,wagesandoutputsourceddirectly to themanufacturingsector INDIRECT Impactof themanufacturingsector’s suppliersandvendors INDUCED Impactof manufacturingemployee’s householdspendingonthe economy TOTAL Sumof direct,indirectandinducedimpacts + + = Made in Illinois The Economic Contribution of Manufacturing Illinois Manufacturing Operations (2016) INDUCED INDIRECT DIRECT TOTAL Employment Impacts Labor Income Impacts Output (Sales) Impacts 530,293 472,340 590,018 1,592,652 INDIRECT DIRECT TOTAL $33.8 B $51.0 B $110.8 B INDUCED INDIRECT DIRECT TOTAL $75.1 B $91.8 B $304.2 B $471.1 B INDUCED $26.0 B $54.1 B INDIRECT 27.6% INDUCED 23.5% $46.5 B Manufacturing is an integral part of the Illinois economy. While it accounts for 12.1% of the State’s GDP and 7.8% of total employment, it also impacts many other sectors of the economy. Manufacturers also spend millions of dollars on goods and services from local suppliers, which in turn supports addi�onal jobs and business sales. In addi�on, manufacturing workers, as well as the employees of related suppliers, spend their earnings on food, housing, ransporta�on, healthcare, entertainment, and other consumer goods in their communi�es. When these factors are taken into account, manufacturing contributes 24.7% of Illinois’ total GDP and supports one in five jobs. DIRECT 48.9% $95.7 B Manufacturing’s total contribu�on to the Illinois economy (GDP) in 2016 was over $196 billion; 24.7% of the total GDP of the State. Manufacturing’s total contribu�on to the Illinois economy (GDP) in 2016 was over $196 billion; 24.7% of the total GDP of the State.
- 2. Made in Illinois The Economic Contribution of Manufacturing Key Employment Impacts Industry Descrip�on Wholesale trade Management of companies & enterprises Truck transporta�on Employment services Grain farming Services to buildings Market research; professional, scien�fic & technical services Real estate Jobs 75,900 41,400 28,800 16,000 15,200 14,700 13,200 11,000 Industries experiencing the greatest indirect employment impacts... Industries experiencing the greatest induced employment impacts... Industry Descrip�on Hospitals, physicians & related healthcare services Ea�ng & drinking establishments Real estate General merchandise retailers Food & beverage stores Wholesale trade Personal care services Individual & family services Jobs 82,200 66,400 21,900 16,900 15,000 12,600 11,400 11,300 The Multiplier Effect For every 10 jobs created or retained by Illinois manufacturers… … another 17 jobs are supported in other industries such as transporta�on, healthcare, business services and retail trade. ... a mul�plier of 2.70 Leading Manufacturing Clusters by Employment Industry Descrip�on Fabricated metal products Food products Machinery Miscellaneous manufacturing Chemical products Plas�cs & rubber products Transporta�on equipment Electrical equipment, appliance, & components Jobs 90,900 90,800 71,500 44,000 43,600 42,500 41,900 35,200 Employment (Jobs) – An employee is someone who enters into an agreement formal or informal, to perform work in return for compensation in cash or in kind. Note: job numbers have been rounded to the nearest hundred.
- 3. Made in Illinois The Economic Contribution of Manufacturing Key Output Impacts Industry Descrip�on Wholesale trade Management of companies & enterprises Truck transporta�on Grain farming Electric power transmission & distribu�on Real estate Rail transporta�on Lessors of non-financial intangible assets Output $19.9 B $10.8 B $4.7 B $3.8 B $2.9 B $2.7 B $2.0 B $2.0 B Industries experiencing the greatest indirect output impacts... Industries experiencing the greatest induced output impacts... Industry Descrip�on Hospitals, physicians & related healthcare services Owner-occupied dwellings Real estate Ea�ng & drinking establishments Wholesale trade Insurance carriers Monetary authori�es & depository credit intermedia�on Other financial investment ac�vi�es Output $9.4 B $9.2 B $5.2 B $4.3 B $3.3 B $2.5 B $2.4 B $2.0 B The Multiplier Effect … supports an addi�onal $54.90 of output in other industries. a mul�plier of 1.55 Leading Manufacturing Clusters by Output per Worker Output is the value of an industry’s production. For the manufacturing sector this is includes sales plus or minus any change in inventory. Industry Descrip�on Petroleum and coal products Chemical products Beverage and tobacco products Transporta�on equipment Food manufacturing Primary metals Machinery Computer & electronic products Output per Worker $3,716,400 $1,081,800 $796,400 $714,200 $650,800 $531,400 $493,500 $409,900 Every $100 in output generated by Illinois manufacturers…
- 4. Made in Illinois The Economic Contribution of Manufacturing Value-Added in the IMPLAN framework is the same as the official measure of “Gross Domestic Product” or “GDP” at the national or state level. In contrast to the concept of output, it represents the difference between the value of goods and services purchased as production inputs and the value of the goods and services produced. Key Value-Added Impacts Industry Descrip�on Wholesale trade Management of companies & enterprises Truck transporta�on Real estate Monetary authori�es & depository credit intermedia�on Adver�sing, public rela�ons & related services Lessors of non-financial intangible assets Maintenance & repair of nonresiden�al structures Value-Added $14.2 B $5.9 B $2.2 B $2.2 B $1.4 B $1.2 B $1.0 B $1.0 B Industries experiencing the greatest indirect value-added impacts... Industries experiencing the greatest induced value-added impacts... Industry Descrip�on Owner-occupied dwellings Hospitals, physicians & related healthcare services Real estate Wholesale trade Insurance carriers Ea�ng & drinking establishments Monetary authori�es & depository credit intermedia�on Legal services Value-Added $6.2 B $4.0 B $3.7 B $2.4 B $1.7 B $1.7 B $1.5 B $0.9 B The Multiplier Effect Every $100 in value-added created by Illinois manufacturers… a mul�plier of 2.05 … supports an addi�onal $105 of value-added in other industries. $ $ $ $ $ $ $ $ $ $ $ $ $ $ $ $ $ $ $ $ $ $ $ $ $ $ $ $ $ $ $ $ $ $ $ $ $ $ $ $ $ $ $ $ $ $ $ $ $ $ $ $ $ $ $ $ $ $ $ $ $ $ $ $ $ $ $ $ $ $ $ $ $ $ $ $ $ $ $ $ $ $ $ $ $ $ $ $ $ $ $ $ $ $ $ $ $ $ $ $ $ $ $ $ $ $ $ $ $ $ $ $ $ $ $ $ $ $ $ $ $ $ $ $ $ $ $ $ $ $ $ $ $ $ $ $ $ $ $ $ $ $ $ $ $ $ $ $ $ $ $ $ $ $ $ $ $ $ $ $ $ $ $ $ $ $ $ $ $ $ $ $ $ $ $ $ $ $ $ $ $ $ $ $ $ $ $ $ $ $ $ $ $ $ $ $ $ $ $ $ $ $ $ $ $ Top Manufacturing Sub-Sectors by 2016 Value-Added Industry Descrip�on Pharmaceu�cal prepara�ons Petroleum refineries Construc�on machinery Prin�ng Miscellaneous plas�cs products Wet corn milling Automobiles $9.4 B $6.2 B $4.9 B $2.6 B $2.4 B $2.2 B $1.9 B Total Value-Added
- 5. Made in Illinois The Economic Contribution of Manufacturing Labor Income represents all forms of employment income, including wages and salaries and all benefits and employer paid payroll taxes, as well as proprietor income. Key Labor Income Impacts Industry Descrip�on Wholesale trade Management of companies & enterprises Truck transporta�on Management consul�ng services Market research; professional, scien�fic & technical services Adver�sing, public rela�ons & related services Securi�es & commodity contracts & brokerage services Accoun�ng, tax prepara�on, bookkeeping & payroll services Labor income $7.1 B $5.6 B $1.7 B $1.0 B $1.0 B $0.8 B $0.8 B $0.7 B Industries experiencing the greatest indirect labor income impacts... Industries experiencing the greatest induced labor income impacts... Industry Descrip�on Hospitals, physicians & related healthcare services Ea�ng & drinking establishments Wholesale trade Real estate Monetary authori�es & depository credit intermedia�on Junior colleges, colleges, universi�es & professional schools Religious organiza�ons Food & beverage stores Labor Income $5.5 B $1.7 B $1.2 B $0.7 B $0.7 B $0.7 B $0.5 B $0.5 B The Multiplier Effect Every $100 of labor income generated by Illinois manufacturers… a mul�plier of 2.08 …supports an addi�onal $108 of labor in other industries. $ $ $ $ $ $ $ $ $ $ $ $ $ $ $ $ $ $ $ $ $ $ $ $ $ $ $ $ $ $ $ $ $ $ $ $ $ $ $ $ $ $ $ $ $ $ $ $ $ $ $ $ $ $ $ $ $ $ $ $ $ $ $ $ $ $ $ $ $ $ $ $ $ $ $ $ $ $ $ $ $ $ $ $ $ $ $ $ $ $ $ $ $ $ $ $ $ $ $ $ $ $ $ $ $ $ $ $ $ $ $ $ $ $ $ $ $ $ $ $ $ $ $ $ $ $ $ $ $ $ $ $ $ $ $ $ $ $ $ $ $ $ $ $ $ $ $ $ $ $ $ $ $ $ $ $ $ $ $ $ $ $ $ $ $ $ $ $ $ $ $ $ $ $ $ $ $ $ $ $ $ $ $ $ $ $ $ $ $ $ $ $ $ $ $ $ $ $ $ $ $ $ $ $ $ $ $ $ Top Manufacturing Sub-Sectors by 2016 Employee Earnings Industry Descrip�on 9.9% 5.7% 14.2% 5.7% 4.0% 6.8% -0.9% Chemicals Petroleum & coal products Miscellaneous manufacturing Machinery Computer & electronic products Electrical equipment, appliances, & components Primary metals $111,066 $107,829 $87,240 $75,507 $69,909 $69,909 $65,226 Average Earnings 3-Year Trend Source: Longitudinal Employer-Household Dynamics (LEHD) program, Center for Economic Studies, U.S. Census Bureau.
- 6. Made in Illinois The Economic Contribution of Manufacturing Methodology This research brief u�lized the best available data to summarize the economic impact of the manufacturing sector in Illinois for 2016 calendar year. The impacts were calculated using IMPLAN, a popular Input-Output sta�s�cal model. The direct employment and other figures for manufacturing sector were derived from the 2016 IMPLAN model, as were the indirect (business-to-business spending) and induced (household spending of employees) impacts. The model was adjusted to eliminate double coun�ng in the es�mates of indirect and induced effects. As is the case with all econometric models, there are certain limita�ons that should be c onsidered when reviewing results. Further Information Brian L. Harger Research Associate Center for Governmental Studies Northern Illinois University 148 North Third Street DeKalb, Illinois 60115 815.753.0934 bharger@niu.edu h�ps://www.cgs.niu.edu h�ps://www.linkedin.com/in/brianharger/ h�ps://www.slideshare.net/BrianHarger/ The Center for Governmental Studies (CGS) at Northern Illinois University (NIU) provides exper�se that helps decision-makers implement efficient, sustainable, and cost-effec�ve approaches to social, economic, and informa�on manage- ment issues. Founded in 1969, CGS assembles interdisciplinary teams to work with government at all levels, non-profit organiza�ons, school districts, commu- nity colleges, park districts, library districts, land conserva�on districts, land developers, health care agencies, and u�li�es. CGS projects focus on five outcomes: 1) Reinvigora�ng local economies 2) Suppor�ng local governments 3) Promo�ng balanced communi�es 4) Informing sound decision-making 5) Reskilling the workforce About CGS