1. Original Research
Absolute Quantification of Myocardial Blood Flow
With Constrained Estimation of the Arterial Input
Function
Jacob U. Fluckiger, PhD,1* Brandon C. Benefield, MS,2
Kathleen R. Harris, BA,2
and Daniel C. Lee, MD2
Purpose: To evaluate the performance of the constrained
alternating minimization with model (CAMM) method for
estimating the input function from the myocardial tissue
curves.
Materials and Methods: Myocardial perfusion imaging
was performed on seven canine models of coronary artery
disease in 15 imaging sessions. In each session, stress
was induced with intravenous infusion of adenosine and a
variable occluder created coronary artery stenosis. A dual
bolus protocol was used for each acquisition, and input
functions were then estimated using the CAMM method
with data acquired from the high dose scan following each
imaging session. For each acquisition, myocardial blood
flow was measured by injected microspheres.
Results: The dual bolus and CAMM-derived flows were
not significantly different (P ¼ 0.18), and the correlation
between the two methods was high (r ¼ 0.97). The corre-
lation between the dual bolus and CAMM methods and
microsphere measurements was lower than that for the
two MR methods (r ¼ 0.53; r ¼ 0.43, respectively).
Conclusion: The CAMM method presented here shows
promise in estimating myocardial blood flow in patients
with coronary artery disease at stress with a single injec-
tion and without any specialized acquisitions. Further
work is needed to validate the approach in a clinical
setting.
Key Words: myocardial blood flow quantification; arterial
input function; myocardial perfusion imaging
J. Magn. Reson. Imaging 2013;38:603–609.
VC 2013 Wiley Periodicals, Inc.
MYOCARDIAL PERFUSION IMAGING is a useful tool
for detecting regions within the myocardium with lim-
ited flow reserve. First-pass myocardial perfusion MRI
is increasingly used to assess the presence and sever-
ity of coronary artery disease (1–4) and to characterize
myocardial blood flow patterns (5,6). First-pass myo-
cardial perfusion MRI involves the rapid acquisition of
images before and during the first passage of an exog-
enous contrast agent, typically a gadolinium chelate.
Quantification of myocardial blood flow (in mL/min/
gm) with first-pass myocardial perfusion MRI
improves diagnostic accuracy and can facilitate
research of novel therapeutics and cardiovascular
pathophysiology (7). Perfusion quantification requires
accurate time-resolved measurement of the concen-
tration of contrast agent in both the myocardial tissue
and the left ventricular (LV) blood pool or ascending
aorta, also known as the arterial input function (AIF)
(8). Unfortunately, the dose of contrast agent needed
for adequate myocardial tissue enhancement results
in signal saturation of the AIF and inaccurate perfu-
sion quantification (7,9).
Several techniques have been developed to circum-
vent the problem of signal saturation of the AIF and
enable accurate quantification of myocardial blood flow
(MBF) by perfusion MRI. The most common of these is
known as the dual bolus method (10–13). This method
involves two separate injections of contrast during
which images are acquired. A low dose injection of con-
trast is injected first to avoid signal saturation in the
LV blood pool during acquisition of the AIF. A second,
larger dose is then injected to provide higher signal in
the myocardial tissue. A second class of techniques
involves a modified saturation recovery acquisition pro-
tocol which acquires images of the LV blood pool and
myocardial tissue with separate delay times. This class
of methods, known as dual echo or dual contrast
acquisitions, uses only a single injection of contrast
(14–16). A third type of acquisition uses multiple sub-
sets of a radial trajectory k-space acquisition to recon-
struct images with different effective saturation recov-
ery times within a single injection and acquisition
(17–19). All of these methods have been shown to
accurately return MBF measurements. However, each
1
Department of Radiology, Northwestern University, Chicago, Illinois,
USA.
2
Department of Cardiology, Northwestern University, Chicago, Illinois,
USA.
Contract grant sponsor: American Heart Association; Contract grant
number: 0575041N; Contract grant sponsor: Northwestern Memorial
Foundation.
*Address reprint requests to: J.U.F., 737 N. Michigan Avenue, Suite
1600; Chicago, IL 60611. E-mail: jacob.fluckiger@northwestern.edu
Received May 23, 2012; Accepted December 7, 2012.
DOI 10.1002/jmri.24025
View this article online at wileyonlinelibrary.com.
JOURNAL OF MAGNETIC RESONANCE IMAGING 38:603–609 (2013)
CME
VC 2013 Wiley Periodicals, Inc. 603
2. requires specialized acquisition techniques, either in
the injection scheme or MRI sequence protocol.
In this work, we focused on the constrained alter-
nating minimization with model (CAMM) method for
estimating the LV blood pool signal directly from the
myocardial tissue curves (20). The CAMM method,
described below, does not require any specific acquisi-
tion technique and can measure both the AIF and
MBF with a single contrast injection. This method has
been shown in simulation to return MBF measure-
ments with an average error of 2%. In 17 of 20 sub-
jects previously tested, there was not a significant dif-
ference in MBF values measured using the CAMM or
dual bolus methods (20). The purpose of the current
work was to test the CAMM method on myocardial
perfusion images from canine models with varying
degrees of coronary stenosis. The MBF values calcu-
lated using the CAMM method were compared with
those measured using a more typical dual bolus pro-
tocol. Absolute MBF values calculated from injected
microspheres served as the gold standard for both
MR-based perfusion quantification methods.
METHODS
Data Acquisition
Fifteen stress perfusion studies were acquired from
seven canines of both sexes. All studies performed for
this work were in accordance with and after approval
by our institution’s animal care and use committee.
Each animal was chronically instrumented as previ-
ously described (21). During open chest surgery, the
proximal portion of the left circumflex artery and/or
the left anterior descending artery were instrumented
with an external hydraulic occluder and cuff-type
Doppler flowmeter. Catheters were placed in the left
and right atria, and the aorta for microsphere admin-
istration, adenosine infusion, and reference blood
withdrawal, respectively. Following instrumentation,
animals were rested for 7 days before MR imaging.
During imaging sessions, the occluder could be
inflated under Doppler guidance to create varying
degrees of stenosis, and then completely deflated at
the end of the study to avoid chronic coronary occlu-
sion. Except on terminal studies, care was taken to
avoid levels of occlusion that caused the blood flow at
stress to drop below resting values to prevent myocar-
dial injury.
Before imaging, the animals were anesthetized with
propofol solution (3 to 7 mg/kg IV), and ventilated
with an oxygen-isoflurane (1.5 to 2.5%) gas mixture.
Vasodilation was induced through infusion of adeno-
sine throughout the image acquisition. A dose of 70 to
280 mg/kg/min was used, based on previous Doppler
flowmeter measurements of the animals’ maximal va-
sodilation response to adenosine. All MR imaging was
done using a 1.5 Tesla (T) scanner (Espree, Siemens
Medical Systems, Erlangen, Germany) with animals in
the right lateral decubitus position and a six-element
chest coil secured over the left chest. A saturation re-
covery, Cartesian Fast Low-Angle Shot (turboFLASH)
sequence was used with TR/TE ¼ 2.21/1.39 ms, sat-
uration recovery time of 100 ms, flip angle of 12
,
slice thickness of 8 mm, and isotropic in-plane resolu-
tion of 1.79 mm. GRAPPA acceleration with an accel-
eration factor of 2 was used and no fat saturation was
applied. The acquisition matrix used in this study
was 192 Â 74. Two or three short axis slices were
scanned depending on the animal’s heart rate at the
time of imaging and a mid-ventricular slice was
selected for further analysis. A dual bolus protocol
was implemented for each acquisition. A 0.005 mmol/
kg dose of dilute (1/10 concentration) Gd-DTPA con-
trast was injected at a constant rate of 4 mL/s by
power injector (Medrad Inc., Indianola, PA). Following
this injection a second, nondilute dose of 0.05 mmol/
kg contrast was administered. Both injections were of
identical volume and injected at the same rate fol-
lowed by a 12 mL saline flush (injected at 4 mL/s)
using separate power injectors. Immediately following
the high-dose contrast injection of each study,
approximately 3 Â 106
microspheres (FluoSpheres
Blood Flow Determination Color Kit #2, 15 mm, invi-
trogen, Eugene, OR) were injected by means of cathe-
ter into the left atrium. Microspheres with multiple
unique fluorescence spectra enabled multiple imaging
studies to be carried out in each animal. All studies
were performed under adenosine vasodilation, but dif-
ferent levels of coronary stenosis were achieved by
varying the inflation level of the coronary occluder for
each study. Each animal was allowed to recover at
least 48 h between imaging studies. During image ac-
quisition ventilation was suspended to eliminate re-
spiratory motion artifacts.
Data Analysis
Following image acquisition each perfusion dataset
was analyzed using custom software developed in
Matlab (The MathWorks Inc., Natick, MA). The myo-
cardial tissue was manually segmented by an experi-
enced observer. A conservative segmentation was
used to avoid any voxels with apparent partial volume
effects, dark rim, or other artifacts. Images were then
normalized to correct for any B0 field inhomogeneity,
B1 nonuniformity, or coil sensitivity. This was done
by first subtracting the mean baseline (precontrast)
signal for each voxel in the segmented myocardium.
Each voxel was then normalized by dividing each
voxel within the segmented myocardium by the mean
of the precontrast signal over the entire myocardium,
which was assumed to have uniform signal intensity
before the injection of contrast agent (CA) (22,23). A
region of interest (ROI) in the LV blood pool of the low
dose dataset was manually segmented. The mean sig-
nal intensity of each of the time curves within the ROI
was calculated, and the resulting time curve was
scaled by ten to obtain the dual-bolus derived arterial
input function (dbAIF). A similar ROI was defined in
the LV blood pool of the full dose dataset for use in
constraining the AIF estimation as described below. A
mid-ventricular slice was selected from each dataset
for consistency, and the time curves from the voxels
within this slice were then input into the CAMM algo-
rithm to obtain an estimate for the arterial input
604 Fluckiger et al.
3. function (cAIF). Briefly, the CAMM method takes a set
of tissue concentration curves from a region of
enhancing tissue in a perfusion MRI experiment and
estimates an input function by alternately refining
estimates for the model parameters describing the tis-
sue curves and the AIF estimate. A functional repre-
sentation of the AIF, consisting of three gamma-vari-
ate curves and a sigmoid curve, is used to reduce the
number of parameters to be estimated, as well as to
reduce the impact of measurement noise on the esti-
mation. The parameters of the gamma-variate and sig-
moid curves are constrained as described in (24) to
reduce the number of free parameters to be estimated
to 11. A population-averaged AIF is needed to initial-
ize the estimation process. In this work, a population-
averaged AIF taken from previous animal studies with
an identical imaging protocol was used to initialize
the estimation. The estimation is also constrained by
including the saturated signal from the LV blood pool.
A saturation threshold describing the assumed degree
of saturation in the measured signal is used to define
the constraint. The estimation method is presented in
detail in (20). In the current implementation, the LV
blood pool constraint was weighted with l ¼ 0.15,
which was selected based on empirical observation of
the estimation output. The estimation process was
allowed to run until the mean difference in the param-
eters between successive iterations was less than 1%
of the mean parameter values. For each of the data-
sets presented here, this convergence criterion was
met within 50 iterations.
Following the calculation of both the dbAIF and cAIF,
the myocardial blood flow was measured voxelwise in
the segmented mid-ventricular slice. The extended
Tofts-Kety model (25) was used in blood flow calcula-
tion. Myocardial blood flow was calculated from the
Ktrans
parameter after correcting for the extraction frac-
tion (23). An extraction fraction of 0.5 was assumed for
all studies. Each voxel was fit independently with both
the dbAIF and cAIF to obtain two estimates for the blood
flow. Following MBF calculation, the myocardium was
divided into six equiangular regions, and the mean flow
value from each region was computed.
After the completion of all imaging sessions, the ani-
mals were euthanized with an overdose of pentobarbi-
tal. Each heart was then fixed in formalin. An 8 mm
slice, corresponding to the slice from the data analysis
described above, was sectioned into six equiangular
segments. Concentrations of fluorescent microspheres
in each segment were quantified fluorometrically (26)
and expressed on a per-gram basis. Flow results from
the microsphere analysis were compared with those
from each of the MR-based calculations. Each pair of
flow results (dbAIF-cAIF, dbAIF-microsphere, cAIF-
microsphere) was plotted against each other and the
linear correlations were calculated. Bland-Altman
mean-difference plots (27) were also generated for
each pair of flow results to analyze the agreement
between flow values. Generalized estimating equations
were used in the analysis to account for multiple data
points being included from each imaging experiment.
A variability measure, defined as two times the stand-
ard deviation of the differences in MBF divided by the
range of the mean MBF values, was used to test the
variability of the MBF measures from each of the mea-
surement techniques. A one-way analysis of variance
test was used to determine if any of the groups were
significantly different at the 5% confidence level. Bon-
ferroni’s correction was used to adjust for multiple
comparisons.
RESULTS
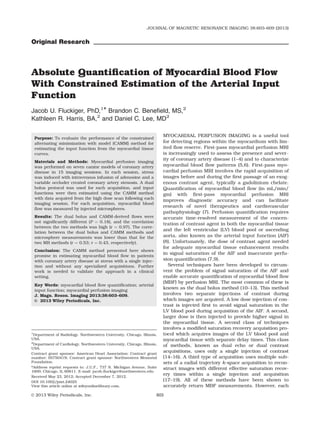
Example input functions from two animal studies are
shown in Figure 1. Visual inspection of the AIFs in
the left panel shows a high agreement between the
dbAIF and cAIF. The AIF obtained from the LV blood
pool of the full dose scan is also shown for compari-
son. In this example, the signal saturation due to the
concentration of contrast in the blood pool is appa-
rent. The region-averaged MBF results measured with
the dual-bolus method in this experiment were an av-
erage of 13% larger than those measured with the
CAMM method. In the example on the right panel, the
first-pass peak of the cAIF has a larger width and
Figure 1. Arterial input functions (AIFs) from two separate perfusion imaging scans. Panel (a) shows AIFs with high agree-
ment between the dual bolus method (red circles) and constrained alternating minimization with model (CAMM) method (blue
triangles). The AIFs in panel (b) are more different, with the CAMM-AIF dispersed in time with respect to the AIF from the
dual bolus method. In both panels the saturated signal from the full dose scan of the LV blood pool is shown for reference
(black dashes). [Color figure can be viewed in the online issue, which is available at wileyonlinelibrary.com.]
Quantification of MBF With Constrained Estimation 605
4. smaller peak value than that for the dbAIF. In this
experiment, the MBF results from the dual-bolus AIF
were, on average, 20% larger than those from the
CAMM AIF.
Figure 2a displays a scatter plot comparing the
region-averaged flow results from the dbAIF and the
cAIF. Overall these flow values have a high correlation
(r ¼ 0.97) and were not found to be significantly dif-
ferent at the 5% level (P ¼ 0.18). The linear fit between
the two methods was Flow (cAIF) ¼ 0.88 Flow (dbAIF)
þ 0.04. The 95% confidence interval (CI) for the slope
was (0.82–0.94), and (À0.07–0.16) for the intercept.
Figure 2b shows a Bland-Altman plot for the data
shown in Figure 2a. The mean MBF difference
between the two MR-based methods is À0.26 mL/
min/gm and the 95% confidence interval for this data
ranged from À0.90 to 0.38 mL/min/gm. The variabili-
ty of the MBF values for the two MR based methods
was 0.12 over the first half of the mean MBF values.
The variability for the second half of the data
increased slightly to 0.17.
Flow values from each AIF and the microsphere
analysis are shown in Figures 3 and 4. Figure 3a
shows the correlation between the flow values from
the dbAIF and the microsphere measurements. The
correlation for these flow values was lower than that
between the two MR-derived methods (r ¼ 0.53), with
a linear fit of Flow (dbAIF) ¼ 0.42 Flow (spheres) þ
1.20 (CI: slope [0.31–0.52], intercept [0.56–1.82]). The
flow values from the dual bolus method were signifi-
cantly lower than those from the microsphere meas-
urements (P ( 0.001). A corresponding Bland-Altman
plot for this data is shown in Figure 3b. The mean
MBF difference between these two methods is À0.48
mL/min/gm, with a 95% confidence interval ranging
from À3.99 to 3.02 mL/min/gm. Similar to the corre-
lation between the dbAIF and cAIF data, as the mean
MBF values increase, the absolute difference between
the two methods increases. The variability of the first
half of the mean MBF values is 0.94, which increases
to 0.96 in the second half. Similar results using the
estimated AIF are shown in Figure 4. The correlation
Figure 2. A scatter plot showing the flow values calculated with the dual bolus and CAMM methods (a). Six data points are
shown for each imaging session, corresponding to the region-averaged flows from a mid-ventricular slice. The line of best fit
is shown in red and the line of identity is shown in black for reference. b: A Bland-Altman plot showing the same data seen
in Figure 2a. The mean difference between the two methods is 0.06 mL/min/gm and is shown by the solid black line and the
95% confidence interval is shown in red.
Figure 3. A scatter plot showing the flow values calculated with the dual bolus method and microsphere measurements (a).
Six data points are shown for each imaging session, corresponding to the region-averaged flows from a mid-ventricular slice.
The line of best fit is shown in red and the line of identity is shown in black for reference. A Bland-Altman plot showing the
same data is also shown (b). The mean difference between the two methods is À0.48 mL/min/gm and is shown by the solid
black line and the 95% confidence interval is shown in red.
606 Fluckiger et al.
5. between the cAIF-derived flow values and the micro-
sphere flow was lower (r ¼ 0.42) than that for the
dbAIF, with a linear fit of Flow (cAIF) ¼ 0.34 Flow
(spheres) þ 1.20 (CI: slope [0.24–0.44], intercept
[0.59–1.82]). For both the dbAIF and cAIF methods,
the slopes and intercepts fall within the confidence
intervals of the other method. As with dbAIF flows,
the differences in flow between the cAIF and micro-
sphere results were significant (P ( 0.001). A Bland-
Altman plot for this data is shown in Figure 4b. The
mean MBF difference for this data is À0.50 mL/min/
gm, which is essentially equivalent to that from the
dbAIF MBF values. The 95% confidence interval for
this data ranges from À4.28 to 3.28 mL/min/gm. The
variability of the MBF values between the CAMM and
microsphere analyses decreases from 1.19 to 1.14
from the first half to the second half of the data.
DISCUSSION
This work presents preliminary results evaluating the
constrained alternating minimization with model
method for estimating the arterial input function and
quantifying myocardial blood flow in stress perfusion
MRI. Absolute flow values from the constrained esti-
mation method and the dual bolus method are com-
pared with each other, and both methods are com-
pared with fluorescent microsphere analysis.
In this work, we only consider myocardial blood flow
calculations from scans with pharmacologically
induced stress. In previous studies, the performance of
the unconstrained version of the proposed estimation
method has been shown to be related to the heterogene-
ity of the tissue time curves input into the algorithm
(28,29). In this implementation, an unsupervised
k-means algorithm is used to sort the available myocar-
dial tissue curves into clusters of similar shape and
magnitude to maximize the diversity of the myocardial
tissue curves. In addition, by imaging during stress, dif-
ferences in blood flow between well-perfused and poorly
perfused myocardial tissue are maximized (30).
Although the average MBF measurements calcu-
lated with the two AIF measurement methods were
not found to be significantly different, Figure 2a
shows that the line of best fit between the two meth-
ods suggests a trend toward underestimation of the
MBF using the CAMM method as compared to the
dual bolus AIF. As both the MR-based methods use
an identical modeling process to obtain MBF esti-
mates from the imaging data, these differences are
due solely to differences in the AIF between the two
methods. Several factors contribute to differences in
the AIF between the dual bolus and CAMM estima-
tion. As noted in previous studies with quantitative
perfusion measurements (17,20), differences in the
physiological state of the imaging subject between the
injections of the two boluses in the dual bolus method
may lead to incorrect AIF measurements for the full
dose scan. In addition, recent studies have shown
that the signal intensity within the myocardium may
be saturated at doses of contrast agent similar to
those used in this study (9,31,32). Signal saturation
in the myocardium would affect the CAMM estimation
as well as the MBF calculations for both the dbAIF
and cAIF. Further study is needed to determine
whether the estimated AIF has the potential to
improve quantitative flow measurements as compared
to the dual bolus approach.
Recent efforts have been made to develop a standar-
dized dual bolus injection scheme for use in quantita-
tive myocardial perfusion imaging (10,12). These
techniques have been shown to return reliable esti-
mates for the AIF, which can then be used to quantify
MBF in subjects. However, one disadvantage of the
dual bolus technique in the clinical setting is the need
to extend the infusion time of adenosine to perform
two first-pass acquisitions, which some patients can-
not tolerate. In addition, to ensure that both injec-
tions are of equal volume and injected at the same
rate, either two power injectors must be preloaded
with different dilutions of contrast and connected by a
Y-connector or a more complex preloading of contrast
within additional lengths of tubing must be used (10).
Figure 4. A scatter plot showing the flow values calculated with the CAMM method and microsphere measurements (a). Six data
points are shown for each imaging session, corresponding to the region-averaged flows from a mid-ventricular slice. The line of
best fit is shown in red and the line of identity is shown in black for reference. A Bland-Altman plot with the same data is also
shown (b). The mean difference between the two methods is À0.50 mL/min/gm and is shown by the solid black line and the 95%
confidence interval is shown in red. [Color figure can be viewed in the online issue, which is available at wileyonlinelibrary.com.]
Quantification of MBF With Constrained Estimation 607
6. The dual echo (17) and radial-based multiple echo
time methods (19) for obtaining AIF measurements
acquire the input function and myocardial signal in a
single acquisition, however, both require specialized
pulse sequences that cannot be applied retrospec-
tively. In contrast, the proposed CAMM estimation
method requires only a single injection of contrast
and can be applied retrospectively to any first-pass
perfusion data. In addition, unlike reference tissue
approaches, the CAMM method does not require any
healthy or normal reference tissues to estimate blood
flow.
One potential limitation in this implementation of
the AIF estimation is the simplistic saturation model
used to correct for the signal curve intensities. The LV
blood curve is assumed to be saturated at any signal
levels greater than one/third of the peak values of the
first-pass of the contrast agent. All portions of the
curve above this level are not considered in the esti-
mation. This threshold was tested in simulation and
showed to be adequate for the MR imaging protocol
used in this study. As mentioned above, signal satu-
ration will most strongly affect tissue curves with
large flow, as they will experience a larger concentra-
tion of contrast agent. This signal saturation will
affect all MR-based methods equally, but will not
affect microsphere analysis, which accounts for the
increased variability between the MR-based methods
and the microsphere analysis as a function of flow,
shown in Figures 3 and 4. Future implementations of
the estimation method should use a more sophisti-
cated signal saturation model for both the LV blood
pool and myocardial tissue curves similar to those
developed previously for use in perfusion imaging
(31,32). This type of implementation would have the
benefit of being able to correct for potential signal sat-
uration in both the LV blood pool and myocardial tis-
sue curves, which would allow for higher doses of
contrast, and thus increased signal to noise ratio, in
the image acquisition.
A second potential limitation in the CAMM method
used here is in the model used for the AIF. As shown
previously, using a functional form for the AIF serves
to reduce the impact of measurement noise and
restricts the number of free parameters that must be
estimated (33). This model has been shown to provide
reasonable fits to AIFs obtained with the dual bolus
method in the animal models presented here, as well
as in healthy human volunteers (20). However, in
patients with severe cardiac disease, particularly
those with poor ventricular function and low ejection
fraction, the AIF may be significantly dispersed with
respect to what is seen in healthy volunteers. The
ability of the CAMM method to reliably estimate the
AIF in these patient populations will depend in part
on the flexibility of the model to reflect physiological
changes in the AIF shape. Testing the CAMM method
in these patient populations is left to future work.
We also note that the CA doses used in the dual
bolus acquisitions presented here differ from those
previously used in animal experiments (10). This was
done to minimize the impact of measurement noise on
the low dose AIF, as well as to reduce the impact of
signal saturation on the myocardial tissue curves.
This work also did not implement any composite or
BIR-4 RF pulses, which have been shown to reduce
sensitivity to B0 or B1 inhomogeneity (34). As a
result, some the images may be affected by additional
artifact resulting in errors in the flow measurements.
In conclusion, the aim of this work was to test the
previously developed CAMM method for estimating
the AIF on perfusion images acquired during stress
with animal models of coronary artery disease and to
compare the quantitative flow results with those from
dual bolus perfusion imaging and microsphere fluo-
rescence. In 15 imaging sessions with seven canines,
the overall mean flow values as measured with the
CAMM method and the dual bolus method were not
significantly different. The CAMM method is able to
acquire MBF measurements with similar regression
results to those from the dual bolus method, can be
applied to data acquired with a single injection, and
can also be applied retrospectively to previously
acquired perfusion data. Further validation of the
CAMM method is needed to assess the utility of the
method in a clinical setting.
REFERENCES
1. Al-Saadi N, Nagel E, Gross M, et al. Noninvasive detection of
myocardial ischemia from perfusion reserve based on cardiovas-
cular magnetic resonance. Circulation 2000;101:1379–1383.
2. Greenwood JP, Maredia N, Younger JF, et al. Cardiovascular
magnetic resonance and single-photon emission computed to-
mography for diagnosis of coronary heart disease (CE-MARC): a
prospective trial. Lancet 2012;379:453–460.
3. Schwitter J, Nanz D, Kneifel S, et al. Assessment of myocardial
perfusion in coronary artery disease by magnetic resonance: a
comparison with positron emission tomography and coronary an-
giography. Circulation 2001;103:2230–2235.
4. Steel K, Broderick R, Gandla V, et al. Complementary prognostic
values of stress myocardial perfusion and late gadolinium
enhancement imaging by cardiac magnetic resonance in patients
with known or suspected coronary artery disease. Circulation
2009;120:1390–1400.
5. Lubbers DD, Janssen CH, Kuijpers D, et al. The additional value
of first pass myocardial perfusion imaging during peak dose of
dobutamine stress cardiac MRI for the detection of myocardial is-
chemia. Int J Cardiovasc Imaging 2008;24:69–76.
6. Panting JR, Gatehouse PD, Yang GZ, et al. Abnormal subendo-
cardial perfusion in cardiac syndrome X detected by cardiovascu-
lar magnetic resonance imaging. N Engl J Med 2002;346:
1948–1953.
7. Lee DC, Johnson NP. Quantification of absolute myocardial blood
flow by magnetic resonance perfusion imaging. JACC Cardiovasc
imaging 2009;2:761–770.
8. Gerber BL, Raman SV, Nayak K, et al. Myocardial first-pass per-
fusion cardiovascular magnetic resonance: history, theory, and
current state of the art. J Cardiovasc Magn Reson 2008;10:18.
9. Utz W, Niendorf T, Wassmuth R, Messroghli D, Dietz R, Schulz-
Menger J. Contrast-dose relation in first-pass myocardial MR
perfusion imaging. J Magn Reson Imaging 2007;25:1131–1135.
10. Christian TF, Aletras AH, Arai AE. Estimation of absolute myo-
cardial blood flow during first-pass MR perfusion imaging using a
dual-bolus injection technique: comparison to single-bolus injec-
tion method. J Magn Reson Imaging 2008;27:1271–1277.
11. Christian TF, Rettmann DW, Aletras AH, et al. Absolute myocar-
dial perfusion in canines measured by using dual-bolus first-
pass MR imaging. Radiology 2004;232:677–684.
12. Ishida M, Schuster A, Morton G, et al. Development of a univer-
sal dual-bolus injection scheme for the quantitative assessment
of myocardial perfusion cardiovascular magnetic resonance. J
Cardiovasc Magn Reson 2011;13:28.
608 Fluckiger et al.
7. 13. Patel AR, Antkowiak PF, Nandalur KR, et al. Assessment of
advanced coronary artery disease: advantages of quantitative car-
diac magnetic resonance perfusion analysis. JACC 2010;56:
561–569.
14. Kim D, Axel L. Multislice, dual-imaging sequence for increasing
the dynamic range of the contrast-enhanced blood signal and
CNR of myocardial enhancement at 3T. J Magn Reson Imaging
2006;23:81–86.
15. Breton E, Kim D, Chung S, Axel L. Quantitative contrast-
enhanced first-pass cardiac perfusion MRI at 3 tesla with accu-
rate arterial input function and myocardial wall enhancement. J
Magn Reson Imaging 2011.
16. Gatehouse PD, Elkington AG, Ablitt NA, Yang GZ, Pennell DJ,
Firmin DN. Accurate assessment of the arterial input function
during high-dose myocardial perfusion cardiovascular magnetic
resonance. J Magn Reson Imaging 2004;20:39–45.
17. Kim TH, Pack NA, Chen L, DiBella EV. Quantification of myocar-
dial perfusion using CMR with a radial data acquisition: compari-
son with a dual-bolus method. J Cardiovasc Magn Reson 2010;
12:45.
18. Adluru G, McGann C, Speier P, Kholmovski EG, Shaaban A,
Dibella EV. Acquisition and reconstruction of undersampled ra-
dial data for myocardial perfusion magnetic resonance imaging. J
Magn Reson Imaging 2009;29:466–473.
19. Kholmovski EG, DiBella EV. Perfusion MRI with radial acquisi-
tion for arterial input function assessment. Magn Reson Med
2007;57:821–827.
20. Fluckiger JU, Schabel MC, DiBella EV. Constrained estimation of
the arterial input function for myocardial perfusion cardiovascu-
lar magnetic resonance. Magn Reson Med 2011;66:419–427.
21. Lee DC, Simonetti OP, Harris KR, et al. Magnetic resonance ver-
sus radionuclide pharmacological stress perfusion imaging for
flow-limiting stenoses of varying severity. Circulation 2004;110:
58–65.
22. Jerosch-Herold M, Swingen C, Seethamraju RT. Myocardial blood
flow quantification with MRI by model-independent deconvolu-
tion. Med Phys 2002;29:886–897.
23. Pack NA, DiBella EV. Comparison of myocardial perfusion esti-
mates from dynamic contrast-enhanced magnetic resonance
imaging with four quantitative analysis methods. Magn Reson
Med 2010;64:125–137.
24. Schabel MC, Fluckiger JU, DiBella EV. A model-constrained
Monte Carlo method for blind arterial input function estimation
in dynamic contrast-enhanced MRI: I. Simulations. Phys Med
Biol 2010;55:4783–4806.
25. Tofts PS, Brix G, Buckley DL, et al. Estimating kinetic parame-
ters from dynamic contrast-enhanced T(1)-weighted MRI of a dif-
fusable tracer: standardized quantities and symbols. J Magn
Reson Imaging 1999;10:223–232.
26. Glenny RW, Bernard S, Brinkley M. Validation of fluorescent-la-
beled microspheres for measurement of regional organ perfusion.
J Appl Physiol 1993;74:2585–2597.
27. Bland JM, Altman DG. Statistical methods for assessing agree-
ment between two methods of clinical measurement. Lancet
1986;1:307–310.
28. Fluckiger JU, Schabel MC, DiBella EV. Toward local arterial
input functions in dynamic contrast-enhanced MRI. J Magn
Reson Imaging 2010;32:924–934.
29. Riabkov DY, Di Bella EV. Estimation of kinetic parameters with-
out input functions: analysis of three methods for multichannel
blind identification. IEEE Trans Biol Eng 2002;49:1318–1327.
30. Karamitsos TD, Ntusi NA, Francis JM, Holloway CJ, Myerson SG,
Neubauer S. Feasibility and safety of high-dose adenosine perfu-
sion cardiovascular magnetic resonance. J Cardiovasc Magn
Reson 2010;12:66.
31. Cernicanu A, Axel L. Theory-based signal calibration with single-
point T1 measurements for first-pass quantitative perfusion MRI
studies. Acad Radiol 2006;13:686–693.
32. Hsu LY, Kellman P, Arai AE. Nonlinear myocardial signal inten-
sity correction improves quantification of contrast-enhanced first-
pass MR perfusion in humans. J Magn Reson Imaging 2008;27:
793–801.
33. Fluckiger JU, Schabel MC, Dibella EV. Model-based blind estima-
tion of kinetic parameters in dynamic contrast enhanced (DCE)-
MRI. Magn Reson Med 2009;62:1477–1486.
34. Kim D, Cernicanu A, Axel L. B(0) and B(1)-insensitive uniform T(1)-
weighting for quantitative, first-pass myocardial perfusion magnetic
resonance imaging. Magn Reson Med 2005;54:1423–1429.
Quantification of MBF With Constrained Estimation 609