1. Crowd-sourcing data and quality control:
OSM roads validation in low-income countriesKim-Blanco, Paola1
; Cîrlugea, Bogdan-Mihai2
; de Sherbinin, Alex3
1
Center for International Earth Science Information Network (CIESIN), Columbia University.
2
École Polytechnique Fédérale de Lausanne (EPFL)
3
CIESIN, Columbia University; CODATA Task Group for Global Roads Data Development.
April 6th, 2016.
In this study we develop five test diagnostics to assess completeness, positional accuracy, and overall
reliability of the road network in four West African countries. Completeness will be assessed using three
methods: discrete classification, spatial regression, and inter- settlement connectivity analysis. Posi-
tional accuracy will be tested at randomly selected road intersections, and assessed against imagery
from Google Earth. Overall reliability will be determined by comparing versioning of road features, as a
lineage parameter, against previously obtained positional results. We expect to find fairly complete road
datasets; high positional accuracy in all four countries; and a positive association between versioning
and positional accuracy, which may determine the level of overall reliability in a given dataset.
With more than 2 million registered users, OSM is arguably the most successful Volunteered Geographic
Information (VGI) product in the world. Content can easily be added or edited through a wiki-like inter-
face or by the use of standalone packages for common GIS software. OSM relies on the crowd to adhere
to certain standards and to self-correct, but there is no official validation procedure. Although the OSM
community keeps developing sophisticated error detection tools, error correction has to be done on a
feature-by-feature basis. This has generated interest in the research community to validate OSM roads
data, both to understand if the self-correction mechanisms inherent to VGI actually work, and in order to
determine the OSM’s fitness for use in research, policy, humanitarian or other contexts.
4- Positional accuracy
Method: A multi-stage stratified sampling strategy was used based on urban/ rural classification: ran-
domly selected units from each group were identified for analysis; and 10 randomly selected road in-
tersections (point features) per administrative unit were extracted for comparison. Random points were
visually inspected in Google Earth, where an ‘intersection match’ was identified. Distances between
OSM intersections and the corresponding match from Google Earth were calculated. Urban, rural, and
national RMSE values were computed. See table 1.
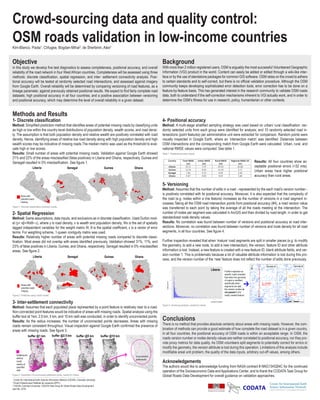
1- Discrete classification
Method: Simplified prediction method that identifies areas of potential missing roads by classifying units
as high or low within the country-level distributions of population density, wealth scores, and road densi-
ty. The assumption is that both population density and relative wealth are positively correlated with road
density. Hence, identifying areas of relative low road density along with high population density and high
wealth scores may be indicative of missing roads.The median metric was used as the threshold to eval-
uate high or low scores.
Results: Small number of areas with potential missing roads. Validation against Google Earth showed
21% and 22% of the areas misclassified (false positives) in Liberia and Ghana, respectively. Guinea and
Senegall resulted in 0% misclssification. See figure 1. Results: All four countries show ac-
ceptable positional errors (<32 mts).
Urban areas have higher positional
accuracy than rural areas.
2- Spatial Regression
Method: Same assumptions, data inputs, and exclusions as in discrete classification. Used Durbin mod-
el (y= xβ+Wxθ+ ε), where y is road density, x is wealth and population density, Wx is the set of spatially
lagged independent variables for the weight matrix W, θ is the spatial coefficient, ε is a vector of error
terms. For weighting scheme, 1-queen contiguity matrix was used.
Results: Relatively higher number of areas with potential missing roads compared to discrete classi-
fication. Most areas did not overlap with areas identified previously. Validation showed 31%, 11%, and
23% of false positives in Liberia, Guinea, and Ghana, respectively. Senegal resulted in 0% misclassified
areas. See figure 2.
3- Inter-settlement connectivity
Method: Assumes that each populated place represented by a point feature is relatively near to a road.
Non-connected point features would be indicative of areas with missing roads. Spatial analysis using the
buffer tool at 1km, 2.5 km, 5 km, and 10 km radii was conducted, in order to identify unconnected points.
Results: As the radius increases, the number of unconnected points decreases. Areas with missing
roads remain consistent throughout. Visual inspection against Google Earth confirmed the presence of
areas with missing roads. See figure 3.
Acknowledgements
The authors would like to acknowledge funding from NASA contract # NNG13HQ04C for the continued
operation of the Socioeconomic Data and Applications Center, and to thank the CODATATask Group for
Global Roads Data Development for overall guidance on validation approaches.
Conclusions
There is no method that provides absolute certainty about areas with missing roads. However, the com-
bination of methods can provide a good estimate of how complete the road dataset is in a given country.
In all four countries, the positional accuracy of OSM roads is within an acceptable range. In OSM, the
roads version number or nodes density values are neither correlated to positional accuracy, nor they pro-
vide proxy metrics for data quality. As OSM volunteers split segments to potentially correct for errors or
modify the geometry, the version attribute is lost during this operation. Limitations of this analysis include
modifiable areal unit problem, the quality of the data inputs, arbitrary cut-off values, among others.
5- Versioning
Method: Assumes that the number of edits in a road --represented by the each road’s version number--
is positively correlated with its positional accuracy. Moreover, it is also expected that the complexity of
the road (e.g. nodes within a line feature) increases as the number of versions in a road segment in-
creases.Taking all the OSM road intersection points from positional accuracy (#4), a road version value
was transferred to each point by taking the average of all the roads meeting at the intersection. The
number of nodes per segment was calculated in ArcGIS and then divided by road length, in order to get
standardized node density values.
Results: No correlation was found between number of versions and positional accuracy at road inter-
sections. Moreover, no correlation was found between number of versions and node density for all road
segments, in all four countries. See figure 4.
Further inspection revealed that when ‘mature’ road segments are split in smaller pieces (e.g. to modify
the geometry, to add a new node, to add a new intersection), the version, feature ID and other attribute
information is lost. Instead, a new feature is created with a new feature ID, blank attribute fields, and ver-
sion number 1. This is problematic because a lot of valuable attribute information is lost during this pro-
cess, and the version number of the ‘new’ feature does not reflect the number of edits done previously.
Objective Background
Methods and Results
Figure 1. Discrete classification prediction results.
Figure 2. Prediction using Durbin model.
Figure 3. Distribution of unconnected settlement points, results for Ghana.
Table 1. Positional accuracy results
Figure 4. Versioning analysis, results for Liberia.