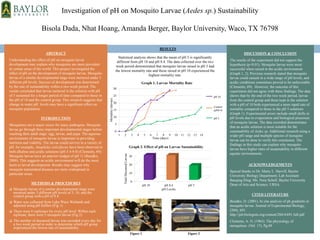
1. Statistical analysis shows that the mean of pH 5 is significantly
different from pH 10 and pH 8.4. The data collected over the two
week period demonstrated that mosquito larvae raised in pH 5 had
the lowest mortality rate and those raised in pH 10 experienced the
highest mortality rate.
Investigation of pH on Mosquito Larvae (Aedes sp.) Sustainability
Bisola Dada, Nhat Hoang, Amanda Berger, Baylor University, Waco, TX 76798
ABSTRACT
Understanding the effect of pH on mosquito larval
development may explain why mosquitos are more prevalent
in certain areas of the world. This project investigated the
effect of pH on the development of mosquito larvae. Mosquito
larvae of a similar developmental stage were nurtured under 3
different pH levels. Success of development was determined
by the rate of sustainability within a two week period. The
results concluded that larvae nurtured in the solution with pH
of 5 sustained for a longer period of time compared to those in
the pH of 10 and the control group. This research suggests that
change in water pH levels may have a significant effect on
mosquito population.
INTRODUCTION
Mosquitoes are a major vector for many pathogens. Mosquito
larvae go through three important developmental stages before
reaching their adult stage: egg, larvae, and pupa. The aqueous
environment of mosquito larvae is important in providing
nutrition and viability. The larvae could survive in a variety of
pH, for example, Anopheles culicifacies have been observed in
both alkaline and acidic solutions (pH 5.4-9.8) (Clements, 69).
Mosquito larvae have an anterior midgut of pH 11 (Boudko,
2000). This suggests an acidic environment will do the most
harm to larval development. Results may suggest why
mosquito transmitted diseases are more widespread in
particular areas.
METHODS & PROCEDURES
Mosquito larvae of a similar developmental stage were
nurtured under 3 different pH levels of 5, 10, and the
control group with a pH of 8.4.
Water was collected from Lake Waco Wetlands and
adjusted using pH buffers (Fig 1).
There were 6 replicates for every pH level. Within each
replicate, there were 5 mosquito larvae (Fig 2).
The number of deceased larvae was recorded every day for
a two week period in order to determine which pH group
experienced the lowest rate of sustainability.
DISCUSSION & CONCLUSION
The results of the experiment did not support the
hypothesis (p<0.01). Mosquito larvae were most
successful when raised in the acidic environment
(Graph 1, 2). Previous research stated that mosquito
larvae could sustain in a wide range of pH levels, and
acidic conditions sometimes proved to be unfavorable
(Clements, 69). However, the outcome of this
experiment did not agree with these findings. The data
shows that by the end of the two week period, larvae
from the control group and those kept in the solution
with a pH of 10 both experienced a more rapid rate of
mortality compared to those in the pH 5 solutions
(Graph 1). Experimental errors include small shifts in
pH levels due to evaporation and biological processes
of mosquito larvae. The data recorded demonstrates
that an acidic solution is most suitable for the
sustainability of Aedes sp. Additional research using a
wider pH range and multiple species of mosquito
larvae can be done to verify this conclusion. The
findings in this study can explain why mosquito
larvae have higher rates of sustainability in different
aquatic environments.
ACKNOWLEDGEMENTS
Special thanks to Dr. Marty L. Harvill, Baylor
University Biology Department; Lab Assistant
Baoqing Ding; Ms. Nora Schell; Baylor University
Dean of Arts and Science; URSA.
CITED LITERATURE
Boudko, D. (2001). In situ analysis of ph gradients in
mosquito larvae. Journal of Experimental Biology,
(204), 691.
http://jeb.biologists.org/content/204/4/691.full.pdf
Clements, A. N. (1963). The physiology of
mosquitoes. (Vol. 17). Pg.69
0
5
10
15
20
25
30
1 2 3 4 5 6 7 8 9 10 11 12 13 14
Mortality(larvae)
Time (days)
Graph 1. Larvae Mortality Rate
pH 5
pH 10
Control
(pH8.4)
RESULTS
0
10
20
30
pH 10 pH 8.4 pH 5
TotalDeceasedLarvae
pH Levels
Graph 2. Effect of pH on Larvae Sustainability
Figure 1 Figure 2