ANTsX: A dynamicecosystem for quantitative biological and
medical imaging
https://www.medrxiv.org/content/10.1101/2020.10.19.20215392v2
(https://www.medrxiv.org/content/10.1101/2020.10.19.20215392v2.full.pdf)
https://github.com/ANTsX
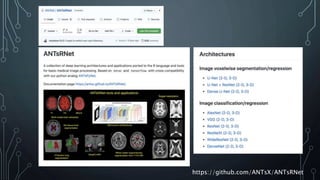
Advanced Normalization Tools Ecosystem
ANTsRNet
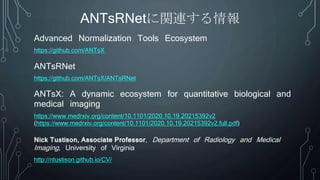
ANTsRNetに関連する情報
https://github.com/ANTsX/ANTsRNet
Nick Tustison, Associate Professor, Department of Radiology and Medical
Imaging, University of Virginia
http://ntustison.github.io/CV/
(画像処理・解析関連)
magick: Advanced Graphicsand Image-Processing in R
nat: NeuroAnatomy Toolbox for Analysis of 3D Image Data
Bioi: Biological Image Analysis
bioimagetools: Tools for Microscopy Imaging
OpenImageR: An Image Processing Toolkit
image.LineSegmentDetector: Detect Line Segments in Images
SuperpixelImageSegmentation: Superpixel Image Segmentation
adimpro: Adaptive Smoothing of Digital Images
autothresholdr: An R Port of the 'ImageJ' Plugin 'Auto Threshold'
bayesImageS: Bayesian Methods for Image Segmentation using a Potts Model
downscaledl: Downscale of RS Images using Deep Learning
edci: Edge Detection and Clustering in Images
imagine: IMAGing engINEs, Tools for Application of Image Filters to Data Matrices
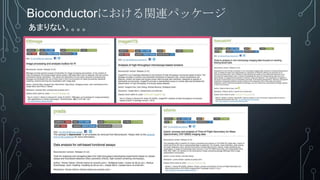
CRANにおける関連パッケージ(1)
たくさんある!


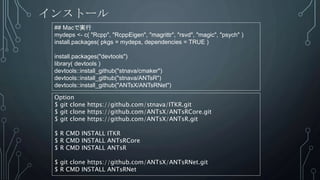
![実行環境
## 実行環境 ##
macOS Catalina 10.15.4
R version 4.0.2 (2020-06-22)
RStudio Version 1.2.5033
$ brew config
HOMEBREW_VERSION: 2.4.16
ORIGIN: https://github.com/Homebrew/brew
HEAD: 2a4c9f610e69b9fed1eec61ac2c53e4b11a32e4c
Last commit: 3 months ago
Core tap ORIGIN: https://github.com/Homebrew/homebrew-core
Core tap HEAD: 57a5081f9893f0a803a9e2bd1e01da0a48c39d45
Core tap last commit: 3 months ago
Core tap branch: master
HOMEBREW_PREFIX: /usr/local
HOMEBREW_CASK_OPTS: []
HOMEBREW_MAKE_JOBS: 8
CPU: octa-core 64-bit kabylake
Homebrew Ruby: 2.6.3 =>
/System/Library/Frameworks/Ruby.framework/Versions/2.6/usr/bin/
ruby
Clang: 11.0 build 1103
Git: 2.24.1 => /Library/Developer/CommandLineTools/usr/bin/git
Curl: 7.64.1 => /usr/bin/curl
macOS: 10.15.4-x86_64
CLT: 11.4.0.0.1.1583798712
Xcode: N/A](https://image.slidesharecdn.com/201209biopackathon12thv03-201209112544/85/201209-Biopackathon-12th-22-320.jpg)
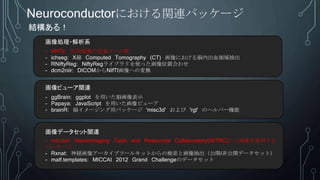
![データ準備/前処理
library( ANTsR )
library( ANTsRNet )
library( keras )
#チュートリアルデータセットの読み込み
imageIDs <- c( "r16", "r27", "r30", "r62", "r64", "r85" )
trainingBatchSize <- length( imageIDs )
# 3組織ラベルのセグメンテーション
segmentationLabels <- c( 1, 2, 3 )
numberOfLabels <- length( segmentationLabels )
initialization <- paste0( 'KMeans[', numberOfLabels, ']' )
#画像データの読み込み
domainImage <- antsImageRead( getANTsRData( imageIDs[1] ) )
# (NA)空のアレイデータの準備
X_train <- array( data = NA, dim = c( trainingBatchSize, dim( domainImage ), 1 ) )
Y_train <- array( data = NA, dim = c( trainingBatchSize, dim( domainImage ) ) )](https://image.slidesharecdn.com/201209biopackathon12thv03-201209112544/85/201209-Biopackathon-12th-24-320.jpg)
![#画像データの読み込み
images <- list()
segmentations <- list()
for( i in seq_len( trainingBatchSize ) ){
cat( "Processing image", imageIDs[i], "n" )
image <- antsImageRead( getANTsRData( imageIDs[i] ) )
mask <- getMask( image )
segmentation <- atropos( image, mask, initialization )$segmentation
X_train[i,,,1] <- as.array( image )
Y_train[i,,] <- as.array( segmentation )
}
# Yデータセットのラベルデータに変換
Y_train <- encodeUnet( Y_train, segmentationLabels )
# ノーマライゼーション
X_train <- ( X_train - mean( X_train ) ) / sd( X_train )
画像読み込み/ノーマライズ](https://image.slidesharecdn.com/201209biopackathon12thv03-201209112544/85/201209-Biopackathon-12th-25-320.jpg)
![#画像確認
str(X_train)
str(Y_train)
image(X_train[1,,,])
image(Y_train[1,,,1,1])
image(Y_train[1,,,2,1])
image(Y_train[1,,,3,1])
> str(X_train)
num [1:6, 1:256, 1:256, 1] -0.596 -0.596 -0.596 -0.596 -0.596 ...
> str(Y_train)
num [1:6, 1:256, 1:256, 1:3, 1:3] 0 0 0 0 0 0 0 0 0 0 ...
https://akira3132.info/cerebral_cortex.html](https://image.slidesharecdn.com/201209biopackathon12thv03-201209112544/85/201209-Biopackathon-12th-26-320.jpg)


![track <- model %>% fit( X_train, Y_train,
epochs = 20, batch_size = 5, verbose = 1, shuffle = TRUE,
callbacks = list(
callback_model_checkpoint( "unetModelInterimWeights.h5",
monitor = 'val_loss', save_best_only = TRUE ),
callback_reduce_lr_on_plateau( monitor = "val_loss", factor = 0.1 )
), validation_split = 0.2 )
モデルのフィット
Train on 4 samples, validate on 2 samples
Epoch 1/20
4/4 [==============================] - 4s
884ms/sample - loss: -0.5779 - multilabel_dice_coefficient: 0.5779
- val_loss: -0.5809 - val_multilabel_dice_coefficient: 0.5809
Epoch 2/20
4/4 [==============================] - 2s
568ms/sample - loss: -0.5801 - multilabel_dice_coefficient: 0.5801
- val_loss: -0.5835 - val_multilabel_dice_coefficient: 0.5835
Epoch 3/20
4/4 [==============================] - 2s
553ms/sample - loss: -0.5827 - multilabel_dice_coefficient: 0.5827
- val_loss: -0.5864 - val_multilabel_dice_coefficient: 0.5864
Epoch 4/20
4/4 [==============================] - 2s
573ms/sample - loss: -0.5856 - multilabel_dice_coefficient: 0.5856
- val_loss: -0.5895 - val_multilabel_dice_coefficient: 0.5895
Epoch 5/20
4/4 [==============================] - 2s
622ms/sample - loss: -0.5888 - multilabel_dice_coefficient: 0.5888
- val_loss: -0.5925 - val_multilabel_dice_coefficient: 0.5925
Epoch 6/20
4/4 [==============================] - 2s](https://image.slidesharecdn.com/201209biopackathon12thv03-201209112544/85/201209-Biopackathon-12th-29-320.jpg)


![[AI08] 深層学習フレームワーク Chainer × Microsoft で広がる応用](https://cdn.slidesharecdn.com/ss_thumbnails/ai08-170705031536-thumbnail.jpg?width=640&height=640&fit=bounds)


![[DL輪読会]Freehand-Sketch to Image Synthesis 2018](https://cdn.slidesharecdn.com/ss_thumbnails/hozumi110918-181109001844-thumbnail.jpg?width=640&height=640&fit=bounds)


