BizViz Analytics workflow
•Download as PPTX, PDF•
1 like•1,046 views

BizViz (www.bdbizviz.com), is an Enterprise ready platform that delivers Analytics, Mobility, and Security on the Cloud. It can be extended to build applications very quickly. Most of BizViz's customers use it as a cloud based Analytics platform. However, a few of our customers have developed business applications on top of the BizViz platform so that they can leverage its full potential.

Recommended
Recommended
More Related Content
What's hot
What's hot (20)
Similar to BizViz Analytics workflow
Similar to BizViz Analytics workflow (20)
Recently uploaded
Recently uploaded (20)
BizViz Analytics workflow
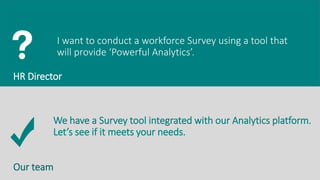
- 1. I want to conduct a workforce Survey using a tool that will provide ‘Powerful Analytics’. We have a Survey tool integrated with our Analytics platform. Let’s see if it meets your needs. HR Director Our team
- 2. Select the ‘Survey’ Plug-in from platform services Highlights of our Survey product
- 3. Design a Survey by Drag & Drop of various types of questions. This is a breeze.Design a Survey by Drag & Drop of various types of questions. This is a breeze.
- 4. Can I take my Survey via the Web and Mobile devices? Also, I want to set some parameters to have tight control. Yes, our product is device independent. “Create once publish anywhere “. All basic control parameters are available.
- 5. Once created, you can publish the survey and set the start/end date for your survey and control various Parameters
- 6. iPhoneiPadNow people can take a survey from any device Laptop
- 7. I have few Benchmark Parameters in my mind. How can I use them to evaluate the survey results? Our product has a Benchmarking Section.
- 8. To create a Benchmark, Select ‘Benchmark List’ from the drop down list You can then set the Benchmarking Parameters that you have in mind.
- 9. As employees are taking the survey, can my executive team view the benchmark analysis in real-time? Yes this is a built-in feature, and you also have the ability to show or hide the results from employees.
- 10. Select ‘Benchmark Analysis’ from the dropdown list Select the Benchmark Goal you want to analyse You can now view the benchmark during run-time
- 11. All Benchmark Parameters shown together to give an Overall Sense of the Employee Survey
- 12. The Benchmarking feature is great, but can I drill down and filter results on Gender, years of employment and other permutations and combinations? Why not? It allows 5 layers of Drilling.
- 13. 2 Filters have been selected to Benchmark 2 Filters have been selected to Benchmark
- 14. Now 4 filters have been applied. You can see that ‘Training effectiveness index’ has dropped
- 15. I want to see the entire result of the survey and want to present deeper Analytics to the Executive Team Yes, that is easy with our tool. We are experts in Analytics.
- 16. You can view all Responses, Comments and Analytics
- 17. There is an integrated BizViz charting framework
- 18. Different question types will offer different charting options
- 19. You can export data to Excel or to the platform’s cloud database for deeper analysis
- 20. Oh no, my HR VP want to see the survey results in relation to other key HR parameters such as Attrition, Vacancies, and Satisfaction Index over the last 5 years! Okay, let’s use another Plugin – ‘Business Views’, that will help you create forms by bringing in key metric data from different teams.
- 21. on
- 22. Enter and view data via forms
- 23. It would be great if the forms were available on the iPad. The Recruitment Team, Attrition Management Team, and others could then input their data from anywhere. You can publish and access your forms on mobile devices, desktops, & tablets.
- 24. The ‘Employee Information Form’ is Published in the HR Folder
- 25. The HR Folder contains all published forms
- 26. • Forms can be accessed and viewed using portal and mobile devices. • Users can enter the data from anywhere with ease.
- 27. Good. Do you have any Plugin to connect to various sources and create Dashboards, like other Popular tools? Yes we have a Web-based HTML5 Dashboard Designer that connects to all industry standard databases.
- 28. Launch the Designer by Selecting ‘Dashboard Designer’ from the Platform. Create or Modify a Dashboard. This can connect with any sort of Data and accepts Restful and SOAP Web services. Dashboard Designer is unique tool in our product.
- 29. A rich set of 60+ Visualization components– Charts, Grids, Filters, Combo-boxes, etc... are available to tell your business story. [Custom Components are also possible].
- 30. Q - Once developed, Publish the dashboard onto the Portal to view analytics. Now this is available in the section where Forms were available. The Dashboard is Published and ready to be viewed.
- 31. I like this. Show me analytics in your dashboard using multiple filters, gauges, heat-maps, trend lines, score- cards, and mixed charts? Yes, you can track all of your KPI’s from dashboards and view analytics on Mobile Devices as well. Once Published, they are available anywhere. The better the design, the deeper the business story.
- 32. Shows the KPI and dashboard of relationship with supervisor. It can talk about mental matching of the Workforce and Organization
- 33. Showing the KPI and dashboard of work environment. It can talk about mental matching of Workforce and Organization Shows trends of employee satisfaction, teamwork, and effectiveness over last 5 years, as the number of employees increases or decreases. The data is coming from Surveys, Forms, and internal HR databases
- 34. Dashboard on the iPad App
- 36. This sounds interesting. Oh! I just realized that we haven’t done any analysis on the text feedback given by our employees. What are their Sentiments? I want to get a good overall feel of my Organization? Yes, you can quickly perform Text Analytics using the products Sentiment Analyser (SA) Plug-in. This will give you the overall feel of your workforce’s emotions.
- 37. Select Sentiment Analyzer from the list You can view sentiments based on the comments filled in your survey. You need to bring all of it into the platform to see their combined effect. Otherwise see question based Sentiments on the ‘Survey Results’ page.
- 38. Q - The Heat map shows the intensity of emotions within each quadrant. In this case, employees are happy but lacking passion. This view is better than a thousand words.
- 39. This Tag Cloud displays the most common words from the survey. Bigger font size indicates higher count This Pie chart shows the break up of the emotions into four sections.
- 40. Can I analyze sentiments specific to a particular department or sentiment on a specific question? I would like to apply filters here as well (Gender, Age-group, Race, Country, etc…) Yes, SA is integrated with our Survey, making it one of the best Survey products around. Filters are dependent on your Survey design -- if your survey has these filter questions, this is possible.
- 41. Q - You can see the sentiment analytics feedback on Senior Management. Zoom feature is available.
- 42. So far so good, but now the HR VP wants me to plot Attrition data on Google Maps. He says Geospatial Analytics is a hot trend now. Is that possible with your platform, and if so, how quickly can it be done? You can quickly plot Geospatial analysis and view Global data on Google Maps or Leaflets.
- 43. Select the region to drill further You can see detailed information for South Carolina in the given figures. Clicking on a location provides that location’s details.
- 44. The executive team was happy with the analytics, but now the CEO wants to see the ‘Churn Analysis over the next 3 years’. Does your platform have predictive capabilities which our data science team can use? With our predictive tool you can do predictive analysis using standard and custom algorithms. Once your Data Science team designs Custom Algorithms, they can be saved and used by BI teams.
- 45. Select Predictive analysis from the list Drag and Drop the data source you wish to analyse.
- 46. You can filter required columns from here Drag & Drop ‘Filter’ for Data Preparation
- 47. Drag & Drop the required algorithm Configure required advanced properties
- 48. Configure required properties to run the predictive model
- 49. Here your Data Scientist can write custom script as per the business requirement & get desired output Saved Custom Script can now be used by BI team for different sort of Analytics.
- 50. You can write the output results to the database for further analysis using Dashboard Designer If you want to apply standard Algorithms, use the given algorithms. If your data science team is coming with new Algorithms then save them as CustomRScript & use them internally.
- 51. You can plot the results of predictive analysis in your dashboard This chart displays the predictive analysis
- 52. Wow! I have Predictive Analysis, Geospatial Analysis, Real- time Benchmarking, Push and Pull Analytics in Dashboards, Sentiment Analysis, and Survey capabilities all in one Product!! Which Product is this? This is a Analytics platform designed to give a 360 degree view of Your Data – Business, Employees, Partners, Vendors, & Competitors using structured and unstructured sources. We Are
- 53. Big Data BizViz LLC Mobility, Big Data, & Analytics on a Cloud-based Platform www.bdbizviz.com
- 54. Wow!! Your team took only 5 days to give me 360 degree view. Our CEO was very pleased to see the Survey and Analytics on the iPad. He even used the Work Board feature to ask questions to each of the department heads. Yes, our Work Board provides the ability to share. The aim is to give Executives access to everything via their iPads.
- 55. Q - You can narrow down to the portion you wish to talk about. In this example, analysis of Female employees with 3-5 yrs of experience is shown. Executives can select specific data points and write their comments about them.
- 56. You can then share your feedback with your peers via Mail, Message, Print, etc…
- 57. This is an amazing product!! I haven’t seen any other product in the market that offers all of these features. But I’ve never heard of you. Who are you? BizViz is a New York based start-up, started by a set of 20 Entrepreneurs & Intrapreneurs with an average BI & Analytics exposure of over 14 years.
- 58. Okay, but is your product scalable? – Can you deploy this solution for hundreds, thousands, or even tens of thousands of users? Can you take care of all the customization, maintenance, and hosting on the cloud? Absolutely!! We have all the necessary skills. See the core architecture diagram.
- 59. Scalability is all about a model that has the capability to perform under an increased or expanding workload: BizViz platform is built on OSGI framework for better scalability Installing and Uninstalling applications can be performed with ease It Supports SMAC ( Social Media, Mobile, Analytics and Cloud) Platforms
- 60. BizViz is competitively priced in product licenses and SaaS, and in service costs we offer benefits to customers since we have an 100+ team of BI professionals at our Off-shore center. What is the pricing for your product and services and how does it compare to your competitors? Also, do you have a large enough team to support your product?
- 61. Yes, we have 20+ International Customers using our solution, including Large Enterprises and SMEs. For more details, please click on the following link: http://www.bdbizviz.com/customers.html?id=0# For further questions, please contact our Sales Team at sales@bdbizviz.com Do you have any Customer Success Stories?
Editor's Notes
- Need to put the degree symbol next to 360. Put a proper arrow symbol at the end