More Related Content Similar to SEC FDOTM Prices December 2017 (20) 1. MILLER AND LENTS, GLOBAL OIL AND GAS CONSULTANTS
2017 Calendar Year
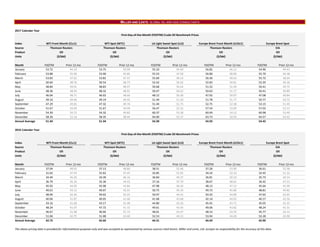
First‐Day‐of‐the‐Month (FDOTM) Crude Oil Benchmark Prices
Index WTI Front Month (CLc1) WTI Spot (WTC) LA Light Sweet Spot (LLS) Europe Brent Front Month (LCOc1) Europe Brent Spot
Source Thomson Reuters Thomson Reuters Thomson Reuters Thomson Reuters EIA
Product Oil Oil Oil Oil Oil
Units ($/bbl) ($/bbl) ($/bbl) ($/bbl) ($/bbl)
Month FDOTM Prior 12‐mo FDOTM Prior 12‐mo FDOTM Prior 12‐mo FDOTM Prior 12‐mo FDOTM Prior 12‐mo
January 53.72 44.14 53.75 43.99 55.10 45.69 56.82 46.12 54.96 44.43
February 53.88 45.99 53.90 45.85 55.53 47.58 56.80 48.00 55.79 46.38
March 53.83 47.61 53.82 47.47 55.60 49.14 56.36 49.63 55.72 48.04
April 50.60 48.76 50.54 48.73 52.42 50.42 52.83 50.81 52.20 49.36
May 48.84 49.01 48.83 48.97 50.68 50.64 51.52 51.09 50.41 49.75
June 48.36 48.95 48.32 48.91 50.47 50.62 50.63 51.17 50.41 49.89
July 46.04 48.71 46.02 48.66 48.12 50.38 47.92 50.97 47.08 49.84
August 49.16 49.46 49.19 49.42 51.49 51.20 51.78 51.77 50.77 50.72
September 47.29 49.81 47.32 49.76 51.40 51.75 52.75 52.38 53.15 51.40
October 51.67 50.09 51.67 50.09 56.47 52.32 57.54 53.09 57.02 52.13
November 54.30 50.73 54.32 49.82 60.37 53.38 60.49 54.12 60.98 53.40
December 58.36 51.34 58.35 48.94 64.00 52.27 63.73 54.93 64.57 54.42
Annual Average 51.34 51.34 54.30 54.93 54.42
2016 Calendar Year
First‐Day‐of‐the‐Month (FDOTM) Crude Oil Benchmark Prices
Index WTI Front Month (CLc1) WTI Spot (WTC) LA Light Sweet Spot (LLS) Europe Brent Front Month (LCOc1) Europe Brent Spot
Source Thomson Reuters Thomson Reuters Thomson Reuters Thomson Reuters EIA
Product Oil Oil Oil Oil Oil
Units ($/bbl) ($/bbl) ($/bbl) ($/bbl) ($/bbl)
Month FDOTM Prior 12‐mo FDOTM Prior 12‐mo FDOTM Prior 12‐mo FDOTM Prior 12‐mo FDOTM Prior 12‐mo
January 37.04 48.93 37.13 48.80 38.51 52.48 37.28 53.90 36.61 52.58
February 31.62 47.54 31.62 47.45 32.85 51.05 34.24 52.33 32.45 51.32
March 34.40 46.26 34.39 46.16 36.84 49.37 36.81 50.19 35.73 49.14
April 36.79 45.16 35.36 44.93 37.16 47.79 38.67 48.65 36.42 47.53
May 45.92 44.05 45.98 43.84 47.98 46.36 48.13 47.12 45.64 45.99
June 49.01 43.12 49.07 42.91 50.75 45.16 49.72 45.86 48.81 44.82
July 48.99 42.46 49.02 42.25 50.97 44.41 50.35 44.89 47.65 43.65
August 40.06 41.87 40.05 41.66 41.68 43.68 42.14 44.05 40.17 42.56
September 43.16 41.68 43.17 41.48 44.80 43.26 45.45 43.71 45.05 42.25
October 48.24 41.97 47.72 41.72 49.61 43.43 49.06 43.82 48.24 42.31
November 46.67 41.98 46.66 41.73 48.01 43.47 48.14 43.70 45.77 42.13
December 51.06 42.75 51.08 42.60 52.53 44.31 53.94 44.49 52.28 42.90
Annual Average 42.75 42.60 44.31 44.49 42.90
The above pricing data is provided for informational purposes only and was accepted as represented by various sources cited herein. Miller and Lents, Ltd. accepts no responsibility for the accuracy of this data.
2. MILLER AND LENTS, GLOBAL OIL AND GAS CONSULTANTS
2017 Calendar Year
First‐Day‐of‐the‐Month (FDOTM) Gas Benchmark Prices
Index Henry Hub Dominion, South Point NGPL, Midcontinent Houston Ship Channel CIG, Rockies
Source Platts Platts Platts Platts Platts
Product Gas Gas Gas Gas Gas
Units ($/MMbtu) ($/MMbtu) ($/MMbtu) ($/MMbtu) ($/MMbtu)
Month FDOTM Prior 12‐mo FDOTM Prior 12‐mo FDOTM Prior 12‐mo FDOTM Prior 12‐mo FDOTM Prior 12‐mo
January 3.650 2.593 3.185 1.496 3.520 2.426 3.510 2.553 3.615 2.369
February 3.005 2.655 2.795 1.607 2.845 2.481 2.985 2.615 2.820 2.421
March 2.510 2.730 2.010 1.694 2.355 2.557 2.505 2.689 2.360 2.503
April 3.095 2.828 2.815 1.826 2.720 2.638 3.105 2.782 2.625 2.581
May 3.165 2.933 2.630 1.934 2.840 2.725 3.215 2.898 2.685 2.660
June 3.005 3.010 2.235 1.997 2.665 2.784 3.150 2.996 2.630 2.724
July 2.950 3.014 1.920 2.023 2.555 2.770 3.055 3.018 2.415 2.715
August 2.835 3.005 1.845 2.064 2.610 2.760 2.785 3.005 2.555 2.704
September 2.890 3.001 1.420 2.080 2.675 2.750 2.925 3.014 2.625 2.703
October 2.900 3.006 0.745 2.116 2.540 2.745 2.915 3.013 2.325 2.683
November 2.770 2.656 1.225 1.523 2.545 2.492 2.760 2.624 2.505 2.451
December 2.940 2.742 2.370 1.960 2.465 2.505 2.900 2.725 2.450 2.491
Annual Average 2.976 2.100 2.695 2.984 2.634
2016 Calendar Year
First‐Day‐of‐the‐Month (FDOTM) Gas Benchmark Prices
Index Henry Hub Dominion, South Point NGPL, Midcontinent Houston Ship Channel CIG, Rockies
Source Platts Platts Platts Platts Platts
Product Gas Gas Gas Gas Gas
Units ($/MMbtu) ($/MMbtu) ($/MMbtu) ($/MMbtu) ($/MMbtu)
Month FDOTM Prior 12‐mo FDOTM Prior 12‐mo FDOTM Prior 12‐mo FDOTM Prior 12‐mo FDOTM Prior 12‐mo
January 2.310 2.530 1.410 1.409 2.355 2.395 2.290 2.495 2.390 2.333
February 2.260 2.495 1.470 1.358 2.185 2.383 2.235 2.472 2.195 2.327
March 1.600 2.398 0.960 1.277 1.440 2.288 1.620 2.387 1.380 2.230
April 1.925 2.339 1.230 1.218 1.745 2.241 1.995 2.335 1.680 2.187
May 1.905 2.284 1.340 1.206 1.800 2.188 1.820 2.278 1.740 2.138
June 2.085 2.237 1.480 1.225 1.955 2.148 1.975 2.226 1.865 2.097
July 2.900 2.248 1.605 1.269 2.730 2.152 2.785 2.228 2.525 2.088
August 2.945 2.263 1.355 1.272 2.730 2.156 2.950 2.245 2.680 2.094
September 2.935 2.283 1.225 1.275 2.785 2.173 2.810 2.262 2.640 2.105
October 2.835 2.313 0.310 1.199 2.605 2.190 2.930 2.295 2.560 2.126
November 2.785 2.382 1.545 1.247 2.455 2.240 2.730 2.363 2.395 2.181
December 3.285 2.481 2.250 1.348 3.160 2.329 3.275 2.451 3.150 2.267
Annual Average 2.481 1.348 2.329 2.451 2.267
The above pricing data is provided for informational purposes only and was accepted as represented by various sources cited herein. Miller and Lents, Ltd. accepts no responsibility for the accuracy of this data.