
Recommended
More Related Content
Similar to SEC FDOTM Prices October 2019
Similar to SEC FDOTM Prices October 2019 (17)
Recently uploaded
Recently uploaded (20)
SEC FDOTM Prices October 2019
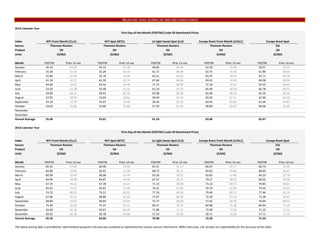
- 1. MILLER AND LENTS, GLOBAL OIL AND GAS CONSULTANTS 2019 Calendar Year First-Day-of-the-Month (FDOTM) Crude Oil Benchmark Prices Index WTI Front Month (CLc1) WTI Spot (WTC) LA Light Sweet Spot (LLS) Europe Brent Front Month (LCOc1) Europe Brent Spot Source Thomson Reuters Thomson Reuters Thomson Reuters Thomson Reuters EIA Product Oil Oil Oil Oil Oil Units ($/bbl) ($/bbl) ($/bbl) ($/bbl) ($/bbl) Month FDOTM Prior 12-mo FDOTM Prior 12-mo FDOTM Prior 12-mo FDOTM Prior 12-mo FDOTM Prior 12-mo January 45.33 64.30 45.15 64.38 49.95 69.39 52.20 70.98 50.57 70.20 February 55.26 63.43 55.29 63.50 61.72 68.80 62.75 70.40 61.86 69.64 March 55.80 62.99 55.76 63.06 63.51 68.82 65.07 70.50 63.71 69.59 April 61.59 62.71 61.59 62.79 67.84 68.84 69.01 70.40 69.08 69.60 May 63.60 62.41 63.55 62.48 71.15 68.85 72.18 70.32 63.55 68.66 June 53.50 61.38 53.49 61.45 61.24 67.76 64.49 69.29 66.78 68.01 July 59.09 60.13 58.91 60.18 63.38 66.59 65.06 68.10 65.10 66.98 August 53.95 58.99 53.64 58.92 58.04 65.44 60.50 67.11 62.90 66.20 September 55.10 57.76 55.07 57.69 58.10 63.97 60.43 65.69 61.04 64.87 October 53.62 55.96 53.60 55.88 57.50 61.81 58.89 63.52 60.06 62.80 November December Annual Average 55.68 55.61 61.24 63.06 62.47 2018 Calendar Year First-Day-of-the-Month (FDOTM) Crude Oil Benchmark Prices Index WTI Front Month (CLc1) WTI Spot (WTC) LA Light Sweet Spot (LLS) Europe Brent Front Month (LCOc1) Europe Brent Spot Source Thomson Reuters Thomson Reuters Thomson Reuters Thomson Reuters EIA Product Oil Oil Oil Oil Oil Units ($/bbl) ($/bbl) ($/bbl) ($/bbl) ($/bbl) Month FDOTM Prior 12-mo FDOTM Prior 12-mo FDOTM Prior 12-mo FDOTM Prior 12-mo FDOTM Prior 12-mo January 60.42 51.90 60.46 51.90 65.51 55.17 66.87 55.77 66.73 55.40 February 65.80 52.89 65.92 52.90 68.72 56.27 69.65 56.84 68.60 56.47 March 60.99 53.49 60.98 53.49 63.28 56.91 63.83 57.46 64.23 57.18 April 64.94 54.68 64.87 54.69 67.57 58.17 70.27 58.92 69.02 58.58 May 67.25 56.22 67.28 56.23 71.13 59.88 73.13 60.72 74.85 60.62 June 65.81 57.67 65.81 57.68 74.31 61.86 76.79 62.90 74.54 62.63 July 74.15 60.01 74.13 60.03 77.33 64.30 79.44 65.52 77.44 65.16 August 67.66 61.55 68.80 61.66 71.87 66.00 72.39 67.24 72.28 66.95 September 69.80 63.43 69.84 63.54 75.77 68.03 77.42 69.30 76.94 68.93 October 75.30 65.40 75.37 65.51 83.37 70.27 84.98 71.58 84.94 71.26 November 63.69 66.18 63.67 66.29 71.80 71.22 72.89 72.62 71.25 72.12 December 50.93 65.56 50.78 65.66 57.53 70.68 58.71 72.20 57.71 71.54 Annual Average 65.56 65.66 70.68 72.20 71.54 The above pricing data is provided for informational purposes only and was accepted as represented by various sources cited herein. Miller and Lents, Ltd. accepts no responsibility for the accuracy of this data.
- 2. MILLER AND LENTS, GLOBAL OIL AND GAS CONSULTANTS 2017 Calendar Year First-Day-of-the-Month (FDOTM) Crude Oil Benchmark Prices Index WTI Front Month (CLc1) WTI Spot (WTC) LA Light Sweet Spot (LLS) Europe Brent Front Month (LCOc1) Europe Brent Spot Source Thomson Reuters Thomson Reuters Thomson Reuters Thomson Reuters EIA Product Oil Oil Oil Oil Oil Units ($/bbl) ($/bbl) ($/bbl) ($/bbl) ($/bbl) Month FDOTM Prior 12-mo FDOTM Prior 12-mo FDOTM Prior 12-mo FDOTM Prior 12-mo FDOTM Prior 12-mo January 53.72 44.14 53.75 43.99 55.10 45.69 56.82 46.12 54.96 44.43 February 53.88 45.99 53.90 45.85 55.53 47.58 56.80 48.00 55.79 46.38 March 53.83 47.61 53.82 47.47 55.60 49.14 56.36 49.63 55.72 48.04 April 50.60 48.76 50.54 48.73 52.42 50.42 52.83 50.81 52.20 49.36 May 48.84 49.01 48.83 48.97 50.68 50.64 51.52 51.09 50.41 49.75 June 48.36 48.95 48.32 48.91 50.47 50.62 50.63 51.17 50.41 49.89 July 46.04 48.71 46.02 48.66 48.12 50.38 47.92 50.97 47.08 49.84 August 49.16 49.46 49.19 49.42 51.49 51.20 51.78 51.77 50.77 50.72 September 47.29 49.81 47.32 49.76 51.40 51.75 52.75 52.38 53.15 51.40 October 51.67 50.09 51.67 50.09 56.47 52.32 57.54 53.09 57.02 52.13 November 54.30 50.73 54.32 50.73 60.37 53.35 60.49 54.12 60.98 53.40 December 58.36 51.34 58.35 51.34 64.00 54.30 63.73 54.93 64.57 54.42 Annual Average 51.34 51.34 54.30 54.93 54.42 2016 Calendar Year First-Day-of-the-Month (FDOTM) Crude Oil Benchmark Prices Index WTI Front Month (CLc1) WTI Spot (WTC) LA Light Sweet Spot (LLS) Europe Brent Front Month (LCOc1) Europe Brent Spot Source Thomson Reuters Thomson Reuters Thomson Reuters Thomson Reuters EIA Product Oil Oil Oil Oil Oil Units ($/bbl) ($/bbl) ($/bbl) ($/bbl) ($/bbl) Month FDOTM Prior 12-mo FDOTM Prior 12-mo FDOTM Prior 12-mo FDOTM Prior 12-mo FDOTM Prior 12-mo January 37.04 48.93 37.13 48.80 38.51 52.48 37.28 53.90 36.61 52.58 February 31.62 47.54 31.62 47.45 32.85 51.05 34.24 52.33 32.45 51.32 March 34.40 46.26 34.39 46.16 36.84 49.37 36.81 50.19 35.73 49.14 April 36.79 45.16 35.36 44.93 37.16 47.79 38.67 48.65 36.42 47.53 May 45.92 44.05 45.98 43.84 47.98 46.36 48.13 47.12 45.64 45.99 June 49.01 43.12 49.07 42.91 50.75 45.16 49.72 45.86 48.81 44.82 July 48.99 42.46 49.02 42.25 50.97 44.41 50.35 44.89 47.65 43.65 August 40.06 41.87 40.05 41.66 41.68 43.68 42.14 44.05 40.17 42.56 September 43.16 41.68 43.17 41.48 44.80 43.26 45.45 43.71 45.05 42.25 October 48.24 41.97 47.72 41.72 49.61 43.43 49.06 43.82 48.24 42.31 November 46.67 41.98 46.66 41.73 48.01 43.47 48.14 43.70 45.77 42.13 December 51.06 42.75 51.08 42.60 52.53 44.31 53.94 44.49 52.28 42.90 Annual Average 42.75 42.60 44.31 44.49 42.90 The above pricing data is provided for informational purposes only and was accepted as represented by various sources cited herein. Miller and Lents, Ltd. accepts no responsibility for the accuracy of this data.
- 3. MILLER AND LENTS, GLOBAL OIL AND GAS CONSULTANTS 2015 Calendar Year First-Day-of-the-Month (FDOTM) Crude Oil Benchmark Prices Index WTI Front Month (CLc1) WTI Spot (WTC) LA Light Sweet Spot (LLS) Europe Brent Front Month (LCOc1) Europe Brent Spot Source Thomson Reuters Thomson Reuters Thomson Reuters Thomson Reuters EIA Product Oil Oil Oil Oil Oil Units ($/bbl) ($/bbl) ($/bbl) ($/bbl) ($/bbl) Month FDOTM Prior 12-mo FDOTM Prior 12-mo FDOTM Prior 12-mo FDOTM Prior 12-mo FDOTM Prior 12-mo January 53.27 91.22 53.45 91.56 55.55 94.63 57.33 97.34 55.27 96.75 February 48.24 87.12 47.79 87.41 49.99 90.26 52.99 92.89 47.52 91.69 March 49.76 82.72 49.84 82.99 56.97 85.97 62.58 89.01 61.89 87.77 April 50.09 78.58 50.12 78.86 56.12 82.10 57.10 84.97 55.73 83.61 May 59.15 75.22 59.10 75.48 65.15 79.09 66.46 81.53 64.13 79.90 June 60.20 71.68 60.24 71.88 65.17 75.75 64.88 77.82 62.87 76.04 July 56.96 67.65 56.94 67.79 60.04 71.72 62.01 73.63 61.65 71.94 August 47.12 63.42 47.11 63.56 50.44 67.45 52.21 69.24 53.29 67.76 September 45.41 59.21 45.38 59.19 49.76 63.18 49.56 64.81 48.80 63.40 October 44.74 55.37 44.75 55.35 47.65 59.33 47.69 60.93 47.48 59.47 November 46.59 52.54 46.60 52.53 47.53 56.33 49.56 57.91 48.00 56.46 December 41.85 50.28 40.58 50.16 42.43 53.90 44.44 55.57 42.97 54.13 Annual Average 50.28 50.16 53.90 55.57 54.13 2014 Calendar Year First-Day-of-the-Month (FDOTM) Crude Oil Benchmark Prices Index WTI Front Month (CLc1) WTI Spot (WTC) LA Light Sweet Spot (LLS) Europe Brent Front Month (LCOc1) Europe Brent Spot Source Thomson Reuters Thomson Reuters Thomson Reuters Thomson Reuters EIA Product Oil Oil Oil Oil Oil Units ($/bbl) ($/bbl) ($/bbl) ($/bbl) ($/bbl) Month FDOTM Prior 12-mo FDOTM Prior 12-mo FDOTM Prior 12-mo FDOTM Prior 12-mo FDOTM Prior 12-mo January 98.42 97.33 98.17 97.43 103.00 106.18 110.80 108.29 109.95 107.92 February 97.49 97.30 97.55 97.44 102.35 105.04 106.40 107.43 108.16 107.31 March 102.59 98.30 102.88 98.45 108.48 104.79 109.07 107.32 108.98 107.21 April 99.74 98.52 99.69 98.67 102.57 103.94 105.62 106.86 105.70 106.95 May 99.42 99.22 99.69 99.41 101.30 103.93 107.76 107.51 108.63 107.81 June 102.71 100.11 103.40 100.37 105.25 104.33 109.41 108.26 109.21 108.54 July 105.34 100.89 106.06 101.05 108.36 104.60 112.29 109.04 110.84 109.18 August 97.88 100.05 97.86 100.21 101.69 103.63 104.84 108.65 103.45 108.64 September 95.96 99.08 97.86 99.36 101.03 102.71 102.79 107.71 101.12 107.40 October 90.73 98.13 90.74 98.42 93.79 101.76 94.16 106.56 94.57 106.34 November 80.54 96.96 80.53 97.25 83.58 100.64 85.86 104.89 84.17 104.54 December 69.00 94.99 68.98 95.28 71.58 98.58 72.54 101.80 70.87 101.30 Annual Average 94.99 95.28 98.58 101.80 101.30 The above pricing data is provided for informational purposes only and was accepted as represented by various sources cited herein. Miller and Lents, Ltd. accepts no responsibility for the accuracy of the data.
- 4. MILLER AND LENTS, GLOBAL OIL AND GAS CONSULTANTS 2013 Calendar Year First-Day-of-the-Month (FDOTM) Crude Oil Benchmark Prices Index WTI Front Month (CLc1) WTI Spot (WTC) LA Light Sweet Spot (LLS) Europe Brent Front Month (LCOc1) Europe Brent Spot Source Thomson Reuters Thomson Reuters Thomson Reuters Thomson Reuters EIA Product Oil Oil Oil Oil Oil Units ($/bbl) ($/bbl) ($/bbl) ($/bbl) ($/bbl) Month FDOTM Prior 12-mo FDOTM Prior 12-mo FDOTM Prior 12-mo FDOTM Prior 12-mo FDOTM Prior 12-mo January 91.82 94.13 91.83 94.09 110.76 111.53 111.11 111.65 110.80 111.44 February 97.77 94.14 97.46 94.08 116.05 112.02 116.76 112.08 115.55 111.74 March 90.68 92.63 90.71 92.58 111.46 110.77 110.40 110.76 110.14 110.44 April 97.07 92.13 97.10 92.08 112.85 109.71 111.08 109.78 108.76 109.22 May 91.03 90.87 90.74 90.80 101.34 108.01 99.95 108.14 98.34 107.45 June 91.97 91.60 91.93 91.53 100.43 108.46 100.39 108.30 100.43 107.60 July 96.07 92.52 97.94 92.60 105.14 109.12 103.00 108.73 103.19 108.35 August 107.89 94.10 107.93 94.18 113.30 109.64 109.54 109.03 109.94 108.61 September 107.65 95.04 107.98 95.14 112.08 109.54 114.01 108.99 115.97 108.78 October 102.04 95.83 102.09 95.94 105.29 108.99 107.94 108.63 107.32 108.34 November 94.61 96.46 94.56 96.57 97.01 108.03 105.91 108.44 105.78 108.09 December 92.72 96.78 92.55 96.90 96.23 106.83 109.69 108.32 109.69 107.99 Annual Average 96.78 96.90 106.83 108.32 107.99 The above pricing data is provided for informational purposes only and was accepted as represented by various sources cited herein. Miller and Lents, Ltd. accepts no responsibility for the accuracy of the data.
- 5. MILLER AND LENTS, GLOBAL OIL AND GAS CONSULTANTS 2019 Calendar Year First-Day-of-the-Month (FDOTM) Gas Benchmark Prices Index Henry Hub Dominion, South Point NGPL, Midcontinent Houston Ship Channel CIG, Rockies Source Platts Platts Platts Platts Platts Product Gas Gas Gas Gas Gas Units ($/MMbtu) ($/MMbtu) ($/MMbtu) ($/MMbtu) ($/MMbtu) Month FDOTM Prior 12-mo FDOTM Prior 12-mo FDOTM Prior 12-mo FDOTM Prior 12-mo FDOTM Prior 12-mo January 3.225 3.071 2.815 2.550 2.635 2.467 3.185 3.117 3.020 2.430 February 2.830 3.040 2.750 2.533 2.295 2.431 2.800 3.093 2.425 2.433 March 2.925 3.066 2.755 2.587 2.800 2.478 2.850 3.118 2.895 2.493 April 2.685 3.060 2.460 2.585 2.415 2.496 2.635 3.100 2.255 2.529 May 2.595 3.053 2.210 2.599 1.995 2.504 2.475 3.083 1.840 2.539 June 2.470 3.018 2.100 2.565 1.195 2.394 2.390 3.038 1.275 2.463 July 2.350 2.973 2.005 2.522 1.820 2.351 2.235 2.972 1.745 2.426 August 2.230 2.924 1.940 2.476 0.755 2.236 2.105 2.909 1.760 2.380 September 2.290 2.870 1.485 2.390 1.570 2.174 2.195 2.840 1.535 2.322 October 2.325 2.815 1.610 2.415 1.465 2.123 2.300 2.765 1.455 2.280 November December Annual Average 2.593 2.213 1.895 2.517 2.021 2018 Calendar Year First-Day-of-the-Month (FDOTM) Gas Benchmark Prices Index Henry Hub Dominion, South Point NGPL, Midcontinent Houston Ship Channel CIG, Rockies Source Platts Platts Platts Platts Platts Product Gas Gas Gas Gas Gas Units ($/MMbtu) ($/MMbtu) ($/MMbtu) ($/MMbtu) ($/MMbtu) Month FDOTM Prior 12-mo FDOTM Prior 12-mo FDOTM Prior 12-mo FDOTM Prior 12-mo FDOTM Prior 12-mo January 3.580 2.970 3.040 2.088 3.760 2.715 4.400 3.058 3.455 2.621 February 3.205 2.987 2.955 2.101 2.725 2.705 3.090 3.067 2.385 2.585 March 2.610 2.995 2.105 2.109 2.245 2.695 2.550 3.071 2.175 2.569 April 2.755 2.967 2.475 2.080 2.195 2.652 2.850 3.050 1.820 2.502 May 2.680 2.927 2.045 2.032 1.900 2.573 2.680 3.005 1.725 2.422 June 2.885 2.917 2.515 2.055 2.510 2.560 2.935 2.987 2.190 2.385 July 2.900 2.913 2.515 2.105 2.335 2.542 3.020 2.984 2.185 2.366 August 2.815 2.911 2.490 2.158 2.140 2.503 2.860 2.990 2.305 2.345 September 2.930 2.914 2.520 2.250 2.310 2.473 3.025 2.999 2.235 2.313 October 2.990 2.922 1.315 2.298 2.075 2.434 3.200 3.023 1.965 2.283 November 3.290 2.965 2.685 2.419 2.435 2.425 3.420 3.078 2.900 2.316 December 4.565 3.100 4.160 2.568 4.100 2.561 4.590 3.218 4.250 2.466 Annual Average 3.100 2.568 2.561 3.218 2.466 The above pricing data is provided for informational purposes only and was accepted as represented by various sources cited herein. Miller and Lents, Ltd. accepts no responsibility for the accuracy of this data.
- 6. MILLER AND LENTS, GLOBAL OIL AND GAS CONSULTANTS 2017 Calendar Year First-Day-of-the-Month (FDOTM) Gas Benchmark Prices Index Henry Hub Dominion, South Point NGPL, Midcontinent Houston Ship Channel CIG, Rockies Source Platts Platts Platts Platts Platts Product Gas Gas Gas Gas Gas Units ($/MMbtu) ($/MMbtu) ($/MMbtu) ($/MMbtu) ($/MMbtu) Month FDOTM Prior 12-mo FDOTM Prior 12-mo FDOTM Prior 12-mo FDOTM Prior 12-mo FDOTM Prior 12-mo January 3.650 2.593 3.185 1.496 3.520 2.426 3.510 2.553 3.615 2.369 February 3.005 2.655 2.795 1.607 2.845 2.481 2.985 2.615 2.820 2.421 March 2.510 2.730 2.010 1.694 2.355 2.557 2.505 2.689 2.360 2.503 April 3.095 2.828 2.815 1.826 2.720 2.638 3.105 2.782 2.625 2.581 May 3.165 2.933 2.630 1.934 2.840 2.725 3.215 2.898 2.685 2.660 June 3.005 3.010 2.235 1.997 2.665 2.784 3.150 2.996 2.630 2.724 July 2.950 3.014 1.920 2.023 2.555 2.770 3.055 3.018 2.415 2.715 August 2.835 3.005 1.845 2.064 2.610 2.760 2.785 3.005 2.555 2.704 September 2.890 3.001 1.420 2.080 2.675 2.750 2.925 3.014 2.625 2.703 October 2.900 3.006 0.745 2.116 2.540 2.745 2.915 3.013 2.325 2.683 November 2.770 3.005 1.225 2.090 2.545 2.753 2.760 3.015 2.505 2.693 December 2.940 2.976 2.370 2.100 2.465 2.695 2.900 2.984 2.450 2.634 Annual Average 2.976 2.100 2.695 2.984 2.634 2016 Calendar Year First-Day-of-the-Month (FDOTM) Gas Benchmark Prices Index Henry Hub Dominion, South Point NGPL, Midcontinent Houston Ship Channel CIG, Rockies Source Platts Platts Platts Platts Platts Product Gas Gas Gas Gas Gas Units ($/MMbtu) ($/MMbtu) ($/MMbtu) ($/MMbtu) ($/MMbtu) Month FDOTM Prior 12-mo FDOTM Prior 12-mo FDOTM Prior 12-mo FDOTM Prior 12-mo FDOTM Prior 12-mo January 2.310 2.530 1.410 1.409 2.355 2.395 2.290 2.495 2.390 2.333 February 2.260 2.495 1.470 1.358 2.185 2.383 2.235 2.472 2.195 2.327 March 1.600 2.398 0.960 1.277 1.440 2.288 1.620 2.387 1.380 2.230 April 1.925 2.339 1.230 1.218 1.745 2.241 1.995 2.335 1.680 2.187 May 1.905 2.284 1.340 1.206 1.800 2.188 1.820 2.278 1.740 2.138 June 2.085 2.237 1.480 1.225 1.955 2.148 1.975 2.226 1.865 2.097 July 2.900 2.248 1.605 1.269 2.730 2.152 2.785 2.228 2.525 2.088 August 2.945 2.263 1.355 1.272 2.730 2.156 2.950 2.245 2.680 2.094 September 2.935 2.283 1.225 1.275 2.785 2.173 2.810 2.262 2.640 2.105 October 2.835 2.313 0.310 1.199 2.605 2.190 2.930 2.295 2.560 2.126 November 2.785 2.382 1.545 1.247 2.455 2.240 2.730 2.363 2.395 2.181 December 3.285 2.481 2.250 1.348 3.160 2.329 3.275 2.451 3.150 2.267 Annual Average 2.481 1.348 2.329 2.451 2.267 The above pricing data is provided for informational purposes only and was accepted as represented by various sources cited herein. Miller and Lents, Ltd. accepts no responsibility for the accuracy of this data.
- 7. MILLER AND LENTS, GLOBAL OIL AND GAS CONSULTANTS 2015 Calendar Year First-Day-of-the-Month (FDOTM) Gas Benchmark Prices Index Henry Hub Dominion, South Point NGPL, Midcontinent Houston Ship Channel CIG, Rockies Source Platts Platts Platts Platts Platts Product Gas Gas Gas Gas Gas Units ($/MMbtu) ($/MMbtu) ($/MMbtu) ($/MMbtu) ($/MMbtu) Month FDOTM Prior 12-mo FDOTM Prior 12-mo FDOTM Prior 12-mo FDOTM Prior 12-mo FDOTM Prior 12-mo January 2.995 4.238 1.225 3.103 2.920 4.259 2.925 4.175 3.110 4.256 February 2.675 4.043 2.080 2.875 2.330 4.073 2.520 3.969 2.265 4.001 March 2.770 3.882 1.930 2.640 2.585 3.698 2.635 3.794 2.550 3.697 April 2.625 3.728 1.935 2.470 2.310 3.527 2.615 3.643 2.195 3.525 May 2.565 3.543 1.490 2.247 2.430 3.340 2.515 3.462 2.320 3.331 June 2.650 3.390 1.245 2.083 2.440 3.185 2.590 3.300 2.365 3.172 July 2.775 3.253 1.080 1.885 2.685 3.050 2.765 3.160 2.625 3.036 August 2.765 3.171 1.320 1.825 2.680 2.970 2.750 3.077 2.610 2.946 September 2.685 3.060 1.190 1.741 2.575 2.874 2.605 2.970 2.510 2.845 October 2.475 2.921 1.220 1.680 2.405 2.751 2.530 2.844 2.305 2.714 November 1.965 2.765 0.970 1.557 1.860 2.611 1.915 2.709 1.735 2.570 December 2.095 2.587 1.035 1.393 2.090 2.443 2.215 2.548 2.125 2.393 Annual Average 2.587 1.393 2.443 2.548 2.393 2014 Calendar Year First-Day-of-the-Month (FDOTM) Gas Benchmark Prices Index Henry Hub Dominion, South Point NGPL, Midcontinent Houston Ship Channel CIG, Rockies Source Platts Platts Platts Platts Platts Product Gas Gas Gas Gas Gas Units ($/MMbtu) ($/MMbtu) ($/MMbtu) ($/MMbtu) ($/MMbtu) Month FDOTM Prior 12-mo FDOTM Prior 12-mo FDOTM Prior 12-mo FDOTM Prior 12-mo FDOTM Prior 12-mo January 4.340 3.747 3.710 3.482 4.360 3.661 4.265 3.725 4.310 3.603 February 5.020 3.888 4.810 3.605 4.563 3.770 4.985 3.873 5.320 3.773 March 4.700 3.989 4.755 3.706 7.085 4.074 4.735 3.979 6.200 4.003 April 4.475 4.026 3.980 3.698 4.365 4.116 4.435 4.013 4.260 4.037 May 4.785 4.066 4.165 3.689 4.670 4.158 4.685 4.045 4.645 4.083 June 4.485 4.104 3.210 3.635 4.299 4.187 4.530 4.093 4.275 4.120 July 4.415 4.175 3.450 3.668 4.310 4.234 4.450 4.163 4.260 4.196 August 3.745 4.199 2.050 3.587 3.635 4.257 3.745 4.189 3.685 4.229 September 4.025 4.236 2.190 3.496 3.724 4.286 3.893 4.209 3.719 4.252 October 4.135 4.290 1.960 3.384 3.890 4.327 4.040 4.258 3.880 4.299 November 3.840 4.313 2.440 3.331 3.531 4.323 3.535 4.257 3.470 4.304 December 4.235 4.350 3.000 3.310 4.115 4.379 4.140 4.287 4.245 4.356 Annual Average 4.350 3.310 4.379 4.287 4.356 The above pricing data is provided for informational purposes only and was accepted as represented by various sources cited herein. Miller and Lents, Ltd. accepts no responsibility for the accuracy of this data.
- 8. MILLER AND LENTS, GLOBAL OIL AND GAS CONSULTANTS 2013 Calendar Year First-Day-of-the-Month (FDOTM) Gas Benchmark Prices Index Henry Hub Dominion, South Point NGPL, Midcontinent Houston Ship Channel CIG, Rockies Source Platts Platts Platts Platts Platts Product Gas Gas Gas Gas Gas Units ($/MMbtu) ($/MMbtu) ($/MMbtu) ($/MMbtu) ($/MMbtu) Month FDOTM Prior 12-mo FDOTM Prior 12-mo FDOTM Prior 12-mo FDOTM Prior 12-mo FDOTM Prior 12-mo January 3.425 2.794 3.275 2.785 3.370 2.686 3.330 2.742 3.395 2.612 February 3.330 2.863 3.330 2.851 3.255 2.757 3.220 2.815 3.290 2.688 March 3.485 2.950 3.545 2.941 3.435 2.850 3.455 2.904 3.430 2.788 April 4.030 3.119 4.070 3.110 3.872 3.008 4.035 3.083 3.855 2.967 May 4.305 3.303 4.280 3.287 4.160 3.186 4.300 3.269 4.095 3.150 June 4.025 3.444 3.855 3.414 3.957 3.328 3.955 3.405 3.835 3.288 July 3.570 3.513 3.060 3.440 3.739 3.439 3.605 3.477 3.340 3.355 August 3.455 3.534 3.015 3.424 3.360 3.458 3.430 3.496 3.290 3.378 September 3.575 3.605 3.280 3.479 3.373 3.516 3.650 3.576 3.450 3.456 October 3.495 3.639 3.305 3.500 3.400 3.571 3.460 3.613 3.310 3.491 November 3.565 3.644 3.080 3.465 3.575 3.579 3.540 3.619 3.410 3.491 December 3.785 3.670 3.250 3.445 3.449 3.579 3.790 3.648 3.625 3.527 Annual Average 3.670 3.445 3.579 3.648 3.527 The above pricing data is provided for informational purposes only and was accepted as represented by various sources cited herein. Miller and Lents, Ltd. accepts no responsibility for the accuracy of this data.