More Related Content
Similar to 第三組(謝黃)Exchange rate effects on chinas trade (20)
第三組(謝黃)Exchange rate effects on chinas trade
- 1. Exchange-rate Effects on China’s Trade*
Jaime Marquez and John Schindler
Abstract
Though China’s share of world trade exceeds that of Japan, little is known about the response of China’s
trade to changes in exchange rates.The few estimates available have two limitations. First, the data for trade
prices are based on proxies for prices from other countries. Secondly, the estimation sample includes the
period of China’s transformation from a centrally-planned economy to a more market-oriented one. We
address these limitations with an empirical model explaining the shares of China’s exports and imports in
world trade in terms of the real effective value of the renminbi. The specifications control for foreign direct
investment and for the role of imports of parts to assemble exports. Parameter estimation uses disaggregated
monthly trade data and excludes China’s decentralization period.We find that a 10 percent real appreciation
of the renminbi lowers the share of aggregate Chinese exports by nearly one percentage point. However, the
estimated response of imports is negligible and lacks precision.
1. Introduction
That China’s role in world trade has changed from insignificance to relevance is well
known.Starting from a nearly closed economy in 1978,with shares in world trade below
1 percent,the share of China’s exports in world exports exceeded 7 percent in 2005,well
above the share of Japanese exports. Indeed, China doubled its share in world trade
since 1993, a doubling that no emerging-market economy has accomplished over such
a short time horizon. Given the growing importance of China in the global economy,
the question of how Chinese trade responds to movements in the Chinese exchange
rate is relevant.1
Addressing this question requires estimates of price effects on China’s trade, but
such information is not available for three reasons. First, the state controlled much of
the economy 25 years ago and so information on price effects was not relevant; section
2 reviews the main changes in trade policies since 1978. Secondly, the recent stability of
the real effective exchange rate makes it difficult to identify the effects of exchange
rates on trade. Thirdly, data on Chinese trade prices are not available. To be sure, the
literature offers estimated price effects, but they are based on proxies for the unob-
servable Chinese prices, which, as section 3 reviews, are of questionable usefulness.
* Marquez: Federal Reserve Board,Washington, DC 20551, USA.Tel: 202-452-3776; E-mail: jaime.marquez@
frb.gov. Schindler: Federal Reserve Board, Washington, DC 20551, USA. Tel: 202-452-3889; E-mail:
john.schindler@frb.gov. We are grateful to Menzie Chinn and to an anonymous referee for suggestions that
greatly improved the quality of the paper. We are also grateful to Susan Collins. Morris Goldstein, James
Harrigan, Dale Henderson, and Willem Thorbecke for detailed comments. Also, comments from David
Bowman, Neil Ericsson, Joe Gagnon, Bill Helkie, Koichiro Kamada, and Steve Kamin are gratefully acknowl-
edged. Earlier versions of this paper were presented at the Fall 2004 Midwest International Economics
Group, at the Federal Reserve Board’s Workshop series, and at the CPBS 2006 Annual Pacific Basin
Conference of the Federal Reserve Bank of San Francisco.The calculations are based on PcGets: see Hendry
and Krolzig (2001); and PcGive: see Doornik and Hendry (2000). The views in this paper are solely the
responsibility of the authors and should not be interpreted as reflecting the views of the Board of Governors
of the Federal Reserve System or of any other person associated with the Federal Reserve System.
Review of International Economics, 15(5), 837–853, 2007
© 2007 The Authors
Journal compilation © 2007 Blackwell Publishing Ltd, 9600 Garsington Road, Oxford, OX4 2DQ, UK and 350 Main St, Malden, MA, 02148, USA
- 2. Our aim is to estimate the responsiveness of Chinese trade to changes in exchange
rates without using proxies for trade prices. Avoidance of proxies may seem like a
minor issue but one would question, for example, estimated price effects if a study of
US trade were to rely solely on prices for US trade with Mexico as a proxy for all US
multilateral trade prices, or even worse, if the study were using Canadian multilateral
trade prices as a proxy for all US trade prices.Similarly,for the case of China,one would
question the usefulness of estimated price effects based on trade prices for half of
Chinese trade or on trade prices from countries to proxy for all Chinese trade prices.
Yet, that is the basis for the information that is currently available on the responsive-
ness of Chinese trade to exchange-rate changes.
To avoid using such proxies, we model Chinese nominal trade shares instead of trade
volumes. Section 4 highlights the advantages of our strategy and notes its main draw-
back: one cannot identify the price responsiveness of trade volumes. However, given
that previous results on Chinese trade rely on proxies that are far from perfect, our
approach offers an untainted characterization of the behavior of the value of Chinese
trade, albeit not of the behavior of the volume of Chinese trade.
To estimate the responsiveness of China’s trade to changes in exchange rates, section
5 develops specifications to explain movements in trade shares in terms of movements
in economic activity, movements in the real effective value of the renminbi, and the
stock of foreign direct investment. The specifications also allow for the role of imports
of parts to assemble merchandise exports and thus conform with the idea of trade being
driven by vertical specialization in the sense of Yi (2003).
As section 6 documents, we use Chinese trade data disaggregated into imports of
parts for assembly, exports of the assembled goods, imports of final products, and
exports of final products. Using these data may help to explain why some studies have
not found a strong relationship between the value of the exchange rate and the volume
of trade (however measured). Indeed, because China uses imports of components to
meet the demand for the exports of the goods assembled from these imports, it is not
clear (ex ante) what effect a change in the exchange rate would have on the demand for
the assembled goods. Specifically, the effect of an exchange-rate appreciation on the
demand for exports of assembled goods could be muted by the effect on the price of
the imports of the components for assembly. What is clear, though, is that estimating
exchange-rate effects should differentiate these two groups of goods.
The results, described in section 7, suggest that the response of China’s exports share
to changes in exchange rates depends on the type of product. Overall, a 10 percent real
appreciation of the renminbi lowers China’s exports share of world trade by nearly one
percentage point. The response of China’s import share also depends on the type of
product but these disaggregate responses tend to cancel each other yielding an aggre-
gate import response that is negligible and insignificant.
2. Deregulation of China’s Trade Policies
The status of China’s trade before 1978 is best summarized by Lardy (2002). Before
1978, China’s regulations affected international trade through three channels. First,
most decisions about trade were planned by the state in terms of physical quantities.
Inputs to the production process that could not be supplied domestically were
imported, and goods that were in excess supply were exported in order to finance
imports. When exports were not sufficient to finance imports, domestic consumption
was cut in order to allow for more exports. Secondly, trade was carried out by a handful
of state-owned trading enterprises (SOEs), each with a monopoly on trade in certain
838 Jaime Marquez and John Schindler
© 2007 The Authors
Journal compilation © Blackwell Publishing Ltd. 2007
- 3. goods. Thirdly, international prices played no role in determining supply and demand
behavior. If goods were to be exported, the producer received the government-set
domestic price of the good, regardless of the world market price. Similarly, imports
were sold at the domestic market price of comparable goods, regardless of the good’s
world market price or the exchange rate.
In 1978, China’s President Deng initiated unprecedented economic reforms that
affected international trade in several ways. First, through 1988, economic reforms
diminished both the physical planning of imports and the use of exports as a means
to finance imports. Secondly, tariff exemptions were extended to imports for the
purpose of processing, assembly, and re-export. This process allowed China’s assem-
bly industry to take advantage of a large labor endowment and freed the assembly
sector from existing domestic price distortions. From 1990 to 2001, the number of
goods exempt from any tariff increased, and the use of nontariff barriers declined
significantly. Domestic prices also reflected market forces and, by the end of the
1990s, market-determined prices had become the norm within China.2
Since accession
to the WTO in 2001, China has eliminated virtually all nontariff barriers to
imports.
An important implication of this deregulation process is that parameter estimation
should not use pre-1990 data. As Lardy (2002, p. 55) notes:
“Through the mid-1980s the volume of exports and the volume of imports
generally were not responsive to changes in the real exchange rate. Because
the government specified quantitative targets for most imports and exports,
changes in relative domestic and international prices had no discernible
effect on the volume of exports or imports.”
To address this limitation, we use high-frequency data beyond 1990.
3. Literature Review
There are several reasons for the lack of work on estimating Chinese trade elasticities.
First, because the state controlled much of the economy 25 years ago, including almost
all trade, neither the exchange rate nor other relative prices played an allocative role in
Chinese trade. Even after state control of Chinese trade was dismantled from the late
1970s to the mid-1990s, at which time Chinese trade had become almost completely
market-driven, the Chinese exchange rate was managed by the authorities. Finally,
there are data limitations, including most importantly a lack of Chinese data on trade
prices.
Cerra and Dayal-Gulati (1999) model both exports and imports using quarterly
data from 1983 through 1997. They use the world unit price of manufactured goods to
deflate Chinese exports and a composite index of partner-country exports prices
to deflate Chinese imports. They found that breaking the sample in 1988 improved
results significantly, with the later period yielding statistically significant results for the
export and import price elasticities.
Cerra and Saxena (2003) look at Chinese exports to determine the extent to which
Chinese export supply responds to market signals. They construct an index of export
unit values and an index of export volumes for Chinese exports only for a subsample of
all trade. In the larger of the two datasets they use, they have data for more than 50
percent of total exports, with the best coverage for commodities, but with about
95 percent of the missing data being from manufacturing industries.They use quarterly
EXCHANGE-RATE EFFECTS 839
© 2007 The Authors
Journal compilation © Blackwell Publishing Ltd. 2007
- 4. data from 1985 to 2001. They find that their estimate of the price elasticity of export
supply changes over time as the export regime was reformed, and in fact the estimate
changes sign between the early and late periods of their sample.
Lau et al. (2004) estimate export (to the G3 countries) and import trade elasticities
for China using quarterly data from 1995 to 2003.This choice of dates avoids the period
of structural adjustment during which previous papers found the exchange rate to have
little effect on trade. They report results for real exports and real imports but do not
specify the way in which they deflated the nominal data. Their modeling of Chinese
imports breaks down imports into imports for domestic use and imports for processing
and re-export. In none of their equations do they get a significant coefficient on the
exchange rate, but their results suggest that modeling processing and ordinary trade
separately may be useful.
Eckaus (2004) reports exchange-rate effects on China’s exports to the United States
using annual data from 1985 to 2002. He considers two specifications that differ in the
dependent variable: the level of China’s exports to the United States and the share of
US imports from China. For the first specification, Eckaus does not indicate whether
the dependent variable is measured in nominal or real terms and, if the latter, the paper
does not indicate which deflator is being used to estimate the volume of exports. The
specification in terms of shares avoids the use of proxies and the associated results
suggest that exchange rates do not have a statistically significant effect on China’s
exports to the United States.
Kamada and Takagawa (2005) estimate the exchange-rate effects for the growth
rate of multilateral, aggregate imports in real terms in terms of the growth rates of
real GDP, of the real exchange rate, and of future exports; the estimation period is
from 1994 to 2000. The paper uses a fixed export-share model to determine China’s
aggregate exports as the weighted sum of other countries’ imports. The paper uses
Japanese export prices as a proxy for China’s import prices and the estimation results
indicate that changes in the real exchange rate do not have an effect on the growth
rate of China’s imports. In their model simulations, a 10 percent appreciation of the
renminbi raises China’s imports by 1.4 percent after one year; the increase of exports
is negligible.
Thorbecke (2006) estimates income and exchange-rate elasticities for China’s
multilateral exports and for trade with the United States (exports and imports). The
parameter estimates associated with multilateral exports are obtained using a panel
that includes trade with 30 countries from 1982 to 2003; the trade data are disaggre-
gated across final products, intermediate products, and capital goods. To express the
value of these trade flows into their real counterparts, the paper uses the US consumer
price index. For US–China trade, the estimates rest on a sample from 1987 to 2004
and, again, the US CPI is used to deflate the value of trade. Thorbecke finds that the
evidence for China is not conclusive enough to characterize the effect of a change in the
exchange rate on China’s trade.
Overall, these papers suggest that reliable price effects for imports are notoriously
difficult to obtain. The papers also offer two important lessons that we adopt. First,
one needs to use data starting in the 1990s and exclude the period when China’s trade
regime was being transformed from state-controlled to market-oriented. To recognize
this consideration, we use monthly data from the late 1990s to the mid-2000s. Sec-
ondly, disaggregation of trade matters for estimation. Indeed, the papers reviewed
here find that separating imports for domestic use from imports used for assembly of
exports has an important influence on the characterization of the behavior of China’s
trade.
840 Jaime Marquez and John Schindler
© 2007 The Authors
Journal compilation © Blackwell Publishing Ltd. 2007
- 5. 4. Implications of Proxies for Modeling Trade
The conventional approach for estimating trade elasticities assumes that foreign and
domestic products are imperfect substitutes for each other (see Goldstein and Khan,
1985). For imports, this assumption is implemented as
m y p= ⋅α β
, (1)
where m is the volume of imports, y is real GDP, p is the relative price of imports
measured as pm/py, pm is the deflator for imports, py is the GDP deflator, a is the income
elasticity, and b is the price elasticity. Typically, data for m and y are generated by
deflating the value of imports and the value of income by the corresponding price
deflators, pm and py. However, because the data for these deflators are not generally
available for China, previous work deflates these nominal magnitudes using proxies
that replace the unobservable prices.
To examine the implications of such usage, suppose we use the import price of Hong
Kong as the proxy for the import price of China and China’s CPI as the proxy for
China’s domestic prices.3
In that case, the variables used in the model would be
measured as
m
MV
p
y
YV
p
p
p
pm cpi
m
cpi
= = =, , ,
where MV is the value of imports, p˜m is the renminbi import price of Hong Kong, YV
is the value of GDP, and pcpi is the CPI. Based on these proxies, one can predict the
volume of imports as
ˆ ,ˆ
,
ˆ
m y
p
p
t t
a mt
cpi t
= ⋅
⎛
⎝⎜
⎞
⎠⎟
β
(2)
where the symbol “ˆ” represents an estimate.
An important drawback from relying on equation (2) is that it generates biased
predictions. Specifically, if one assumes that
p pmt mt t= ⋅ +( )1 ξ , (3)
where pmt is the “correct” but unobserved import price index for Chinese imports and
xt is the unobserved measurement error, then the predicted value of imports is
MV m p y
p
p
pt t m t
a mt
cpi t
mt t% %≡ ⋅ = ⋅
⎛
⎝⎜
⎞
⎠⎟
⎡
⎣
⎢
⎢
⎤
⎦
⎥
⎥
⋅ ⋅ +( ) +ˆ ˆ
,
ˆβ
ξ1
1 ˆˆ
.
β
%ˆ (4)
The term 1
1
+( ) +
ξ βˆ
measures the prediction bias due to using a proxy for the import
price.This bias depends on the price elasticity, and only if this elasticity were minus one
( ˆβ = −1) would the forecast for the value of imports be free from this measurement bias.
Intuitively, if ˆβ = −1, then the measurement error in m˜ t cancels with the measurement
error in p˜mt, leaving the forecast of the value of imports unaffected by the choice of
proxy for the import price. However, for such canceling to be helpful requires knowing
the price responsiveness of China’s imports which amounts to assuming the answer to
the question we pose.
EXCHANGE-RATE EFFECTS 841
© 2007 The Authors
Journal compilation © Blackwell Publishing Ltd. 2007
- 6. To avoid these pitfalls,we replace models explaining the volume of trade with models
explaining the share of China in world trade.4
Specifically, we postulate that the import
share (wmt) depends on economic activity (y) and the real exchange rate (q):
MV
MV
w w y qt
t
mt m
*
, , ,≡ = ( )θ (5)
where MVt* is the value of world imports excluding China’s and q is the vector of
unknown parameters, the estimation of which is the focus here. Given these estimates,
and forecasts for y, q, and MVt*, the forecast of the value of Chinese imports is
MV w y q MVt m t t t= ( )⋅, , *.θˆ (6)
This approach has two advantages. First, the forecasts are not influenced by proxies for
trade prices or by assumptions about price elasticities. Secondly, all of the explanatory
variables are available at high frequency with minimal reporting delays.The usefulness
of this approach depends on the statistical reliability of the associated equations, which
we now examine.
5. Trade Share Model
Imports
We express the dollar value of China’s imports of the ith category relative to the dollar
value of imports by the rest of the world, wmt
i
, as
w
p m
p m
mt
i mi t it
mt t
≡
⋅
⋅
⋅
,
* *
,100 (7)
where pmi is the dollar price of imports of China of the ith type of imports, mi is the
associated volume of imports, m* is the volume of imports of the rest of the world,
and pm* is the dollar price of those imports. Though neither pmi nor mi are observed
directly, their product is recorded by Chinese statistical agencies.
Our choice of scaling variable is motivated by forecast considerations. Specifically,
the alternative of scaling by the dollar value of world imports, Σi mi i mp m p m⋅( ) + ⋅* *,
is not helpful. Indeed, conditioning on world trade amounts to conditioning on
Si(pmi · mi),which is what one wants to forecast.This consideration would not be relevant
if China’s trade shares were small but they are large and growing.5
We assume that wm
i
depends on the real exchange rate,China’s economic activity,and
the stock of foreign direct investment in China. As in Thorbecke (2006), we postulate
an autoregressive distributed lag to control for delays in adjustment:
i mt
i
i i t i t i f
R
t
mt
i
L w a b L y c k d L q u( )⋅ = + ( )⋅ + ⋅ + ( )⋅ +−1* , (8)
where L is the lag operator, y is the level of China’s industrial production index, k* is
the stock of foreign direct investment in China, qf /R is the level of the index of real
effective value of the renminbi, and um is a random disturbance. The estimating equa-
tions include dummy variables to capture seasonality, China’s accession to the WTO,
and China’s New Year, a widely celebrated holiday. The long-run coefficients are
bi(1)/ᐉi(1) for industrial production; ci/ᐉi(1) for foreign direct investment; and di(1)/ᐉi(1)
for the real exchange rate.
842 Jaime Marquez and John Schindler
© 2007 The Authors
Journal compilation © Blackwell Publishing Ltd. 2007
- 7. The coefficient b denotes the response of the share of imports to an increase in
industrial production. The sign of b depends on the degree of substitutability between
domestic products and imports. Specifically, if domestic products are a perfect substi-
tute for imports, then the expansion of the supply of domestic products reduces the
need to rely on imports to meet demand. In that case, we should expect b < 0; Goldstein
and Khan (1985) denote this possibility as the perfect substitute model. If imports are
used as an input in the production process, and lack domestic substitutes, then we
expect b > 0. The coefficient c denotes the response of the import share to changes in
foreign direct investment. As Swenson (2004) documents, this response depends on
whether this investment generates substitution or complementary effects in the host
country. Substitution effects arise if foreign direct investment activities are geared to
producing in the host country what would otherwise be imported. Complementarity
effects arise if the investment induces an increase in the host country’s demand for
other products that originate in the multinational’s country or in their foreign com-
petitors.Thus,the sign of c is not known in advance.Finally,the coefficient d denotes the
response of the import share to changes in the real effective exchange rate. This
response depends on how import volumes and import prices react to changes in the
exchange rate. Because prices and volumes might react in different directions to a
change in the exchange rate, the sign of d is not known in advance.6
Using equation (8), we compute the direct exchange-rate effect as
ξmt
i i
i
f
R
t
f
R
t
f
R
t
d
q
dq
q
=
( )
( )
⎛
⎝⎜
⎞
⎠⎟ ⋅ ⋅
1
1
, (9)
where ξmt
i
is the response of the import share of category i, in percentage points, to a
given percent change in the real exchange rate index.
To evaluate the gains from disaggregation, we model the share of aggregate imports
as
a mt
a
a a t a t a f
R
t
mt
a
L w a b L y c k d L q u( )⋅ = + ( )⋅ + ⋅ + ( )⋅ +−1* , (10)
where wmt
a
is the aggregate share of China’s imports in rest-of-the-world imports; the
associated exchange-rate effect is
ξmt
a a
a
f
R
t
f
R
t
f
R
t
d
q
dq
q
=
( )
( )
⎛
⎝⎜
⎞
⎠⎟ ⋅ ⋅
1
1
.
Exports
The “share” for the ith category of exports is
w
p x
p x
xt
i xi t it
xt t
≡
⋅
⋅
⋅
,
* *
,100 (11)
where pxi is China’s dollar export price, xit is the volume of exports, x* is the volume of
exports of the rest of the world,and px*is the dollar price of those exports.Again,neither
px nor x are observed directly, but their product is recorded by Chinese statistical
agencies.
EXCHANGE-RATE EFFECTS 843
© 2007 The Authors
Journal compilation © Blackwell Publishing Ltd. 2007
- 8. We assume that wx
i
depends on world economic activity, the real exchange rate, the
stock of foreign direct investment in China, and imports of components that are used
to assemble exports. The estimating equation we postulate is
i xt
i
i i t i m t
p
i t iL w a b L y c L w d k e L′ ( )⋅ = ′+ ′( )⋅ + ′( )⋅ + ′⋅ + ′( )− −* *, 1 1 ⋅⋅ +q uf
R
t
xt
i
,
, (12)
where y* is the world’s industrial production index, wm
p
is the share of imports of parts
for assembly and re-exports, and ux is a random disturbance.The equation also includes
dummy variables to control for seasonality, along with China’s New Year and China’s
accession to the WTO. The long-run coefficients are ′( ) ′( )bi i1 1 for industrial produc-
tion; ′( ) ′( )ci i1 1 for imports of parts for assembly and re-exports; ′ ′( )di i 1 for foreign
direct investment; and ′ ′( )ei i( )1 1 for the real exchange rate.
We expect that b′ > 0, meaning that an increase in the world’s industrial production
raises the demand for Chinese exports. Controlling for the role of imports of parts that
are used to assemble exports is important, as noted by Lau et al. (2004).Thus we expect
that c′ > 0, meaning that an increased availability of imports of parts for assembly
facilitates exports.7
Finally, as Lardy (2005) documents, China has experienced rapid
increases in FDI from firms that use China as a platform for their exports, and thus we
expect that d′ > 0.
The coefficient e′ denotes the response of the export share to changes in the level of the
index of the real effective exchange rate.This response depends not just on the response
of the volume of exports but also on the response of export prices and thus the effect of
the exchange-rate changes on the export share is not known in advance.8
The effect, in
percentage points, of an exchange rate on the ith export share is
ξxt
i i
i
f
R
t
f
R
t
f
R
t
e
q
dq
q
=
′( )
′( )
⎛
⎝⎜
⎞
⎠⎟ ⋅ ⋅
1
1
. (13)
To evaluate the gains from disaggregation, we model the share of aggregate exports
as
a
xt
a a a
t
a
t
a
f
R
t
xt
a
L w a b L y c k d L q u( )⋅ = ′ + ′ ( )⋅ + ′ ⋅ + ′ ( )⋅ +−* * ,1 (14)
where wxt
a
is the share of China’s exports in rest-of-the-world exports;the exchange-rate
effect is
ξxt
a a
a
f
R
t
f
R
t
f
R
t
d
q
dq
q
=
′( )
′( )
⎛
⎝⎜
⎞
⎠⎟ ⋅ ⋅
1
1
.
6. Data
We follow the convention of Chinese statistical agencies and disaggregate exports in
two groups: parts for assembly and ordinary products.9
By “parts for assembly” we refer
to exports of goods assembled using imported components specifically purchased for
the assembly of those exports. “Ordinary” exports are those that do not use imported
parts purchased exclusively for assembly. We disaggregate non-oil imports into ordin-
ary products and parts for assembly. By ordinary products we refer to goods that are
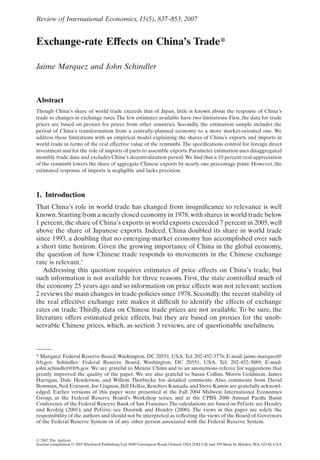
not subject to further processing. Figures 1 and 2 show the decomposition of China’s
844 Jaime Marquez and John Schindler
© 2007 The Authors
Journal compilation © Blackwell Publishing Ltd. 2007
- 9. 1993 1995 1997 1999 2001 2003 2005 2007
1
2
3
4
5
6
7
8
9
10
Percent
ADF tests
Parts for
assembly
3 −0.1901
2 −0.4431
1 −1.3310 −1.1320 −1.1530
0 −1.6380 −1.9160 −1.6410
Total
Parts for assembly
Ordinary
Lags TotalOrdinary
0.4500
−0.07150.0867
0.8599
Note: Critical values: 5% = −2.88; 1% = −3.47.
Figure 1. Chinese Export Shares
Source: IMF, International Finance Statistics, and CEIC.
1993 1995 1997 1999 2001 2003 2005 2007
1
2
3
4
5
6
7
8
9
10
ADF tests
Non-oil
3 −0.4363 −0.6407 −0.3827
2 −0.7890 −1.2420 −0.9533
1 −1.5520 −2.2610 −1.9100
0 −2.1600 −3.6140 −2.9670
Percent
Non-oil
Parts for assembly
Ordinary
Lags
Parts for
assembly Ordinary
Note: Critical values: 5% = −2.88; 1% = −3.47.
Figure 2. Chinese Import Share
Source: IMF, International Finance Statistics, and CEIC.
EXCHANGE-RATE EFFECTS 845
© 2007 The Authors
Journal compilation © Blackwell Publishing Ltd. 2007
- 10. trade into these categories using monthly data since 1993; the observations are not
seasonally adjusted and are scaled by the value of world merchandise trade excluding
China’s trade. Data for China’s exports and imports come from CEIC; data for world
trade come from the IMF. The share of aggregate exports increases from about 3
percent in 1997 to more than 9 percent by 2006 (Figure 1) with the share of parts for
assembly increasing faster than the share of ordinary products; further, ADF cannot
reject the hypothesis that these export shares are nonstationary.The share of aggregate
imports increases from about 3 percent in 1997 to more than 7 percent by the end of
2006 (Figure 2); the share for ordinary products experiences the largest increase.Again,
ADF tests cannot reject the hypothesis that these import shares are nonstationary.
We use three measures for the real effective exchange rate: the IMF, the Bank for
International Settlements (BIS), and the Federal Reserve Board (FRB).Though these
measures differ in country coverage and methodology, they have comparable contours
(Figure 3): a real appreciation of the renminbi from 1994 to 2002 followed by a
real depreciation.10
Further, ADF tests cannot reject the hypothesis that these real
exchange-rate indices are nonstationary.
We measure China’s economic activity using the index of industrial production; the
data are assembled from series available in CEIC. Data for world’s economic activity,
y*, are constructed as a geometric weighted average of the IMF’s industrial production
series.11
For the stock of foreign direct investment, we use CEIC data since 1997 by
cumulating the associated flows. However, because of the lack of data for the associated
initial value of foreign claims, the resulting estimate understates the actual value of the
stock of foreign investment in China.12
1994 1995 1996 1997 1998 1999 2000 2001 2002 2003 2004 2005 2006
75
80
85
90
95
100
105
110 Foreign currency/Renminbi (2000=100)
ADF tests
Lags IMF FRB BIS
3 −2.700 −2.239 −2.830
2 −2.717 −2.294 −2.820
1 −2.656 −2.422 −2.817
0 −2.856 −2.422 −2.863
BIS
FRB
IMF
Note: Critical values: 5% = −2.88; 1% = −3.47.
Figure 3. Real Effective Exchange-rate Measures
Sources: IMF, BIS, and FRB.
846 Jaime Marquez and John Schindler
© 2007 The Authors
Journal compilation © Blackwell Publishing Ltd. 2007
- 11. 7. Econometric Analysis
Design
For parameter estimation, we use monthly data from January 1997 to July 2006. The
reason for the brief sample period is the lack of monthly data on foreign direct
investment in China prior to 1997.The estimation method is ordinary least squares and
our focus is on the long-run coefficients.13
To control for the role of delays in adjust-
ment, equations (8) and (12) include up to 13 lags for each predetermined variable,
expect foreign direct investment which has no contemporaneous value and just one lag.
We assess the generality of the general specification by using several lags: 1, 3, and 6
months. To obtain a parsimonious representation, we implement the automated-
specification algorithm developed by Hendry and Krolzig (2001). Their algorithm
combines least squares with a selection criterion that excludes insignificant coefficients
and tests for both parameter constancy and white-noise residuals. Further, the critical
values are not fixed in advance but, rather, are calculated sequentially to recognize the
joint nature of model specification and parameter estimation.14
Imports
For imports of ordinary products, a real appreciation of the renminbi raises the import
share of ordinary products (Table 1); this effect is significant and similar in magnitude
for the three measures of exchange rates.These specifications also exhibit positive and
significant FDI effects that are similar in magnitude across measures of exchange rates;
this result suggests that FDI has complementarity effects with ordinary imports. Finally,
an increase in Chinese industrial production exerts a negative effect on the import
share of ordinary products; this finding is robust across the three measures of exchange
rates. Finding a negative sign for the income effect reflects not that imports are inferior
goods but, rather, that expansion of the supply of domestic products reduces the need
to rely on imports to meet demand.
For imports of parts for assembly, a real appreciation of the renminbi lowers the
import share and the associated point estimates are similar across measures of
exchange rates (Table 1); as noted earlier, this result is not inconsistent with theory.15
The formulations also exhibit positive FDI effects that are significant but not present
for the IMF’s measure of exchange rates. Finally, an increase in Chinese industrial
production raises the import share of parts for assembly; this finding is robust across
exchange-rate measures and stands in contrast to the findings for the import share of
ordinary products. One reason for this asymmetry is that imports of parts are an input
to a production process and thus increases in production lead to an increase in those
imports.
For aggregate non-oil imports, both the sign and the significance of the exchange-rate
effect are sensitive to the measure of the exchange rate.Foreign direct investment effects
are positive but the magnitudes are sensitive to the measure of the exchange rate.Finally,
movements in Chinese industrial production exert a negative effect if using either
the IMF or the FRB measures of the exchange rate. Note, however, that reliance on the
aggregate equation cannot differentiate between imports with a positive income effect
(imports of parts for assembly) from imports with a negative income effect (imports of
ordinary products). This finding emphasizes the importance of data disaggregation for
the characterization of Chinese imports.
EXCHANGE-RATE EFFECTS 847
© 2007 The Authors
Journal compilation © Blackwell Publishing Ltd. 2007
- 13. Based on these specifications, Table 1 reports the direct exchange-rate effects of a 10
percent appreciation. For ordinary products, this effect is positive, statistically signifi-
cant, and ranges from 12 basis points to 20 basis points.16
For imports of parts for
assembly, the effect is significant, negative, and ranges from 35 basis points to 12 basis
points. Combining exchange-rate effects that operate in opposite directions yields a
sum that is negligible and lacks precision. Finally, for aggregate non-oil imports, the
estimated exchange-rate effect ranges from -55 basis points for the IMF measure to 77
basis points for the FRB measure. Note that the estimated response of the aggregate is
larger (in absolute value) than the aggregate of responses, suggesting that modeling
aggregate imports overstates the responsiveness of Chinese imports to changes in
exchange rates.
Exports
For exports of ordinary products, a real appreciation of the renminbi lowers the export
share of ordinary products (Table 2); this effect is statistically significant and similar
across measures of the exchange rate.17
Further, an increase in foreign direct invest-
ment has no discernible effect on the export share of ordinary products. Finally,
movements in world industrial production exert a direct effect on this export share; the
effect is significant and similar across exchange-rate measures.
For exports of parts for assembly, a real appreciation of the renminbi lowers this
export share (Table 2); the effect is significant and similar across measures of the
exchange rate.The results also suggest that FDI effects are absent. Further, movements
in world industrial production exert a direct and significant effect on the export share;
these income effects are similar across exchange-rate measures. Finally, movements in
imports of parts for assembly exert a direct and significant effect on exports; the point
estimates are similar across measures of exchange rates and close to one suggesting that
the totality of these imports is being transformed into exports.
For aggregate exports, a real appreciation of the renminbi lowers the associated
share; this effect is significant and similar across exchange-rate measures. Finally, move-
ments in world industrial production exert a direct and significant effect on exports
which is similar across exchange-rate measures.
Based on these specifications, the direct exchange-rate effect of a 10 percent appre-
ciation for ordinary products, is negative, significant, and ranges from 54 basis points to
65 basis points.18
For parts for assembly, the effect is negative, significant, and ranges
from 24 basis points to 32 basis points. The sum of these exchange-rate effects ranges
from 77 basis points to 96 basis points. For aggregate exports, the exchange-rate effect
is negative, significant, and ranges from 110 basis points to 132 basis points. Note that
the estimated response of the aggregate is greater than the aggregate of responses,
suggesting that modeling aggregate exports overstates the responsiveness of Chinese
exports to changes in exchange rates.
Application
We now use the direct exchange-rate effects to estimate the long-run responses of the
value of trade of a 10 percent real effective appreciation of the renminbi; we focus on
direct effects because of their statistical reliability. The calculations reveal a decline in
the value of exports ranging from $74 billion to $92 billion (Table 3).19
The reduction
in the value of exports of ordinary products accounts for the bulk of the decline in the
value of aggregate exports. The response of the value of aggregate imports is, by
EXCHANGE-RATE EFFECTS 849
© 2007 The Authors
Journal compilation © Blackwell Publishing Ltd. 2007
- 15. comparison, much smaller: from an increase of $1 billion to a decline of $15 billion.20
This lack of aggregate response is due to the presence of offsetting effects: the expan-
sion of imports of ordinary products being offset by the contraction of imports of parts
for assembly. Finally, the evidence indicates a reduction in the balance of trade in
ordinary products ranging from $63 billion to $70 billion.When scaled, these estimates
are comparable to those of Bergsten (2007) who reports the effects of a 20 percent
appreciation of the renminbi.
8. Conclusions
China’s share of world trade exceeds that of Japan and yet little is known about the
response of China’s trade to changes in exchange rates. The scant evidence available
relies on proxies for prices and on samples that include the decentralization period.
These two features call into question the usefulness of such estimates for assessing the
effects of an appreciation on China’s trade.This paper offers one approach for address-
ing these difficulties. Specifically, the paper replaces the formulation explaining trade
volumes with a formulation explaining the shares of China’s exports and imports in
world trade. Further, the estimates are from a sample that excludes the decentralization
period.
The evidence offers several findings. First, disaggregation across products is relevant
for modeling Chinese trade. Specifically, disaggregation of Chinese trade into “ordin-
ary” trade and trade related to processing and assembly shows different responses
to exchange-rate changes. Further, reliance on aggregate trade equations over-states
exchange-rate effects. Secondly, a 10 percent real appreciation of the renminbi lowers
the share of aggregate Chinese exports by nearly one percentage point; the estimate
of the response of imports is nil and lacks precision. Finally, these estimates cannot
differentiate between price and volume responses. Only as additional reliable price
data become available will it be possible to disentangle these responses. But, in the
interim, we hope our estimates might assist the discussion of the effects of exchange
rates on China’s trade.
References
Bayoumi, Tamim, Jaewoo Lee, and Sarma Jayanthi, “New Rates from New Weights,” IMF
working paper WP/05/99 (2005).
Bergsten, Fred, Testimony before the Hearing on the Treasury Department’s Report to Congress
on International Economic and Exchange Rate Policy and the Strategic Economic Dialogue
Committee on Banking, Housing and Urban Affairs (2007). Available at http://www.
petersoninstitute.org (accessed 22 February 2007).
Table 3. Direct Exchange-rate Effects on Chinese Trade Values from a 10 Percent Real Apprecia-
tion: Sensitivity to Measure of Exchange Rate
Exports ($ billion) Imports ($ billion)
FRB IMF BIS FRB IMF BIS
Ordinary -62.5 -56.8 -51.3 19.5 13.1 11.9
Parts for Assembly -29.4 -30.8 -22.5 -34.2 -12.1 -21.8
Sum -91.9 -87.6 -73.8 -14.7 1.0 -9.9
EXCHANGE-RATE EFFECTS 851
© 2007 The Authors
Journal compilation © Blackwell Publishing Ltd. 2007
- 16. Cerra, Valerie and Anuradha Dayal-Gulati, “China’s Trade Flows: Changing Price Sensitivities
and the Reform Process,” IMF working paper WP/99/1 (1999).
Cerra, Valerie and Sweta Saxena,“How Responsive is Chinese Export Supply to Price Signals?”
China Economic Review 14 (2003):240–70.
Doornik, Jurgen and David F. Hendry, Modeling Dynamic Systems using PcGive, London:
Timberlake (2000).
Eckaus, Richard, “Should China Appreciate the Yuan?” MIT working paper 04-16 (2004).
Gaulier, Guillaume, Francoise Lemoine, and Deniz Unal-Kesenci, “China’s Integration in
East Asia: Production Sharing, FDI, and High-tech Trade,” CEPII working paper 2005-09
(2005).
Goldstein, Morris and Mohsin Khan, “Income and Price Effects in Foreign Trade,” in Ronald
Jones and Peter Kenen (eds), Handbook of International Economics, Vol. 2, Amsterdam:
North-Holland (1985).
Hendry, David F. and Hans-Martin Krolzig, Automated Econometric Model Selection Using
PcGets, London: Timberlake (2001).
Hope, Nicholas and Lawrence Lau, “China’s Transition to the Market: Status and Challenges,”
Stanford Center for International Development, working paper 210 (2004).
Kamada, Koichiro and Izumi Takagawa, “Policy Coordination in East Asia and Across the
Pacific,” International Economics and Economic Policy 2 (2005):275–306.
Klau, Marc and San Fung, “The New BIS Effective Exchange Rate Indices,” BIS Quarterly
Review March (2006):51–65.
Lardy, Nicholas, Integrating China into the Global Economy, Washington, DC: Brookings Insti-
tution Press (2002).
———,“China: the Great New Economic Challenge?” in F. Bergsten (ed.), The United States and
the World Economy, Washington, DC: Institute for International Economics (2005).
Lau, Francis, Yik-ko Mo, and Kim-hung Li,“The Impact of a Renminbi Appreciation on Global
Imbalances and Intra-regional Trade,” Hong Kong Monetary Authority Quarterly Bulletin
March (2004):16–26.
Loretan, Michael, “Indexes of the Foreign Exchange Value of the Dollar,” Federal Reserve
Bulletin 91 (2005):1–8.
Marquez, Jaime and John Schindler, “Exchange-rate Effects of China’s Trade: An Interim
Report,” International Finance discussion paper 861 (2006).
Rossi, Vanessa, “Is Revaluation of the Renminbi Good News?” CESifo Forum 6 (2005):29–
36.
Swenson, Deborah, “Foreign Direct Investment and the Mediation of Trade Flows,” Review of
International Economics 12 (2004):609–29.
Thorbecke, Willem, “How Would an Appreciation of the Renminbi Affect the US Trade
Deficit?” B.E. Journal of Macroeconomics—Topics in Macroeconomics 6 (2006):1–15. Avail-
able at http://www.bepress.com/bejm/topics/vol6/iss3/art3 (accessed 22 February 2007).
US Congress, “China’s Exchange Rate Regime and Its Effects on the US Economy,” Hearings
before the Subcommittee on Domestic and International Monetary, Trade, and Technology,
1 October, serial no. 108-56 (2003).
World Bank, China: Integration of National Product and Factor Markets, report no. 31973-CHA,
Washington, DC: World Bank (2005).
Yi, Kei-Mu, “Vertical Specialization,” Journal of Political Economy 111 (2003):52–102.
Notes
1. See Eckaus (2004), Rossi (2005), and the remarks by M. Goldstein and J. Taylor during the
1 October 2003 Hearings on China’s exchange rate regime and its effects on the US economy.
Finally, see the testimony by Bergsten during the 31 January 2007 Hearing on the Treasury
Department’s Report to Congress on International Economics and Exchange Rate Policy.
2. See Hope and Lau (2004) and the World Bank (2005).
852 Jaime Marquez and John Schindler
© 2007 The Authors
Journal compilation © Blackwell Publishing Ltd. 2007
- 17. 3. Even if this proxy were the best one, the diversification of China’s trading partners is under-
mining the reliability of using the price of imports for Hong Kong as representative of the
composition of imports of China.
4. Our focus on trade shares does not remove all measurement errors because official statistics
are still subject to errors associated with smuggling, misreporting, and misrecording.
5. Another scaling variable is the value of China’s nominal GDP but the associated data are not
available at the monthly frequency that is used here.
6. See Marquez and Schindler (2006, App. 9.1) for the details.
7. Marquez and Schindler (2006, App. 9.4) show that movements in imports of parts are infor-
mative for predicting exports of parts but not the other way around.
8. See Marquez and Schindler (2006, App. 9.2) for the details.
9. Trade in parts for assembly is not the same as round-trip trade. We use the former term to
conform with Gaulier et al. (2005).
10. For the methodology used to construct real effective exchange rates, see Bayoumi et al.
(2005), Klau and Fung (2006), and Loretan (2005).
11. The countries included are Belgium, Canada, Finland, France, Germany, Hungary, Ireland,
Italy, Japan, Korea, Mexico, Netherlands, Norway, Spain, Sweden, the United Kingdom, and the
United States. Exports to these countries account for two-thirds of China’s exports. Finally,ADF
tests cannot reject the hypothesis that these measures of economic activity are nonstationary.
12. One limitation of our series is that it does not identify the source of the country undertaking
the investment. Indeed, Lardy (2005) notes that Asian firms use China as a platform for their
exports, whereas American firms orient their production towards the Chinese market.
13. One limitation of OLS is that it does not recognize that trade shares cannot take negative
values, and that the residuals cannot take just any value. Addressing this consideration involves
using a different estimation method and we have delayed this consideration for further research.
Finally, as pointed by the referee, there is a potential for bias in that we treat the volume of world
trade excluding China as having a unitary price elasticity. In that case, the value of the world trade
excluding China does not change in response to changes in the exchange rate.
14. Combining alternative lag lengths and measures of exchange rates gives rise to numerous
specifications. We report here the results for specifications exhibiting parameter constancy,
white-noise residuals, and the smallest standard error of the regression.The extended version of
this paper, available on request, reports estimates from all of the specifications, as well as
estimates based on monthly data from 1994 to 2006 with a specification that excludes foreign
direct investment.
15. Nevertheless, one reason for the negative effect could be the inability of an equation for
multilateral trade to capture China’s trade in these products with East Asia; we thank the referee
for pointing out this observation to us.
16. Based on equation (9), the direct exchange-rate effect is
ˆ
ˆ
ˆ
,ξm
i i
i
f
R
d
q=
( )
( )
⎛
⎝⎜
⎞
⎠⎟ ⋅ ⋅
⎛
⎝⎜
⎞
⎠⎟
1
1
10 100
where qf R is the 12-month moving average of qf/R. The values reported in the table correspond
to the July 2006 value of qf R .
17. The estimating equation excludes, by design, the share of imports of parts and assembly
products.The reason for this exclusion is that the data for exports of ordinary products exclude,in
official statistics, exports of products that are assembled using imports of parts for assembly.
18. Based on equation (13), the exchange-rate effect is
ˆ ˆ
ˆ
.ξx
i i
i
f
R
e
q=
′( )
′( )
⎛
⎝⎜
⎞
⎠⎟ ⋅ ⋅
⎛
⎝⎜
⎞
⎠⎟
1
1
10 100
19. These responses are computed as ξxt
i
xt tp x100( )⋅ ⋅( * *) where p xxt t* *⋅ is $9593 billion. We focus
on the direct effects because of their statistical reliability.
20. These responses are computed as ξmt
i
mt tp m100( )⋅ ⋅( * *), where p mmt t* *⋅ is $9711 billion.
EXCHANGE-RATE EFFECTS 853
© 2007 The Authors
Journal compilation © Blackwell Publishing Ltd. 2007