SlideShare a Scribd company logo
1 of 24
Download to read offline
The comparative study of competitiveness of service
trade between China and Germany
————————Zhang Yi
Abstract::::Along with the process of the economic globalization,service trade is becoming more and more
important to the sustainable development of the national economy. Now, whether a country has a well developed
service trade would influence its world prestige. This article analyses the competitiveness of the service trade
between China and Germany. First of all, this article compares the present situation of the two countries; secondly,
using several indexes to compare the competitiveness of service trade in the two countries; last but not least, this
article using AHP to analyze the advantages and disadvantages of the two countries according to elements that
influence the service trade.
Key words:::: Trade in service; Trade competition index; Market share; Index of revealed comparative
advantage; Analytical hierarchy process
With the continuous development of social civilization, the service sector has become
gradually important to our lives. The service-oriented manufacturing sector becomes more
important than the mere second industrial manufacturing for the sustainable development of the
national economy. At the same time, the service sector of the international industrial transfer will
be more profound impact on the pattern of the world economy. Today', trade in services has
gradually become the mainstream of the world economy, countries have to use their own
advantages to develop distinctive service industry, in order to seek the continued positive
development of its own economy. In the 21st
century, under such situation of development, both
the service trades in China and Germany have developed significantly, but there are still quite a lot
of problems. By comparing the competitiveness of service trade with each other, so as to come up
with the reasons which influence the development of service trade?
1 Analysis of the development of service trade between China
and German
Growth rate of total service, annual, 1980-2011
-20
-10
0
10
20
30
40
50
60
1991
1993
1995
1997
1999
2001
2003
2005
2007
2009
2011
YEARS
GROTHRATE
WORLD
CHINA
GERMANY
Figure1 Growth rate of total service, annual, 1980-2011 (unit :%) (Data source: UNCTAD)
Comparison of service trade exports between China and Germany,
1991-2011
0
50000
100000
150000
200000
250000
300000
1990
1992
1994
1996
1998
2000
2002
2004
2006
2008
2010
YEAR
EXPORTS
CHINA
GERMANY
Figure2 Comparison of service trade exports between China and Germany, 1991-2011 (unit:
Million USD) (Data source: UNCTAD)
From the figure 1, we can see that since the beginning of the 21st
century, service trade
exports in China have developed significantly, the growth momentum is obvious as well as the
growth rate is higher than the world average. However, from the figure 2, we can see that at the
beginning of 21st
century, when the growth rate of service trade exports in China was at the
highest level, the services trade exports was only a tenth of service trade exports in Germany.
Recent years, the service trade exports in China have reached half of services trade exports in
Germany. The low starting point and rapid development are the characteristics of Chinese service
trade. Well, twenty years later, what are the states of the two countries’ development of service
trade now?
1.1 Analysis of the development of service trade in China
Table1 Development of service trade between China and Germany, 2007 - 2011(unit: Billion
USD,%)(C:CHINA,G:GERMANY)
Total trade Service
trade
Service
trade export
The
proportion
of Service
trade in
their foreign
trade
The
proportion
of service
trade
exports in
total trade
exports
The
proportion
of Service
trade exports
in global
service trade
exports
CCCC GGGG CCCC GGGG CCCC GGGG CCCC GGGG CCCC GGGG CCCC GGGG
2007 23769 29118 2523 4820 1222 2226 10.6 16.5 9.1 14.1 3.5 6.3
2008 28145 32667 3060 5447 1471 2544 10.8 16.6 9.3 14.5 3.7 6.5
2009 24465 26122 2884 4878 1295 2316 11.7 18.6 9.7 16.6 3.7 6.6
2010 32731 28972 3645 5011 1712 2375 11.1 17.2 9.7 15.4 4.4 6.2
2011 39841 34282 4206 5484 1831 2581 10.5 15.9 8.7 14.2 4.3 6.0
Data source: UNCTAD
In the first place, from table1, we can see that the rapid development of service trade in China
become relatively slow due to the impact of the economic crisis in 2008. Over the past five years,
the net growth of service trade in China import and export amounted to $ 168.3 billion, total
increase is 66.7%. However, at the same time the data is still higher than the growth rate of
Germany. Meanwhile, service trades in China exports accounted for the proportion of the global
service trade exports rise from 3.5% rise to 4.3% in 2007-2011; gradually catch up with the
service trade export in Germany share.
Table2 the comparison of the scale of service trade in China, Germany and the United States,
2011(unit: Billion USD,%)
CHINA GERMANY USA WORLD
Total trade 3984 3428 4767 44207
Total trade world
ranking
2 3 1
Service trade 420 548 1028 8257
Service trade world
ranking
3 2 1
the proportion of
service trade exports
in total trade exports
10.5 15.9 21.5 18.6
Service trade export 183 258 599 4236
The proportion of
Service trade exports
in global service
trade exports
4.3 6.0 14.1
Service trade export
world ranking
4 3 1
Service trade import 237 290 429 4020
Data source: UNCTAD
In the second place, the table2 shows that the scale of service trade in China is relatively
small. Although it has already ranked third in the world, its total trade in service less than half of
the US as well as less than Germany. The datum of the US is using to comparing more clearly.
Meanwhile, service trade in China continued to maintain a steady development; however, the
proportion of their total foreign trade did not have too much change, only about 10.5%. This data
is not only lower than the United States and Germany, but also far below the world average. In
addition, service trade exports accounted for the proportion of global trade export is growing and
has reached 4.3%; however, it still has to be improved when compared to the United States,
Germany.
Again, in the 21st
century, the overall service trade showed a strong momentum of
development, drawn by Figures 1, 2; the characteristics of service trade in China are the higher
growth rate and the huge amount of growth. However, it is undeniable that there are still some
drawbacks what have been described above. At the same time, service trade in China import more
than its export and the deficit situation become worse in recent years, even reach as much as $
54.4 billion in 2011.
What we discussed above generally react the deficiencies and disadvantages of service trade
in China. However, in a nutshell, the imperfections of the internal structure of service trade in
China, is the ultimate reason for restricting its development.
Then, from Figure 3, we can find that the transportation industry, tourists industry as well as
a large part of other services such as: communication, architecture, film and television. These
traditional and elementary industries have an extremely large proportion in the structure of service
trade in China, about two-thirds. However, those with higher levels of technology and
capital-intensive industries, such as: insurance, financial, information, and other advanced service
industries have a relatively small proportion in the entire service structure. That is why the
development of service trade in China is rapid but never strong.
Value of service exports by service-category from 1990 to 2011
in China
0
50000
100000
150000
200000
1990
1992
1994
1996
1998
2000
2002
2004
2006
2008
2010
YEARS
EXPORTS
TRANSPORT
TRAVEL
OTHER SERVICES
Figure 3 Value of service exports by service-category from 1990 to 2011 in China. (unit:
Million USD) (Data source: UNCTAD)
Table3 Overview of Chinese trade in service in 2011
7298097
Services value added (%) 43.1%
% of GDP 2.5%
GDP (mill. current US$,)
Commercial
services exports % of goods and
comm. services
exports
8.7%
58269Employment in services
(thousands) % of total employment 40.4%
Inward 861498FDI in services - Stocks
(mill.US$) Outward 242552
Trade - Balance of Payments (mill. US$)
Value % Change Rank
Commercial services
imports
236531 23% 3
Transportation 80445 27% 2
Travel 72474 32% 3
Other commercial
services
83612 13% 6
Commercial services
exports
182433 7% 4
Transportation 35611 4% 8
Travel 48515 6% 4
Other commercial
services
98307 9% 6
Finance and insurance
Value added (mill. US$) 309893
% of total value added 5.2%
Production and Employment
Employment (% of tot.
employment)
3.5%
Trade - Balance of Payments (mill. US$)
Value % Change
Imports 694 -50%Financial
services Exports 799 -40%
Imports 19769 25%Insurance
services Exports 3346 94%
(Data source: WTO:Service profiles 2011)
In the end, the table3 using the datum in 2011 showing us the overview of service trade in
China. Judging from all what has been discussed above, we may draw the conclusion that the
annual growth rate of service trade in China is rapid, employment in services have also improved
rapidly. However, the internal structure of service trade in China is imperfect. Although the
insurance service grew rapidly in recent years, exports growth rate reached as much as 94%,
financial service fell both in imports and exports. Thus the development of service trade in China
is extremely unbalanced. At the same time, although Chinese commercial services imports has
been improved significantly in recent year, it already ranked second or third in the world, the
growth of its exports is very small. That means the status of service trade in China in the whole
world is not stable at all. It depended much on other countries.
1.2 Analysis of the development of service trade in Germany
First of all, we look back the table1; we can see that the German trade in service has not been
improved significantly in recent years. The total trade in service only increase of $66.4 billion and
the growth rate is 13.7% from 2007 to 2011. Service trade in Germany, however, accounting for
the proportion of gross domestic foreign trade, accounting for the proportion of the international
market, especially the service trade exports accounted for the proportion of their total export, these
three data remained in a stable condition, the values were about 16.5% , 6.3%, 15.0% . Even after
the world economic crisis in 2008, these data did not show a significant decline. This shows that
Germany already has some sufficiently strong industries to support its trade in service.
Second of all, table2 shows the comparison of the scale of trade in service among China,
Germany and the US. We can see that the total service trade in Germany has ranked second in the
world and the trade in service exports has also ranked second. But these datum point that trade in
service in the US is much better than Germany. In especial, service trade in Germany export
market share is only 6%, less than half of the market share in the US. This shows that the
international status of the German trade in services has yet to be improving.
Again, in the 21st
century, although the growth rate of service trade in Germany is less than
China, but remains slightly higher than the world average. The development situation always is
stable, service trade imports more than exports in Germany recently, the deficit decreases
gradually year after year. So the development trend is relatively optimistic.
Then, the figure 4 shows the value of service exports by service-category in Germany from
1990 to 2011. We can see that the other services sector occupies a very important position in the
structure of service trade in Germany. At the same time, the traditional service industries such as:
transportation and travel industries have stable position in its structure. That means there are not
only the traditional services industries to maintain a strong foundation, but also plenty of relatively
active new services industries to strive for power of rapid growth.
Value of service exports by service-category from 1990 to 2011
in Germany
0
50000
100000
150000
200000
250000
300000
1990
1992
1994
1996
1998
2000
2002
2004
2006
2008
2010
YEARS
EXPORTS
TRANSPORT
TRAVEL
OTHER SERVICES
Figure 4 Value of service exports by service-category from 1990 to 2011 in Germany. (unit:
Million USD) (Data source: UNCTAD)
Table4 Overview of German trade in service in 2011
3570566
Services value added (%) 62.1%
% of GDP 7.1%
GDP (mill. current US$,)
Commercial
services exports % of goods and
comm. services
exports
14.2%
27711Employment in services
(thousands) % of total employment 67.3%
Inward 792646FDI in services - Stocks
(mill.US$) Outward 1006903
Trade - Balance of Payments (mill. US$)
Value % Change Rank
Commercial services
imports
289091 10% 2
Transportation 67162 7% 3
Travel 84237 8% 2
Other commercial
services
137693 13% 2
Commercial services
exports
253381 9% 3
Transportation 60307 5% 2
Travel 38789 12% 6
Other commercial
services
154285 9% 3
Finance and insurance
Value added (mill. US$) 141168
% of total value added 4.4%
Production and Employment
Employment (% of tot.
employment)
2.9%
Trade - Balance of Payments (mill. US$)
Value % Change
Imports 9154 33%Financial
services Exports 13633 16%
Imports 4607 15%Insurance
services Exports 6664 9%
(Data source: WTO:Service profiles 2011)
Finally, table 4 shows the service trade in Germany and industries’ development and
information in 2011. We find that employment who engaged in services share a significant
proportion of the total labor force, about 67.3%, higher than Chinese services industries labor ratio
40.4% at the same period. At the same time, we can also see that the three traditional services of
the service structure in Germany are developing rapidly and have leading positions in the world.
That undeniable ensure the stability of the development of trade in service in German as well as
maintain the position of service trade in Germany in the whole world. The more important thing is
that the high technology and capital intense services industries such as: financial and insurance
industries have been improved recently. In addition, there are much more investment in these
industries recently. So that is much more benefit to the development of service trade in Germany.
2 The selection of the evaluated function and index of service
trade competitiveness between China and Germany
2.1 The selection of the evaluated index
2.1.1 Trade Competition Index
Trade competition index refers to a ratio of the industry trade balance of its total, to reflect
the industry's competitiveness in the international market, and that reflects whether a country is a
net importer or net exporter in the industry, and the scale of its net imports or net exports. The
formula is as follows:
IE
IE
TC
+
−
=
[ ]11−∈TC . When TC=1, it indicates that the industry is completely surplus; When TC=0,
it indicates that the industry equal to the average of the world; When TC=-1, it indicates that the
industry is completely deficit. The larger the value of TC, the stronger competiveness does the
industry have.
TC between China and Germany from 1990 to 2011
-0.3
-0.2
-0.1
0
0.1
0.2
0.3
1990
1992
1994
1996
1998
2000
2002
2004
2006
2008
2010
YEAR
TC
Chinese TC
German TC
Figure5: Trade competitive index between China and Germany from 1990 to 2011. (Data source:
UNCTAD)
Figure 5 is a line graph drawn by the calculated service trade between China and Germany
Competitiveness Index 1990-2011. We can find that China and German have in the state of service
trade competitive disadvantage for a long time, but the disadvantage has been controlled within
-0.3, it is relative small. At the same time, we also find that Chinese service trade has show a
significantly higher development at the beginning of the 21st
century, but still being a slow
downward trend with slight concussion as a whole. However, the German service trade
competitiveness bottomed out in 2000, although the rebound speed is slightly weak, but since
2009, the German service trade competitiveness index has more than China and gradually move
closer to the world average.
2.1.2 Market Share
Market share refers to a commodity exports accounted for the proportion of total global
exports, can reflect the competitive position of such goods. The greater the value, the higher
competitive strength does such goods have, and the higher status in the international market. The
formula is as follows:
Ewj
Eij
MSij =
Eij indicates that the exports of a commodity in one country; Ewj indicates that the total
exports of the commodity in the world.
MS between China and Germany from 1990 to 2011
0.00%
1.00%
2.00%
3.00%
4.00%
5.00%
6.00%
7.00%
8.00%
1990
1992
1994
1996
1998
2000
2002
2004
2006
2008
2010
YEAR
MS
Chinese MS
German MS
Figure6: Market share between China and Germany from 1990 to 2011. (Data source: UNCTAD
Figure 6 is a line graph drawn by the calculated service trade between China and Germany
Market Share 1990-2011. This figure shows us the level of the conditions of service trade between
the two countries. The international market share of service trade in Germany is significantly
higher than the index of China, always about 6.3%, but it also showed the downward trend in
recent years. On the other hand, On the other hand, albeit from a low, slow pace of development,
but the international market share of Chinese service trade rose by nearly four percentage points in
two decades and has been a very positive development prospects uncertain.
2.1.3 Index of Revealed comparative Advantage
Index of Revealed comparative Advantage refers to the proportion of a commodity exports in
one country divide by the whole export in the world, to reflect the advantage or disadvantage of
the commodity in the world market. The formula is as follows:
Ewt
Ewj
Eit
Eij
RCAij =
Eij indicates that the exports of a commodity in one country; Ewj indicates that the total
exports of the commodity in the world; Eit indicates the country's total foreign trade; Ewt
indicates the world's total foreign trade.
According to regulations, the following rules are to determine the comparative advantage of a
commodity in one country. When RCA's value is less than 0.8, it indicates a weak competitive;
when RCA's value in the 0.8-1.25, indicating that the competitiveness is ok; while when the value
of the RCA in 1.25-2.5, it indicates a relatively strong competitive; when RCA's value is greater
than 2.5, it indicates a very strong competitive.
RCA between China and Germany from 1990 to 2011
0
0.1
0.2
0.3
0.4
0.5
0.6
0.7
0.8
0.9
1990
1992
1994
1996
1998
2000
2002
2004
2006
2008
2010
YEAR
RCA
Chinese RCA
German RCA
Figure7: Index of Revealed comparative Advantage between China and Germany from 1990 to
2011. (Data source: UNCTAD)
Figure 7 is a line graph drawn by the calculated service trade between China and Germany
Index of Revealed comparative 1990-2011. From the figure, we find that the RCA of German
service trade rise slowly but still close to 0.8, it indicates that the competiveness of German
service trade is fair and shows an upward trend. However, Chinese service trade comparative
advantage only showing a slight rise in the early years, but now it bogged down in a worse
situation. This phenomenon indicates that the competitiveness of Chinese service trade has not
improved substantially.
2.2 The weights of the evaluation function and the dimensionless
quantization of index
We have used different indicators to evaluate the analysis of the development of trade in
services between the two countries, however, the each direction indicators evaluation is different,
and analysis of each indicator obtained different results. So we take advantage of the performance
evaluation method to establish an evaluation function to determine the weight of each indicator, in
order to get the accurate values which determine the level of competitiveness of service trade
between China and Germany.
From what have been discussed above, there are the following indicators: ①total trade in
services; ② annual growth rate of service trade; ③ the proportion of service export in GDP; ④
the proportion of service labor in total labor; ⑤ the proportion of service trade exports in total
trade exports; ⑥ service trade competitiveness index; ⑦ service trade international market
share index; ⑧Index of Revealed comparative of service trade; ⑨ service sector FDI. Now, we
use the data of 2011 for example to analysis of the competitiveness of trade in services between
the two countries.
Table5: Service trade indexes between China and Germany in 2011 (unit: Million USD; %)
INDEXES CHINA GERMANY
total trade in services 420684 548409
annual growth rate of service trade 15.4% 9.4%
the proportion of service export in GDP 2.5% 7.1%
the proportion of service labor in total
labor
40.4% 67.3%
the proportion of service trade exports in
total trade exports
10.5% 15.9%
service trade competitiveness index -0.12 -0.05
service trade international market share 4.3% 6.1%
service trade revealed comparative index 0.46 0.75
Input 861498 792646service sector FDI
output 242552 1006903
(Data source: UNCTAD, WTO, service profiles 2011)
2.2.1 Determine the weight by relative comparison method
Relative comparison method [1]
is an empirical scoring method; there are nine indicators, it is
necessary to establish a 9 * 9 square. We use [0,1] scoring method to make pair comparison
between each indicators, then add the scores of each indicators, finally use normalization to get
the weights of each one. Aij is the score, i, j refer to two different indicators. When the indicator i
is more important than the index j, Aij is equal to 1; when the indicator i is equally important to
indicator j, Aij is equal to 0.5; when the indicator i is less important than the index j, Aij equals 0.
The calculated square is as follows:
Table6: Determine the weight by relative comparison method
INDEXES F
1
F
2
F
3
F
4
F
5
F
6
F
7
F
8
F
9
F
1
score weig
ht
0
F1 total trade in services  0 0 0 0 0 0 0 0 1 1 0.02
F2 annual growth rate of service trade 1  0 0 0 0 0 0 0 1 2 0.04
F3 the proportion of service export in GDP 1 1  1 0.5 0 0 0 0 1 4.5 0.1
F4 the proportion of service labor in total 1 1 0  0 0 0 0 0 1 3 0.07
F5 the proportion of service trade exports
in total trade exports
1 1 0.5 1  0 0 0 0 1 4.5 0.1
F6 service trade competitiveness index 1 1 1 1 1  0 0 1 1 7 0.16
F7 service trade international market share 1 1 1 1 1 1  0 1 1 8 0.18
F8service trade revealed comparative index 1 1 1 1 1 1 1  1 1 9 0.2
F9 service sector FDI 1 1 1 1 1 0 0 0  1 6 0.13
F10dummy index 0 0 0 0 0 0 0 0 0  0 0
TOTAL 45 1
2.2.2 The dimensionless quantization by threshold method
After we have identified the weights of each indicator, we also have to change the actual
value of each indicator into the evaluation values in order to compare the competitiveness of
service trade between the two countries. The threshold method [2]
means maximum or minimum
values, the bigger values, and the better competitiveness. So we should use the maximum value
method. Because the units of each indicator are different, so we stipulate when the index in
country A is significantly larger than country B, country A get 100 points; when the index in
country B is significantly larger than country A, country A get 0 point; when the two countries
have similar scores, each country get 50 points. Finally, we could determine which country’s
service trade is more competitive according to the weights of each indicator as well as the points
of each. The calculation process and result are in the follows:1
Table7: The dimensionless quantization by threshold method
Actual value Evaluation valueINDEXES
China Germany China Germany
weight
F1 total trade in services 420684 548409 50 50 0.02
F2 annual growth rate of service trade 15.4% 9.4% 100 0 0.04
F3 the proportion of service export in
GDP
2.5% 7.1% 0 100 0.1
F4 the proportion of service labor in total 40.4% 67.3% 0 100 0.07
F5 the proportion of service trade exports
in total trade exports
10.5% 15.9% 50 50 0.1
F6service trade competitiveness index -0.12 -0.05 0 100 0.16
F7service trade international market
share
4.3% 6.1% 50 50 0.18
F8service trade revealed comparative
index
0.46 0.75 50 50 0.2
Input 861498 792646F9service sector
FDI output 242552 1006903
0 100 0.13
[1] Hao Hai, Zong Jiafeng, System analysis and evaluation methods [M], Economic Science Press, 2007(12), 76.
[2] Hao Hai, Zong Jiafeng, System analysis and evaluation methods [M], Economic Science Press, 2007(12), 82.
TTOTAL POINTS 29 71
2.3The results of the evaluation of the competitiveness of service
trade between the two countries
As a calculating result, we know that the competitiveness of service trade in China is
significantly lower than the service trade competitiveness in Germany. Through the above analysis,
we obtain that there are three major issues exist in service trade of the two countries.
service trade deficit from 1990 to 2011
-70000
-60000
-50000
-40000
-30000
-20000
-10000
0
10000
1990
1992
1994
1996
1998
2000
2002
2004
2006
2008
2010
YEAR
DEFICIT
Chinese deficit
German deficit
Figure8: service trade deficit from 1990 to 2011. (unit: Million USD) (Data source:
UNCTAD)
First of all, the service trade competitiveness index is negative; it indicates that the two
countries are net importer of service trade. The deficit is serious and the index is lower than the
international average. Figure 8 shows the service trade deficit in China and Germany from 1990 to
2011. The German service trade deficit is more serious than China for a long period of time;
however, it shows a slightly downward trend in recent years. At the same time, Chinese service
trade deficit has increased every year in a fast growth rate, so it is less competitive than Germany.
Second of all, the international market share index is relatively low.. Although Germany and
China rank the third and fourth place in the world, and the international market share of each
country’s service trade increased a lot, the index of each is far lower than the U.S and the U.K.
German and Chinese service trade have achieved certain positions in the international market,
however, this weak status are suppressed by the larger market share of the U.S and the U.K.
Similarly, there still a long way to go for China to keep up with the competitiveness in German
service trade.
Last of all, the index of revealed comparative advantage is relatively low. The value of
RCA index in both countries are under 0.8 for a long period of time. It indicates that both the two
countries have quite weak competitiveness in service trade. However, the value of RCA index in
Germany rises; it shows positive prospects for the development in the future, the competitiveness
is improving. On the other hand, the value of RCA index falls instead of rises, service trade in
China is less competitive than Germany.
There are several aspects in service trade that Germany is superior to China. The proportion
of service export in GDP; the proportion of service labor in total labor; the proportion of service
trade exports in total trade exports and the service sector FDI. These aspects show the positive
activities of service trade in one country. China has to adjust the structure and direction of service
trade in order to make an improvement in these aspects in the future.
Nevertheless, we could also see that the annual growth rate of service trade in China is
significantly better than Germany. Although service trade in China has a low starting point, it also
has a strong enthusiasm and momentum toward development.
3 AHP analyses of the factors which influence the
competitiveness of service trade between China and Germany
Through the above analysis and comparison of the various indicators of service trade
between the two countries, we know that the competitiveness of German service trade is better
than China. However, what causes the differences in services trade between the two countries?
Now we have to analyze the factors that affect the competitiveness of service trade between the
two countries, so as to arrive to the revelation to conducive the development of Chinese service
trade.
3.1The rationale of AHP
Analytic Hierarchy Process [3]
is proposed in the late 1970s by the United States Operations
Research T·L·Satty. AHP is a multi-level weights analytical method; it could combine people's
subjective judgment, it is a combination of concise qualitative and quantitative analysis method. It
is characterized by the in-deep analysis of the nature of complex evaluation issues, factors and
their intrinsic relationship. AHP use less quantitative information to digitalize the evaluated
thinking process in order to solve the multi-objective, multi-criteria or unstructured complex
issues. When using AHP method, we should establish the hierarchical structure of the evaluation
model first. We have to analyze scope, objective, influencing factors and relationships between
various factors of the evaluation issues. The highest layer of the evaluation is the target; the
middle layers are the intermediate links to achieve the overall goal; the lowest layers are the
programs selected by the evaluators. The second step is to establish the scale of relative
importance as well as the judgment matrix in order to comparing the impacts of various factors.
2
Finally, calculate matrixes and get the result.
According to the factors which influence the competitiveness of service trade, we use AHP to
evaluate the two countries again, so we can know which factor causes the differences between
them.
3.2 Factors which influence the service trade
Factors which influence the service trade can be dividing into two main categories.
One is the factors which influence the service trade competitive assets, including ①the size
of the population factor (X1) refers to the proportion of service labor in total labor; ②humanity
development factor (X2) including lifetime, knowledge and income. the lifetime is represented by
the life expectancy; the knowledge is represented by the adult literacy rate; the income is
represented by the per capita income with the measure of purchasing power parity; ③ knowledge
[3] L·T·Satty, Decision making with the analytic hierarchy process [J], Services Sciences, 2008 (Vol.1, No.1):
83-98
resource factor (X3) refers to the proportion of expenditures on research and development in total
GDP.
The other is the factors which influence the service trade competitive process. ①service
trade scale factor (X4) refers to service trade international market share; ②trade structure factor
including the proportion of service trade export in total export (X5) and the proportion of
high-tech products export in total export(X6); ③Core Competences factor (X7) refers to the ratio
of “Fortune 500” companies in one country; ④trade effectiveness factor (X8) refers to the per
capita GDP; ⑤potential growth in service trade factor including the service trade industry labor
productivity (X9) refers to the service sector GDP divided by service industry labor force, as well
as the growth rate of service trade (X10).
3.3 Recursive hierarchy structure model analysis
Table8 shows the factors which influence the competitiveness of service trade. We use the
datum of China, Germany and the U.S in 2011.
Figure9: the AHP model to evaluate the competitiveness of service trade
Table8: indicators’ value of factors influencing service trade in 2011
FACTORS INDICATORS CHINA GERMANY USA
the size of the
population
the proportion of service labor in total
labor
40.4
%
67.3% 67.7%
life expectancy (unit: year) 73 80 78
adult literacy rate 94% 100% 100%humanity
development per capita income with the measure of
purchasing power parity
8390 40230 48820
knowledge
resource
the proportion of expenditures on
research and development in total GDP
1.47
%
2.82% 2.79%
service trade
scale
service trade international market share 4.3% 6.1% 14.1%
trade structure
the proportion of service trade export in
total export
8.8% 14.3% 28.5%
China Germany USA
Compet
itivenes
s
Service
labor
Life
knowle
dge
income
R&D
expendi
ture
Market
share
Service
export
High-te
ch
export
‘Fortun
e 500’
compan
y
Per
capital
GDP
Labor
producti
vity
Growth
rate
the proportion of high-tech products
export in total export
28% 15% 20%
Core
Competences
the ratio of “Fortune 500” companies in
one country
14.6
%
8.2% 26.4%
trade
effectiveness
per capita GDP(unit: dollar) 5445 44060 48112
service trade industry labor
productivity(unit: dollar/labor)
7264 20101 12542potential
growth in
service trade growth rate of service trade 7.0% 8.7% 8.9%
(Data source: UNCTAD, WTO, service profiles 2011, The World Bank)
3.3.1 The scale of relative importance
We have already established the hierarchy evaluation model, figure 9. Due to the units of
various factors are different, so AHP method uses the scale of relative importance [4]
to change the
relative importance between two factors into a measurable number.
Table9: the scale of relative importance
The value of Aijscale
difinition Explication
1 Factor i is equal to factor j contribution to the objectives is same
3 Factor i is slightly important than factor j a slight preference for one factor
5 Factor i is important than factor j a preference for one factor
7 Factor i is more important than factor j a significant preference for one factor
9 Factor i is extremely important than factor j a extreme preference for one factor
2,4,6,8 refer to the intermediate value between the above adjacent judgment
reciprocal If the ratio of the importance of the factor i and factor j is Aij,so the ratio of the
importance of the factor j and factor i Aji=1/Aij.
3.3.2 Comparative judgment matrix and calculation
On the basis of the relative importance of the judgment has been established. First, we have
to establish a 10-order judgment matrix to compare the relative importance between the criterions,
as shown in Table 10; then we have to compare the datum of these three countries in 2011
according to the ten criterions, as well as establish ten 3-order judgment matrixes, as shown in
Table 12.
Table10: The judgment matrix about the ten criterions
X1 X2 X3 X4 X5 X6 X7 X8 X9 X10
X1 the ratio of service labor 1 4 5 1/7 1/6 4 3 2 1/5 1/3
X2lifetime,knowledge, income 1/4 1 1/2 1/8 1/7 3 1/3 1/4 1/6 1/5
X3 the ratio of R&D outlay 1/5 2 1 1/8 1/5 3 1/2 1/3 1/7 1/6
X4 service trade MS 7 8 8 1 3 7 6 5 2 4
X5 the ratio of service export 6 7 5 1/3 1 6 5 4 2 3
X6 the ratio of hi-tech export 1/4 1/3 1/3 1/7 1/6 1 1/3 1/4 1/6 1/5
X7 the ratio of ‘Fortune 500’ 1/3 3 2 1/6 1/5 3 1 1/3 1/5 1/4
X8 per capita GDP 1/2 4 3 1/5 1/4 4 3 1 1/4 1/3
X9 service labor productivity 5 6 7 1/2 1/2 6 5 4 1 1/2
X10 growth rate of service 4 5 6 1/4 1/3 5 4 3 2 1
There is several calculation of the matrix consistency as follows: first, normalize each
column of the matrix A.
A=


































123453/14/1654
2/114562/12/1765
3/14/11344/15/1342/1
4/15/13/1135/16/1233/1
5/16/14/13/116/17/13/13/14/1
3245613/1576
4256731887
6/17/13/12/135/18/1125/1
5/16/14/13/137/18/12/114/1
3/15/12346/17/1541
































100.0246.0149.0142.0119.0056.0084.0159.0124.0163.0
050.0123.0198.0177.0143.0084.0167.0185.0149.0204.0
033.0031.0050.0106.0096.0042.0067.0080.0099.0020.0
025.0025.0017.0036.0071.0034.0056.0053.0074.0014.0
020.0020.0012.0012.0024.0028.0048.0009.0008.0010.0
301.0246.0198.0177.0143.0168.0111.0132.0174.0245.0
401.0246.0248.0213.0167.0503.0335.0211.0198.0285.0
017.0018.0017.0019.0071.0033.0042.0026.0050.0008.0
020.0020.0012.0012.0071.0024.0042.0013.0025.0010.0
033.0025.0099.0106.0095.0028.0048.0132.0099.0041.0
Then, make the summation of each row of the matrix; normalize it again to get the
eigenvector.
































=
134.0
148.0
062.0
040.0
021.0
189.0
280.0
030.0
025.0
071.0
~w
Next, using the formula: wwA ~max~ λ= . maxλ is the maximum eigenvalue of matrix A.
Normalize column vector
Sum the row and normalize again
According to the Perron Theorem, a positive matrix has one positive maximum eigenvalue as well
as only one specific non-negative eigenvector. Now, the eigenvector is w~
, we can get the
maxλ according to the formula as follows.
































=′
603.1
739.1
676.0
430.0
209.0
305.2
313.3
314.0
263.0
795.0
~wA , because wwA ~max~ λ= . The calculation process as follows.



+++++++++


=
134.0
603.1
148.0
739.1
062.0
676.0
040.0
430.0
021.0
209.0
189.0
305.2
280.0
313.3
030.0
314.0
025.0
263.0
071.0
795.0
10
1
maxλ
153.11max ≈∴λ
So the eigenvector and eigenvalue of matrix A is:
{ }134.0148.0062.0040.0021.0189.0280.0030.0025.0071.0~ =w
153.11max =λ
However, only calculate the eigenvectors and eigenvalues of the A matrix is not enough; we
also have to test the uniformity of value we obtained before. Because, when A is completely
uniform, we can gat the accurate ordering vector feature, namely the eigenvector. However, the
actual situation is that the matrix A is difficult to be completely uniform, but it can be proved
when the closer the maxλ to the order n, the closer the solution obtained to the correct w , so the
judgment we made is more reliable, the judgment matrix we got is closer to completely uniformi,
then the ordered eigenvectors we achieved are more correct.
The uniformity index CI is generally used to check the evaluators and judge the uniformity.
The formula is as follows:
1
max
−
−
=
n
n
CI
λ
At the same time, we also need to use the average random uniformity index RI [5]
, which is
used as a measure of order judgment matrix to judge whether the matrix has satisfactory
uniformity or not.
Table11: average random consistency index RI
order 3 4 5 6 7 8 9 10 11 12 13 14 15
RI 0.52 0.89 1.12 1.26 1.36 1.41 1.46 1.49 1.52 1.54 1.56 1.58 1.59
When the order of judgment matrix is bigger than 2, we have to use anther index, namely the
Random coincidence coefficient CR. The formula of CR is as follows:
RI
CI
CR =
3
When the value of CR is at about 10%, we consider that the judgment matrix has a
satisfactory uniformity.
In this case,
128.0
110
10153.11
1
max
≈
−
−
=
−
−
=
n
n
CI
λ
According to the table 11, 49.1=RIΘ
086.0
49.1
128.0
≈==∴
RI
CI
CR
As a result, the value of CR is 8.6%, so we can say the judgment matrix has satisfactory
uniformity.
Now, we have to establish several judgment matrixes to evaluate the competitiveness of these
three countries according to the ten factors.
Table12: The judgment matrix about the comparison between the three countries
①the ratio of service labor CHINA GERMANY USA
CHINA 1 1/5 1/5
GERMANY 5 1 1
USA 5 1 1
ordering vector( w~ ) 0.10 0.45 0.45



≈


++










=





=′





=










=′ 007.3
45.0
40.1
45.0
40.1
10.0
28.0
3
1
max,
40.1
40.1
28.0
~;
45.0
45.0
10.0
~;
45.045.045.0
45.045.045.0
10.010.010.0
λwAwA
0067.0
52.0
0035.0
,52.0;0035.0
13
3007.3
1
max
≈==∴==
−
−
=
−
−
=
RI
CI
CRRI
n
n
CI Θ
λ
②humanity development CHINA GERMANY USA
CHINA 1 1/8 1/9
GERMANY 8 1 1/2
USA 9 2 1
ordering vector( w~ ) 0.06 0.36 0.58



≈


++










=





=′





=










=′ 048.3
58.0
84.1
36.0
13.1
06.0
17.0
3
1
max,
84.1
13.1
17.0
~;
58.0
36.0
06.0
~;
62.064.050.0
31.032.044.0
07.004.006.0
λwAwA
046.0
52.0
024.0
,52.0;024.0
13
3048.3
1
max
≈==∴==
−
−
=
−
−
=
RI
CI
CRRI
n
n
CI Θ
λ
③the ratio of R&D outlay CHINA GERMANY USA
[5] Hao Hai, Zong Jiafeng, System analysis and evaluation methods [M], Economic Science Press, 2007(12), 120.
CHINA 1 1/7 1/6
GERMANY 7 1 2
USA 6 1/2 1
ordering vector( w~ ) 0.07 0.58 0.35



≈


++










=





=′





=










=′ 032.3
35.0
06.1
58.0
77.1
07.0
211.0
3
1
max,
06.1
77.1
211.0
~;
35.0
58.0
07.0
~;
32.030.043.0
63.061.050.0
05.009.007.0
λwAwA
031.0
52.0
016.0
,52.0;016.0
13
3032.3
1
max
≈==∴==
−
−
=
−
−
=
RI
CI
CRRI
n
n
CI Θ
λ



≈


++










=





=′





=










=′ 217.3
75.0
62.2
19.0
60.0
06.0
18.0
3
1
max,
62.2
60.0
18.0
~;
75.0
19.0
06.0
~;
80.085.060.0
11.012.033.0
09.003.007.0
λwAwA
138.0
52.0
072.0
,52.0;072.0
13
3217.3
1
max
≈==∴==
−
−
=
−
−
=
RI
CI
CRRI
n
n
CI Θ
λ



≈


++










=





=′





=










=′ 217.3
75.0
62.2
19.0
60.0
06.0
18.0
3
1
max,
62.2
60.0
18.0
~;
75.0
19.0
06.0
~;
80.085.060.0
11.012.033.0
09.003.007.0
λwAwA
138.0
52.0
072.0
,52.0;072.0
13
3217.3
1
max
≈==∴==
−
−
=
−
−
=
RI
CI
CRRI
n
n
CI Θ
λ
⑥the ratio of hi-tech export CHINA GERMANY USA
CHINA 1 6 4
GERMANY 1/6 1 1/3
USA 1/4 3 1
ordering vector( w~ ) 0.69 0.09 0.22
④ service trade market share CHINA GERMANY USA
CHINA 1 1/5 1/9
GERMANY 5 1 1/7
USA 9 7 1
ordering vector( w~ ) 0.06 0.19 0.75
⑤ the ratio of service export CHINA GERMANY USA
CHINA 1 1/5 1/9
GERMANY 5 1 1/7
USA 9 7 1
ordering vector( w~ ) 0.06 0.19 0.75



≈


++










=





=′





=










=′ 056.3
22.0
66.0
09.0
28.0
69.0
11.2
3
1
max,
66.0
28.0
11.2
~;
22.0
09.0
69.0
~;
19.030.018.0
06.010.011.0
75.060.071.0
λwAwA
054.0
52.0
028.0
,52.0;028.0
13
3056.3
1
max
≈==∴==
−
−
=
−
−
=
RI
CI
CRRI
n
n
CI Θ
λ



≈


++










=





=′





=










=′ 255.3
72.0
58.2
06.0
18.0
22.0
70.0
3
1
max,
58.2
18.0
70.0
~;
72.0
06.0
22.0
~;
78.056.083.0
09.006.003.0
13.038.014.0
λwAwA
245.0
52.0
1275.0
,52.0;1275.0
13
3255.3
1
max
≈==∴==
−
−
=
−
−
=
RI
CI
CRRI
n
n
CI Θ
λ



≈


++










=





=′





=










=′ 052.3
57.0
85.1
37.0
20.1
06.0
16.0
3
1
max,
85.1
20.1
16.0
~;
57.0
37.0
06.0
~;
62.064.047.0
31.032.047.0
07.004.006.0
λwAwA
05.0
52.0
026.0
,52.0;026.0
13
3052.3
1
max
===∴==
−
−
=
−
−
=
RI
CI
CRRI
n
n
CI Θ
λ
⑨service labor productivity CHINA GERMANY USA
CHINA 1 1/9 1/5
GERMANY 9 1 6
USA 5 1/6 1
ordering vector( w~ ) 0.06 0.73 0.21



≈


++










=





=′





=










=′ 155.3
21.0
63.0
73.0
53.2
06.0
18.0
3
1
max,
63.0
53.2
18.0
~;
21.0
73.0
06.0
~;
14.013.033.0
83.078.060.0
03.009.007.0
λwAwA
⑦ the ratio of ‘Fortune 500’ CHINA GERMANY USA
CHINA 1 6 1/6
GERMANY 1/6 1 1/9
USA 6 9 1
ordering vector( w~ ) 0.22 0.06 0.72
⑧ per capita GDP CHINA GERMANY USA
CHINA 1 1/9 1/9
GERMANY 9 1 1/2
USA 9 2 1
ordering vector( w~ ) 0.06 0.37 0.57
149.0
52.0
0775.0
,52.0;0775.0
13
3155.3
1
max
≈==∴==
−
−
=
−
−
=
RI
CI
CRRI
n
n
CI Θ
λ



≈


++










=





=′





=










=′ 67.2
40.0
20.1
40.0
20.1
20.0
40.0
3
1
max,
20.1
20.1
40.0
~;
40.0
40.0
20.0
~;
40.040.040.0
40.040.040.0
20.020.020.0
λwAwA
Because 3max ≥λ ,so here we set 3max =λ 。
0;0
13
33
1
max
==∴=
−
−
=
−
−
=
RI
CI
CR
n
n
CI
λ
From what have been calculated above, the results are as follows in table 13. We can see that
most of the Random coincidence coefficient CR values are in the range of 10%, this shows that
they have more satisfactory uniformity. Because there are so many matrixes we calculated here,
nonuniformity is inevitable. We could allow the value of CR bigger than 10%, but within 20%.
Table13: the calculated result of the second and third layers
Second
w~
T
0.071 0.025 0.030 0.280 0.189 0.021 0.040 0.062 0.148 0.134
0.10 0.06 0.07 0.06 0.06 0.69 0.22 0.06 0.06 0.20
0.45 0.36 0.58 0.19 0.19 0.09 0.06 0.37 0.73 0.40
Third
w~
k
0.45 0.58 0.35 0.75 0.75 0.22 0.72 0.57 0.21 0.40
maxλ k 3.007 3.048 3.032 3.217 3.217 3.056 3.255 3.052 3.155 3.000
CI k 0.004 0.024 0.016 0.072 0.072 0.028 0.1275 0.026 0.078 0.000
CR k 0.67% 4.6% 3.1% 13.8% 13.8% 5.4% 24.5% 5.0% 14.9% 0%
RI(n=3)=0.52
3.3.2 Comparative judgment and calculation
Table10 shows the comparative judgment matrix about the ten criteria in the second layer.
Table 12 shows the mutual comparative judgment matrix among the three countries in the third
layer. Then table 14 would show the final ordering vector for the competitiveness of each country
according to the total ordering principle.
Table14: The total ordering of the competitiveness in each country
Total
Order
Factors
and
criterio
n
the
ratio
of
servic
e
labor
hum
anity
deve
lopm
ent
the
ratio
of
R&D
outla
y
servi
ce
trade
mark
et
share
the
ratio
of
servi
ce
EX
the
ratio
of
hi-te
ch
EX
the
ratio
of
‘Fort
une
500’
per
capit
a
GDP
servi
ce
labor
prod
uctiv
ity
grow
th
rate
of
servi
ce
⑩ growth rate of service CHINA GERMANY USA
CHINA 1 1/2 1/2
GERMANY 2 1 1
USA 2 1 1
ordering vector( w~ ) 0.20 0.40 0.40
0.071 0.025 0.030 0.280 0.189 0.021 0.040 0.062 0.148 0.134
China 0.10153 0.10 0.06 0.07 0.06 0.06 0.69 0.22 0.06 0.06 0.20
Germany 0.33633 0.45 0.36 0.58 0.19 0.19 0.09 0.06 0.37 0.73 0.40
USA 0.56214 0.45 0.58 0.35 0.75 0.75 0.22 0.72 0.57 0.21 0.40
Now we can use the synthetic formula to synthesis the ordering vector of three countries.
China:
10153.0134.02.0148.006.0062.006.004.022.0021.069.0
189.006.028.006.003.007.0025.006.0071.01.0
=×+×+×+×+×
+×+×+×+×+×
Germany
33633.0134.04.0148.073.0062.037.004.006.0021.009.0
189.019.028.019.003.058.0025.036.0071.045.0
=×+×+×+×+×
+×+×+×+×+×
USA:
56214.0134.04.0148.021.0062.057.004.072.0021.022.0
189.075.028.075.003.035.0025.058.0071.045.0
=×+×+×+×+×
+×+×+×+×+×
The synthetic ordering vector is as follows:
)( )( TT
wwww 562.0336.0102.0321~ ==
4 Comprehensive comparisons of the reasons which influence the
competitiveness of service trade between China and Germany
Now we have got the ordering vector of the competitiveness of service trade among the three
countries.
)( )( TT
wwww 562.0336.0102.0321~ ==
Obviously, there exists a huge competitiveness gap between China, Germany with the U.S.
That means there are certain problems in the development of service trade in the two countries. In
addition, as I have mentioned in the chapter 2, the competitiveness of service trade in Germany is
significantly better than China.
4.1 Germany
As I have discussed in the chapter 2, we know that there are lots of advantages in the
development of service trade in Germany. For instance: the strong infrastructure, the stable
traditional service industry, mighty new high-tech service industry as well as the rich service labor
resources and powerful labor productivity. So, Germany plays an important role in the
international service market.
The development of service trade in Germany superior to China in many ways, such as: the
abundant service labor resources, the harmonious humility situation, higher per capita GDP and
relatively high service industry productivity. However, there also are some disadvantages. For
example: the service trade international market share and the proportion of service trade export.
There is still a lot of hard work to do for Germany so as to bridge the gap to the U.S. in addition,
the annual growth rate of service is even inferior to China. All the evidences show that there are
some strong resistances restrict the development of service trade in Germany. So the growth rate is
slightly weaker.
However, there are still some disadvantages in the development in Germany.
Firstly, Germany is a central European country. Comparing with the U.S and China, it has the
shortcoming in the following aspects, such as: the population, the land area, resources. Therefore,
these aspects become one of the major drawbacks in the development of service trade.
Secondly, after joining the European Union, Germany abandons the strong currency Mark.
Undoubtedly, it would influence the financial service. Additionally, there are the preferential rights
among the countries in the EU. So, the revenue of service trade in Germany decreases the motive
force of development decrease.
Thirdly, the world has not revived from the crisis yet. The European debt crisis happened in
recent years make the economic situation even more weak. As this point, Germany not only has to
protect its domestic economy, but also has to help and support Greek and Italy. Undoubtedly, these
kind of worse situations become one of the major reasons to restrict the rapid development of
service trade in Germany.
4.2 China
From what I have discussed above, the ordering vector shows that the development of service
trade in China is not optimistic. There is a little advantage in few aspects, such as: the proportion
of high-tech products export in total trade export and the proportion of “Fortune 500” companies
of China. The high proportion of high-tech products export indicates that China has the powerful
potential of high-tech R&D. China should take advantage of this power into the development of
service trade.
As far as I am concerned, there are several disadvantages in the development of service trade
in China.
Firstly, for example: the weak humility development, the low per capita GDP, the low ratio of
service labor and the lower labor productivity. That indicates that there is not a stable foundation
of the service trade development in China. A weak foundation is harmful to the development of
service trade in the future.
Secondly, the lower proportion of R&D expenditures indicates that the structure of service
trade in China is unreasonable. The huge proportion of traditional service is not only costly but
also earn a little. From figure 10 and figure 11, we can find that the development of creative
service in China increase very slowly, the amount is also much lower then that in Germany.
Thirdly, the lower international market share of service trade in China and the low proportion
of service export in total trade export indicates that China as a traditional trade country is still
stuck in the model of single commodity trade.
Import in creative service, 2000-2010
0
5000
10000
15000
20000
25000
2000
2001
2002
2003
2004
2005
2006
2007
2008
2009
2010
YEAR
IMPORTS
Germany-research and
deveopment
Germany-
personal,cultural,recreat
ionl service
Germany-
advertising,market
researc
China-research and
deveopment
China-
personal,cultural,recreat
ionl service
China-advertising,market
research
Figure10: Import in creative service, 2000-2010 (unit: Million USD) (Data source:
UNCTAD)
Export in creative service, 2000-2010
0
5000
10000
15000
20000
25000
2000
2001
2002
2003
2004
2005
2006
2007
2008
2009
2010
YEAR
EXPORTS
Germany-reasearch and
development
Germany-
persnal,cultural,recreati
onal service
Germany-
advertising,market
research
China-reasearch and
development
China-
persnal,cultural,recreati
onal service
China-advertising,market
research
Figure11: Export in creative service, 2000-2010 (unit: Million USD) (Data source:
UNCTAD)
As we all know, China has a large and cheap labor resources, so it has the advantage to
develop the labor-intensive trade. However, the developments of countries in South America or
East South Asia are gradually shake the status of China as the world factory with plenty cheap
labor. In addition, Labor is the basis for the rapid development of China's economy, but also a
resistance to restricting the development of high-tech capital-intensive economy in China. Huge
population resulted in a series of social problems: the gap between the rich and the poor, the
geographical gap, these disharmonious factors seriously affect the development of service trade in
China. At the same time, the traditional concept of the majority of the people, value product than
service labor. So labor involved in the services sector is relatively little, it has also become another
reason for restricting the development of service trade in China.

More Related Content

What's hot

Ulster Bank NI June 2019 PMI Slide pack
Ulster Bank NI June 2019 PMI Slide packUlster Bank NI June 2019 PMI Slide pack
Ulster Bank NI June 2019 PMI Slide packRichard Ramsey
 
74d60d15 dc42-48a3-8dc8-7a2297f0be22
74d60d15 dc42-48a3-8dc8-7a2297f0be2274d60d15 dc42-48a3-8dc8-7a2297f0be22
74d60d15 dc42-48a3-8dc8-7a2297f0be22ruchaa
 
Ulster Bank Northern Ireland PMI January 2019 Slide Pack
Ulster Bank Northern Ireland PMI January 2019 Slide PackUlster Bank Northern Ireland PMI January 2019 Slide Pack
Ulster Bank Northern Ireland PMI January 2019 Slide PackRichard Ramsey
 
Ulster Bank NI PMI March 2020
Ulster Bank NI PMI March 2020Ulster Bank NI PMI March 2020
Ulster Bank NI PMI March 2020Richard Ramsey
 
Industrial Market Report 2019
Industrial Market Report 2019Industrial Market Report 2019
Industrial Market Report 2019TMS_Consultancy
 
Economic climate for manufacturing 01 10
Economic climate for manufacturing 01 10Economic climate for manufacturing 01 10
Economic climate for manufacturing 01 10Alex Chatha
 
Ulster Bank Northern Ireland PMI February 2021 Slide Pack
Ulster Bank Northern Ireland PMI February 2021 Slide PackUlster Bank Northern Ireland PMI February 2021 Slide Pack
Ulster Bank Northern Ireland PMI February 2021 Slide PackRichard Ramsey
 
Latvijas Banka Monthly Newsletter 4/2018
Latvijas Banka Monthly Newsletter 4/2018Latvijas Banka Monthly Newsletter 4/2018
Latvijas Banka Monthly Newsletter 4/2018Latvijas Banka
 
Latvijas Banka Monthly Newsletter 8/2016
Latvijas Banka Monthly Newsletter 8/2016Latvijas Banka Monthly Newsletter 8/2016
Latvijas Banka Monthly Newsletter 8/2016Latvijas Banka
 
Ulster Bank NI PMI Slidepack April 2020
Ulster Bank NI PMI Slidepack April 2020Ulster Bank NI PMI Slidepack April 2020
Ulster Bank NI PMI Slidepack April 2020Richard Ramsey
 
Ulster Bank NI PMI slidepack May 2020
Ulster Bank NI PMI slidepack May 2020Ulster Bank NI PMI slidepack May 2020
Ulster Bank NI PMI slidepack May 2020Richard Ramsey
 
January 2020 PMI Chart Pack
January 2020 PMI Chart PackJanuary 2020 PMI Chart Pack
January 2020 PMI Chart PackRichard Ramsey
 
October 2020 Northern Ireland PMI Slide Pack
October 2020 Northern Ireland PMI Slide PackOctober 2020 Northern Ireland PMI Slide Pack
October 2020 Northern Ireland PMI Slide PackRichard Ramsey
 
Ulster Bank Northern Ireland April 2019 PMI
Ulster Bank Northern Ireland April 2019 PMI Ulster Bank Northern Ireland April 2019 PMI
Ulster Bank Northern Ireland April 2019 PMI Richard Ramsey
 
Ulster Bank Northern Ireland PMI March 2021 PMI Slide Pack
Ulster Bank Northern Ireland PMI March 2021 PMI Slide PackUlster Bank Northern Ireland PMI March 2021 PMI Slide Pack
Ulster Bank Northern Ireland PMI March 2021 PMI Slide PackRichard Ramsey
 

What's hot (20)

Trade Shocks, Taxes, and Inequality
Trade Shocks, Taxes, and InequalityTrade Shocks, Taxes, and Inequality
Trade Shocks, Taxes, and Inequality
 
Ulster Bank NI June 2019 PMI Slide pack
Ulster Bank NI June 2019 PMI Slide packUlster Bank NI June 2019 PMI Slide pack
Ulster Bank NI June 2019 PMI Slide pack
 
74d60d15 dc42-48a3-8dc8-7a2297f0be22
74d60d15 dc42-48a3-8dc8-7a2297f0be2274d60d15 dc42-48a3-8dc8-7a2297f0be22
74d60d15 dc42-48a3-8dc8-7a2297f0be22
 
Exploring Russia's Potential in its Non-resource Non-energy Exports to China ...
Exploring Russia's Potential in its Non-resource Non-energy Exports to China ...Exploring Russia's Potential in its Non-resource Non-energy Exports to China ...
Exploring Russia's Potential in its Non-resource Non-energy Exports to China ...
 
Ulster Bank Northern Ireland PMI January 2019 Slide Pack
Ulster Bank Northern Ireland PMI January 2019 Slide PackUlster Bank Northern Ireland PMI January 2019 Slide Pack
Ulster Bank Northern Ireland PMI January 2019 Slide Pack
 
Ulster Bank NI PMI March 2020
Ulster Bank NI PMI March 2020Ulster Bank NI PMI March 2020
Ulster Bank NI PMI March 2020
 
Industrial Market Report 2019
Industrial Market Report 2019Industrial Market Report 2019
Industrial Market Report 2019
 
Economic climate for manufacturing 01 10
Economic climate for manufacturing 01 10Economic climate for manufacturing 01 10
Economic climate for manufacturing 01 10
 
Ulster Bank Northern Ireland PMI February 2021 Slide Pack
Ulster Bank Northern Ireland PMI February 2021 Slide PackUlster Bank Northern Ireland PMI February 2021 Slide Pack
Ulster Bank Northern Ireland PMI February 2021 Slide Pack
 
Market Concentration – US DOJ – June 2018 OECD discussion
Market Concentration – US DOJ – June 2018 OECD discussionMarket Concentration – US DOJ – June 2018 OECD discussion
Market Concentration – US DOJ – June 2018 OECD discussion
 
Latvijas Banka Monthly Newsletter 4/2018
Latvijas Banka Monthly Newsletter 4/2018Latvijas Banka Monthly Newsletter 4/2018
Latvijas Banka Monthly Newsletter 4/2018
 
Latvijas Banka Monthly Newsletter 8/2016
Latvijas Banka Monthly Newsletter 8/2016Latvijas Banka Monthly Newsletter 8/2016
Latvijas Banka Monthly Newsletter 8/2016
 
Ulster Bank NI PMI Slidepack April 2020
Ulster Bank NI PMI Slidepack April 2020Ulster Bank NI PMI Slidepack April 2020
Ulster Bank NI PMI Slidepack April 2020
 
Ulster Bank NI PMI slidepack May 2020
Ulster Bank NI PMI slidepack May 2020Ulster Bank NI PMI slidepack May 2020
Ulster Bank NI PMI slidepack May 2020
 
January 2020 PMI Chart Pack
January 2020 PMI Chart PackJanuary 2020 PMI Chart Pack
January 2020 PMI Chart Pack
 
October 2020 Northern Ireland PMI Slide Pack
October 2020 Northern Ireland PMI Slide PackOctober 2020 Northern Ireland PMI Slide Pack
October 2020 Northern Ireland PMI Slide Pack
 
Ulster Bank Northern Ireland April 2019 PMI
Ulster Bank Northern Ireland April 2019 PMI Ulster Bank Northern Ireland April 2019 PMI
Ulster Bank Northern Ireland April 2019 PMI
 
Market report q4 2021
Market report q4 2021Market report q4 2021
Market report q4 2021
 
Ulster Bank Northern Ireland PMI March 2021 PMI Slide Pack
Ulster Bank Northern Ireland PMI March 2021 PMI Slide PackUlster Bank Northern Ireland PMI March 2021 PMI Slide Pack
Ulster Bank Northern Ireland PMI March 2021 PMI Slide Pack
 
Kazakhstan industrialization roadmap 2015 - 2019
Kazakhstan industrialization roadmap 2015 - 2019Kazakhstan industrialization roadmap 2015 - 2019
Kazakhstan industrialization roadmap 2015 - 2019
 

Viewers also liked

Story and Narrative Development in Video Games MOOC course presentation
Story and Narrative Development in Video Games MOOC course presentationStory and Narrative Development in Video Games MOOC course presentation
Story and Narrative Development in Video Games MOOC course presentationANNA MISKO
 
Imperio romano
Imperio romanoImperio romano
Imperio romanosfvgur
 
Photography in NUI Galway: NUI Galway Through a Different Lens
Photography in NUI Galway: NUI Galway Through a Different LensPhotography in NUI Galway: NUI Galway Through a Different Lens
Photography in NUI Galway: NUI Galway Through a Different LensNUI Galway Students' Union
 
Top nursing colleges in india
Top nursing colleges in indiaTop nursing colleges in india
Top nursing colleges in indiahcsnursing
 
Jhoan y fernando
Jhoan y fernandoJhoan y fernando
Jhoan y fernandosfvgur
 
Frankismoren diktadura euskal herrian
Frankismoren diktadura euskal herrianFrankismoren diktadura euskal herrian
Frankismoren diktadura euskal herrianMiryaam_
 
The Determinants of Foreign Direct Investment: A study based on country-level...
The Determinants of Foreign Direct Investment: A study based on country-level...The Determinants of Foreign Direct Investment: A study based on country-level...
The Determinants of Foreign Direct Investment: A study based on country-level...Yi Zhang
 

Viewers also liked (12)

Story and Narrative Development in Video Games MOOC course presentation
Story and Narrative Development in Video Games MOOC course presentationStory and Narrative Development in Video Games MOOC course presentation
Story and Narrative Development in Video Games MOOC course presentation
 
Informatica
InformaticaInformatica
Informatica
 
Econ-Grow
Econ-GrowEcon-Grow
Econ-Grow
 
Int-Econ
Int-EconInt-Econ
Int-Econ
 
Nicoleen van der Nest CV
Nicoleen van der Nest CVNicoleen van der Nest CV
Nicoleen van der Nest CV
 
Imperio romano
Imperio romanoImperio romano
Imperio romano
 
Photography in NUI Galway: NUI Galway Through a Different Lens
Photography in NUI Galway: NUI Galway Through a Different LensPhotography in NUI Galway: NUI Galway Through a Different Lens
Photography in NUI Galway: NUI Galway Through a Different Lens
 
Top nursing colleges in india
Top nursing colleges in indiaTop nursing colleges in india
Top nursing colleges in india
 
Jhoan y fernando
Jhoan y fernandoJhoan y fernando
Jhoan y fernando
 
FeatureOwner
FeatureOwnerFeatureOwner
FeatureOwner
 
Frankismoren diktadura euskal herrian
Frankismoren diktadura euskal herrianFrankismoren diktadura euskal herrian
Frankismoren diktadura euskal herrian
 
The Determinants of Foreign Direct Investment: A study based on country-level...
The Determinants of Foreign Direct Investment: A study based on country-level...The Determinants of Foreign Direct Investment: A study based on country-level...
The Determinants of Foreign Direct Investment: A study based on country-level...
 

Similar to Thesis (Zhang Yi)

Strategizing the Covid-19 response for a country (Biswadeep Ghosh Hazra) - {N...
Strategizing the Covid-19 response for a country (Biswadeep Ghosh Hazra) - {N...Strategizing the Covid-19 response for a country (Biswadeep Ghosh Hazra) - {N...
Strategizing the Covid-19 response for a country (Biswadeep Ghosh Hazra) - {N...Biswadeep Ghosh Hazra
 
UK-comp-tracker-August-2013-F-3
UK-comp-tracker-August-2013-F-3UK-comp-tracker-August-2013-F-3
UK-comp-tracker-August-2013-F-3Angus Rea
 
Effects of COVID-19 Epidemic on China's Service Trade and Counter measures
Effects of COVID-19 Epidemic on China's Service Trade and Counter measuresEffects of COVID-19 Epidemic on China's Service Trade and Counter measures
Effects of COVID-19 Epidemic on China's Service Trade and Counter measuresIJAEMSJORNAL
 
Exporting out of Agriculture: The Impact of WTO Accession on Structural Trans...
Exporting out of Agriculture: The Impact of WTO Accession on Structural Trans...Exporting out of Agriculture: The Impact of WTO Accession on Structural Trans...
Exporting out of Agriculture: The Impact of WTO Accession on Structural Trans...Stockholm Institute of Transition Economics
 
Slowbalisation: Globalisation in Transition
Slowbalisation: Globalisation in TransitionSlowbalisation: Globalisation in Transition
Slowbalisation: Globalisation in TransitionKaran Kaushal
 
PwC Global Economy Watch (sept. 2013)
PwC Global Economy Watch (sept. 2013)PwC Global Economy Watch (sept. 2013)
PwC Global Economy Watch (sept. 2013)PwC France
 
The Effects of China's membership in WTO on Hong Kong Economy
The Effects of China's membership  in WTO on Hong Kong EconomyThe Effects of China's membership  in WTO on Hong Kong Economy
The Effects of China's membership in WTO on Hong Kong EconomyNAMI TAHERI
 
AMRO(ASEAN+3 MACROECONOMIC RESEARCH OFFICE) AND MYANMAR
AMRO(ASEAN+3 MACROECONOMIC RESEARCH OFFICE) AND MYANMARAMRO(ASEAN+3 MACROECONOMIC RESEARCH OFFICE) AND MYANMAR
AMRO(ASEAN+3 MACROECONOMIC RESEARCH OFFICE) AND MYANMARMYO AUNG Myanmar
 
Critical Analysis on Export of Services By Category (Pakistan)
Critical Analysis on Export of Services By Category (Pakistan)Critical Analysis on Export of Services By Category (Pakistan)
Critical Analysis on Export of Services By Category (Pakistan)Qasim Raza
 
Cardiac arrest or dizzy spell why is world trade so weak what can policy do a...
Cardiac arrest or dizzy spell why is world trade so weak what can policy do a...Cardiac arrest or dizzy spell why is world trade so weak what can policy do a...
Cardiac arrest or dizzy spell why is world trade so weak what can policy do a...OECD, Economics Department
 
PwC Global Economy watch (mars 2014)
PwC Global Economy watch (mars 2014)PwC Global Economy watch (mars 2014)
PwC Global Economy watch (mars 2014)PwC France
 

Similar to Thesis (Zhang Yi) (20)

Strategizing the Covid-19 response for a country (Biswadeep Ghosh Hazra) - {N...
Strategizing the Covid-19 response for a country (Biswadeep Ghosh Hazra) - {N...Strategizing the Covid-19 response for a country (Biswadeep Ghosh Hazra) - {N...
Strategizing the Covid-19 response for a country (Biswadeep Ghosh Hazra) - {N...
 
IB.docx
IB.docxIB.docx
IB.docx
 
Block 1 ms-65 unit-3
Block 1 ms-65 unit-3Block 1 ms-65 unit-3
Block 1 ms-65 unit-3
 
UK-comp-tracker-August-2013-F-3
UK-comp-tracker-August-2013-F-3UK-comp-tracker-August-2013-F-3
UK-comp-tracker-August-2013-F-3
 
Effects of COVID-19 Epidemic on China's Service Trade and Counter measures
Effects of COVID-19 Epidemic on China's Service Trade and Counter measuresEffects of COVID-19 Epidemic on China's Service Trade and Counter measures
Effects of COVID-19 Epidemic on China's Service Trade and Counter measures
 
Exporting out of Agriculture: The Impact of WTO Accession on Structural Trans...
Exporting out of Agriculture: The Impact of WTO Accession on Structural Trans...Exporting out of Agriculture: The Impact of WTO Accession on Structural Trans...
Exporting out of Agriculture: The Impact of WTO Accession on Structural Trans...
 
Future of-world-trade
Future of-world-tradeFuture of-world-trade
Future of-world-trade
 
Slowbalisation: Globalisation in Transition
Slowbalisation: Globalisation in TransitionSlowbalisation: Globalisation in Transition
Slowbalisation: Globalisation in Transition
 
DMCC Future of Trade
DMCC Future of TradeDMCC Future of Trade
DMCC Future of Trade
 
PwC Global Economy Watch (sept. 2013)
PwC Global Economy Watch (sept. 2013)PwC Global Economy Watch (sept. 2013)
PwC Global Economy Watch (sept. 2013)
 
Did China benefit from ACFTA
Did China benefit from ACFTADid China benefit from ACFTA
Did China benefit from ACFTA
 
Economic Review 2015-11
Economic Review 2015-11Economic Review 2015-11
Economic Review 2015-11
 
The Effects of China's membership in WTO on Hong Kong Economy
The Effects of China's membership  in WTO on Hong Kong EconomyThe Effects of China's membership  in WTO on Hong Kong Economy
The Effects of China's membership in WTO on Hong Kong Economy
 
AMRO(ASEAN+3 MACROECONOMIC RESEARCH OFFICE) AND MYANMAR
AMRO(ASEAN+3 MACROECONOMIC RESEARCH OFFICE) AND MYANMARAMRO(ASEAN+3 MACROECONOMIC RESEARCH OFFICE) AND MYANMAR
AMRO(ASEAN+3 MACROECONOMIC RESEARCH OFFICE) AND MYANMAR
 
The Impact of Producer Services Agglomeration on Total Factor Productivity ——...
The Impact of Producer Services Agglomeration on Total Factor Productivity ——...The Impact of Producer Services Agglomeration on Total Factor Productivity ——...
The Impact of Producer Services Agglomeration on Total Factor Productivity ——...
 
Critical Analysis on Export of Services By Category (Pakistan)
Critical Analysis on Export of Services By Category (Pakistan)Critical Analysis on Export of Services By Category (Pakistan)
Critical Analysis on Export of Services By Category (Pakistan)
 
Vertical and Horizontal Patterns of Intra-Industry Trade between Mexico and C...
Vertical and Horizontal Patterns of Intra-Industry Trade between Mexico and C...Vertical and Horizontal Patterns of Intra-Industry Trade between Mexico and C...
Vertical and Horizontal Patterns of Intra-Industry Trade between Mexico and C...
 
ecp485_en
ecp485_enecp485_en
ecp485_en
 
Cardiac arrest or dizzy spell why is world trade so weak what can policy do a...
Cardiac arrest or dizzy spell why is world trade so weak what can policy do a...Cardiac arrest or dizzy spell why is world trade so weak what can policy do a...
Cardiac arrest or dizzy spell why is world trade so weak what can policy do a...
 
PwC Global Economy watch (mars 2014)
PwC Global Economy watch (mars 2014)PwC Global Economy watch (mars 2014)
PwC Global Economy watch (mars 2014)
 

Thesis (Zhang Yi)

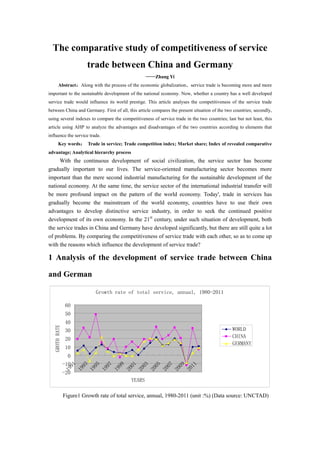
  • 1. The comparative study of competitiveness of service trade between China and Germany ————————Zhang Yi Abstract::::Along with the process of the economic globalization,service trade is becoming more and more important to the sustainable development of the national economy. Now, whether a country has a well developed service trade would influence its world prestige. This article analyses the competitiveness of the service trade between China and Germany. First of all, this article compares the present situation of the two countries; secondly, using several indexes to compare the competitiveness of service trade in the two countries; last but not least, this article using AHP to analyze the advantages and disadvantages of the two countries according to elements that influence the service trade. Key words:::: Trade in service; Trade competition index; Market share; Index of revealed comparative advantage; Analytical hierarchy process With the continuous development of social civilization, the service sector has become gradually important to our lives. The service-oriented manufacturing sector becomes more important than the mere second industrial manufacturing for the sustainable development of the national economy. At the same time, the service sector of the international industrial transfer will be more profound impact on the pattern of the world economy. Today', trade in services has gradually become the mainstream of the world economy, countries have to use their own advantages to develop distinctive service industry, in order to seek the continued positive development of its own economy. In the 21st century, under such situation of development, both the service trades in China and Germany have developed significantly, but there are still quite a lot of problems. By comparing the competitiveness of service trade with each other, so as to come up with the reasons which influence the development of service trade? 1 Analysis of the development of service trade between China and German Growth rate of total service, annual, 1980-2011 -20 -10 0 10 20 30 40 50 60 1991 1993 1995 1997 1999 2001 2003 2005 2007 2009 2011 YEARS GROTHRATE WORLD CHINA GERMANY Figure1 Growth rate of total service, annual, 1980-2011 (unit :%) (Data source: UNCTAD)
  • 2. Comparison of service trade exports between China and Germany, 1991-2011 0 50000 100000 150000 200000 250000 300000 1990 1992 1994 1996 1998 2000 2002 2004 2006 2008 2010 YEAR EXPORTS CHINA GERMANY Figure2 Comparison of service trade exports between China and Germany, 1991-2011 (unit: Million USD) (Data source: UNCTAD) From the figure 1, we can see that since the beginning of the 21st century, service trade exports in China have developed significantly, the growth momentum is obvious as well as the growth rate is higher than the world average. However, from the figure 2, we can see that at the beginning of 21st century, when the growth rate of service trade exports in China was at the highest level, the services trade exports was only a tenth of service trade exports in Germany. Recent years, the service trade exports in China have reached half of services trade exports in Germany. The low starting point and rapid development are the characteristics of Chinese service trade. Well, twenty years later, what are the states of the two countries’ development of service trade now? 1.1 Analysis of the development of service trade in China Table1 Development of service trade between China and Germany, 2007 - 2011(unit: Billion USD,%)(C:CHINA,G:GERMANY) Total trade Service trade Service trade export The proportion of Service trade in their foreign trade The proportion of service trade exports in total trade exports The proportion of Service trade exports in global service trade exports CCCC GGGG CCCC GGGG CCCC GGGG CCCC GGGG CCCC GGGG CCCC GGGG 2007 23769 29118 2523 4820 1222 2226 10.6 16.5 9.1 14.1 3.5 6.3 2008 28145 32667 3060 5447 1471 2544 10.8 16.6 9.3 14.5 3.7 6.5 2009 24465 26122 2884 4878 1295 2316 11.7 18.6 9.7 16.6 3.7 6.6 2010 32731 28972 3645 5011 1712 2375 11.1 17.2 9.7 15.4 4.4 6.2 2011 39841 34282 4206 5484 1831 2581 10.5 15.9 8.7 14.2 4.3 6.0 Data source: UNCTAD In the first place, from table1, we can see that the rapid development of service trade in China become relatively slow due to the impact of the economic crisis in 2008. Over the past five years,
  • 3. the net growth of service trade in China import and export amounted to $ 168.3 billion, total increase is 66.7%. However, at the same time the data is still higher than the growth rate of Germany. Meanwhile, service trades in China exports accounted for the proportion of the global service trade exports rise from 3.5% rise to 4.3% in 2007-2011; gradually catch up with the service trade export in Germany share. Table2 the comparison of the scale of service trade in China, Germany and the United States, 2011(unit: Billion USD,%) CHINA GERMANY USA WORLD Total trade 3984 3428 4767 44207 Total trade world ranking 2 3 1 Service trade 420 548 1028 8257 Service trade world ranking 3 2 1 the proportion of service trade exports in total trade exports 10.5 15.9 21.5 18.6 Service trade export 183 258 599 4236 The proportion of Service trade exports in global service trade exports 4.3 6.0 14.1 Service trade export world ranking 4 3 1 Service trade import 237 290 429 4020 Data source: UNCTAD In the second place, the table2 shows that the scale of service trade in China is relatively small. Although it has already ranked third in the world, its total trade in service less than half of the US as well as less than Germany. The datum of the US is using to comparing more clearly. Meanwhile, service trade in China continued to maintain a steady development; however, the proportion of their total foreign trade did not have too much change, only about 10.5%. This data is not only lower than the United States and Germany, but also far below the world average. In addition, service trade exports accounted for the proportion of global trade export is growing and has reached 4.3%; however, it still has to be improved when compared to the United States, Germany. Again, in the 21st century, the overall service trade showed a strong momentum of development, drawn by Figures 1, 2; the characteristics of service trade in China are the higher growth rate and the huge amount of growth. However, it is undeniable that there are still some drawbacks what have been described above. At the same time, service trade in China import more than its export and the deficit situation become worse in recent years, even reach as much as $ 54.4 billion in 2011. What we discussed above generally react the deficiencies and disadvantages of service trade in China. However, in a nutshell, the imperfections of the internal structure of service trade in China, is the ultimate reason for restricting its development.
  • 4. Then, from Figure 3, we can find that the transportation industry, tourists industry as well as a large part of other services such as: communication, architecture, film and television. These traditional and elementary industries have an extremely large proportion in the structure of service trade in China, about two-thirds. However, those with higher levels of technology and capital-intensive industries, such as: insurance, financial, information, and other advanced service industries have a relatively small proportion in the entire service structure. That is why the development of service trade in China is rapid but never strong. Value of service exports by service-category from 1990 to 2011 in China 0 50000 100000 150000 200000 1990 1992 1994 1996 1998 2000 2002 2004 2006 2008 2010 YEARS EXPORTS TRANSPORT TRAVEL OTHER SERVICES Figure 3 Value of service exports by service-category from 1990 to 2011 in China. (unit: Million USD) (Data source: UNCTAD) Table3 Overview of Chinese trade in service in 2011 7298097 Services value added (%) 43.1% % of GDP 2.5% GDP (mill. current US$,) Commercial services exports % of goods and comm. services exports 8.7% 58269Employment in services (thousands) % of total employment 40.4% Inward 861498FDI in services - Stocks (mill.US$) Outward 242552 Trade - Balance of Payments (mill. US$) Value % Change Rank Commercial services imports 236531 23% 3 Transportation 80445 27% 2 Travel 72474 32% 3 Other commercial services 83612 13% 6 Commercial services exports 182433 7% 4 Transportation 35611 4% 8
  • 5. Travel 48515 6% 4 Other commercial services 98307 9% 6 Finance and insurance Value added (mill. US$) 309893 % of total value added 5.2% Production and Employment Employment (% of tot. employment) 3.5% Trade - Balance of Payments (mill. US$) Value % Change Imports 694 -50%Financial services Exports 799 -40% Imports 19769 25%Insurance services Exports 3346 94% (Data source: WTO:Service profiles 2011) In the end, the table3 using the datum in 2011 showing us the overview of service trade in China. Judging from all what has been discussed above, we may draw the conclusion that the annual growth rate of service trade in China is rapid, employment in services have also improved rapidly. However, the internal structure of service trade in China is imperfect. Although the insurance service grew rapidly in recent years, exports growth rate reached as much as 94%, financial service fell both in imports and exports. Thus the development of service trade in China is extremely unbalanced. At the same time, although Chinese commercial services imports has been improved significantly in recent year, it already ranked second or third in the world, the growth of its exports is very small. That means the status of service trade in China in the whole world is not stable at all. It depended much on other countries. 1.2 Analysis of the development of service trade in Germany First of all, we look back the table1; we can see that the German trade in service has not been improved significantly in recent years. The total trade in service only increase of $66.4 billion and the growth rate is 13.7% from 2007 to 2011. Service trade in Germany, however, accounting for the proportion of gross domestic foreign trade, accounting for the proportion of the international market, especially the service trade exports accounted for the proportion of their total export, these three data remained in a stable condition, the values were about 16.5% , 6.3%, 15.0% . Even after the world economic crisis in 2008, these data did not show a significant decline. This shows that Germany already has some sufficiently strong industries to support its trade in service. Second of all, table2 shows the comparison of the scale of trade in service among China, Germany and the US. We can see that the total service trade in Germany has ranked second in the world and the trade in service exports has also ranked second. But these datum point that trade in service in the US is much better than Germany. In especial, service trade in Germany export market share is only 6%, less than half of the market share in the US. This shows that the international status of the German trade in services has yet to be improving. Again, in the 21st century, although the growth rate of service trade in Germany is less than China, but remains slightly higher than the world average. The development situation always is stable, service trade imports more than exports in Germany recently, the deficit decreases
  • 6. gradually year after year. So the development trend is relatively optimistic. Then, the figure 4 shows the value of service exports by service-category in Germany from 1990 to 2011. We can see that the other services sector occupies a very important position in the structure of service trade in Germany. At the same time, the traditional service industries such as: transportation and travel industries have stable position in its structure. That means there are not only the traditional services industries to maintain a strong foundation, but also plenty of relatively active new services industries to strive for power of rapid growth. Value of service exports by service-category from 1990 to 2011 in Germany 0 50000 100000 150000 200000 250000 300000 1990 1992 1994 1996 1998 2000 2002 2004 2006 2008 2010 YEARS EXPORTS TRANSPORT TRAVEL OTHER SERVICES Figure 4 Value of service exports by service-category from 1990 to 2011 in Germany. (unit: Million USD) (Data source: UNCTAD) Table4 Overview of German trade in service in 2011 3570566 Services value added (%) 62.1% % of GDP 7.1% GDP (mill. current US$,) Commercial services exports % of goods and comm. services exports 14.2% 27711Employment in services (thousands) % of total employment 67.3% Inward 792646FDI in services - Stocks (mill.US$) Outward 1006903 Trade - Balance of Payments (mill. US$) Value % Change Rank Commercial services imports 289091 10% 2 Transportation 67162 7% 3 Travel 84237 8% 2 Other commercial services 137693 13% 2 Commercial services exports 253381 9% 3 Transportation 60307 5% 2
  • 7. Travel 38789 12% 6 Other commercial services 154285 9% 3 Finance and insurance Value added (mill. US$) 141168 % of total value added 4.4% Production and Employment Employment (% of tot. employment) 2.9% Trade - Balance of Payments (mill. US$) Value % Change Imports 9154 33%Financial services Exports 13633 16% Imports 4607 15%Insurance services Exports 6664 9% (Data source: WTO:Service profiles 2011) Finally, table 4 shows the service trade in Germany and industries’ development and information in 2011. We find that employment who engaged in services share a significant proportion of the total labor force, about 67.3%, higher than Chinese services industries labor ratio 40.4% at the same period. At the same time, we can also see that the three traditional services of the service structure in Germany are developing rapidly and have leading positions in the world. That undeniable ensure the stability of the development of trade in service in German as well as maintain the position of service trade in Germany in the whole world. The more important thing is that the high technology and capital intense services industries such as: financial and insurance industries have been improved recently. In addition, there are much more investment in these industries recently. So that is much more benefit to the development of service trade in Germany. 2 The selection of the evaluated function and index of service trade competitiveness between China and Germany 2.1 The selection of the evaluated index 2.1.1 Trade Competition Index Trade competition index refers to a ratio of the industry trade balance of its total, to reflect the industry's competitiveness in the international market, and that reflects whether a country is a net importer or net exporter in the industry, and the scale of its net imports or net exports. The formula is as follows: IE IE TC + − = [ ]11−∈TC . When TC=1, it indicates that the industry is completely surplus; When TC=0, it indicates that the industry equal to the average of the world; When TC=-1, it indicates that the industry is completely deficit. The larger the value of TC, the stronger competiveness does the industry have.
  • 8. TC between China and Germany from 1990 to 2011 -0.3 -0.2 -0.1 0 0.1 0.2 0.3 1990 1992 1994 1996 1998 2000 2002 2004 2006 2008 2010 YEAR TC Chinese TC German TC Figure5: Trade competitive index between China and Germany from 1990 to 2011. (Data source: UNCTAD) Figure 5 is a line graph drawn by the calculated service trade between China and Germany Competitiveness Index 1990-2011. We can find that China and German have in the state of service trade competitive disadvantage for a long time, but the disadvantage has been controlled within -0.3, it is relative small. At the same time, we also find that Chinese service trade has show a significantly higher development at the beginning of the 21st century, but still being a slow downward trend with slight concussion as a whole. However, the German service trade competitiveness bottomed out in 2000, although the rebound speed is slightly weak, but since 2009, the German service trade competitiveness index has more than China and gradually move closer to the world average. 2.1.2 Market Share Market share refers to a commodity exports accounted for the proportion of total global exports, can reflect the competitive position of such goods. The greater the value, the higher competitive strength does such goods have, and the higher status in the international market. The formula is as follows: Ewj Eij MSij = Eij indicates that the exports of a commodity in one country; Ewj indicates that the total exports of the commodity in the world. MS between China and Germany from 1990 to 2011 0.00% 1.00% 2.00% 3.00% 4.00% 5.00% 6.00% 7.00% 8.00% 1990 1992 1994 1996 1998 2000 2002 2004 2006 2008 2010 YEAR MS Chinese MS German MS
  • 9. Figure6: Market share between China and Germany from 1990 to 2011. (Data source: UNCTAD Figure 6 is a line graph drawn by the calculated service trade between China and Germany Market Share 1990-2011. This figure shows us the level of the conditions of service trade between the two countries. The international market share of service trade in Germany is significantly higher than the index of China, always about 6.3%, but it also showed the downward trend in recent years. On the other hand, On the other hand, albeit from a low, slow pace of development, but the international market share of Chinese service trade rose by nearly four percentage points in two decades and has been a very positive development prospects uncertain. 2.1.3 Index of Revealed comparative Advantage Index of Revealed comparative Advantage refers to the proportion of a commodity exports in one country divide by the whole export in the world, to reflect the advantage or disadvantage of the commodity in the world market. The formula is as follows: Ewt Ewj Eit Eij RCAij = Eij indicates that the exports of a commodity in one country; Ewj indicates that the total exports of the commodity in the world; Eit indicates the country's total foreign trade; Ewt indicates the world's total foreign trade. According to regulations, the following rules are to determine the comparative advantage of a commodity in one country. When RCA's value is less than 0.8, it indicates a weak competitive; when RCA's value in the 0.8-1.25, indicating that the competitiveness is ok; while when the value of the RCA in 1.25-2.5, it indicates a relatively strong competitive; when RCA's value is greater than 2.5, it indicates a very strong competitive. RCA between China and Germany from 1990 to 2011 0 0.1 0.2 0.3 0.4 0.5 0.6 0.7 0.8 0.9 1990 1992 1994 1996 1998 2000 2002 2004 2006 2008 2010 YEAR RCA Chinese RCA German RCA Figure7: Index of Revealed comparative Advantage between China and Germany from 1990 to 2011. (Data source: UNCTAD) Figure 7 is a line graph drawn by the calculated service trade between China and Germany Index of Revealed comparative 1990-2011. From the figure, we find that the RCA of German service trade rise slowly but still close to 0.8, it indicates that the competiveness of German service trade is fair and shows an upward trend. However, Chinese service trade comparative advantage only showing a slight rise in the early years, but now it bogged down in a worse situation. This phenomenon indicates that the competitiveness of Chinese service trade has not
  • 10. improved substantially. 2.2 The weights of the evaluation function and the dimensionless quantization of index We have used different indicators to evaluate the analysis of the development of trade in services between the two countries, however, the each direction indicators evaluation is different, and analysis of each indicator obtained different results. So we take advantage of the performance evaluation method to establish an evaluation function to determine the weight of each indicator, in order to get the accurate values which determine the level of competitiveness of service trade between China and Germany. From what have been discussed above, there are the following indicators: ①total trade in services; ② annual growth rate of service trade; ③ the proportion of service export in GDP; ④ the proportion of service labor in total labor; ⑤ the proportion of service trade exports in total trade exports; ⑥ service trade competitiveness index; ⑦ service trade international market share index; ⑧Index of Revealed comparative of service trade; ⑨ service sector FDI. Now, we use the data of 2011 for example to analysis of the competitiveness of trade in services between the two countries. Table5: Service trade indexes between China and Germany in 2011 (unit: Million USD; %) INDEXES CHINA GERMANY total trade in services 420684 548409 annual growth rate of service trade 15.4% 9.4% the proportion of service export in GDP 2.5% 7.1% the proportion of service labor in total labor 40.4% 67.3% the proportion of service trade exports in total trade exports 10.5% 15.9% service trade competitiveness index -0.12 -0.05 service trade international market share 4.3% 6.1% service trade revealed comparative index 0.46 0.75 Input 861498 792646service sector FDI output 242552 1006903 (Data source: UNCTAD, WTO, service profiles 2011) 2.2.1 Determine the weight by relative comparison method Relative comparison method [1] is an empirical scoring method; there are nine indicators, it is necessary to establish a 9 * 9 square. We use [0,1] scoring method to make pair comparison between each indicators, then add the scores of each indicators, finally use normalization to get the weights of each one. Aij is the score, i, j refer to two different indicators. When the indicator i is more important than the index j, Aij is equal to 1; when the indicator i is equally important to indicator j, Aij is equal to 0.5; when the indicator i is less important than the index j, Aij equals 0. The calculated square is as follows: Table6: Determine the weight by relative comparison method INDEXES F 1 F 2 F 3 F 4 F 5 F 6 F 7 F 8 F 9 F 1 score weig ht
  • 11. 0 F1 total trade in services 0 0 0 0 0 0 0 0 1 1 0.02 F2 annual growth rate of service trade 1 0 0 0 0 0 0 0 1 2 0.04 F3 the proportion of service export in GDP 1 1 1 0.5 0 0 0 0 1 4.5 0.1 F4 the proportion of service labor in total 1 1 0 0 0 0 0 0 1 3 0.07 F5 the proportion of service trade exports in total trade exports 1 1 0.5 1 0 0 0 0 1 4.5 0.1 F6 service trade competitiveness index 1 1 1 1 1 0 0 1 1 7 0.16 F7 service trade international market share 1 1 1 1 1 1 0 1 1 8 0.18 F8service trade revealed comparative index 1 1 1 1 1 1 1 1 1 9 0.2 F9 service sector FDI 1 1 1 1 1 0 0 0 1 6 0.13 F10dummy index 0 0 0 0 0 0 0 0 0 0 0 TOTAL 45 1 2.2.2 The dimensionless quantization by threshold method After we have identified the weights of each indicator, we also have to change the actual value of each indicator into the evaluation values in order to compare the competitiveness of service trade between the two countries. The threshold method [2] means maximum or minimum values, the bigger values, and the better competitiveness. So we should use the maximum value method. Because the units of each indicator are different, so we stipulate when the index in country A is significantly larger than country B, country A get 100 points; when the index in country B is significantly larger than country A, country A get 0 point; when the two countries have similar scores, each country get 50 points. Finally, we could determine which country’s service trade is more competitive according to the weights of each indicator as well as the points of each. The calculation process and result are in the follows:1 Table7: The dimensionless quantization by threshold method Actual value Evaluation valueINDEXES China Germany China Germany weight F1 total trade in services 420684 548409 50 50 0.02 F2 annual growth rate of service trade 15.4% 9.4% 100 0 0.04 F3 the proportion of service export in GDP 2.5% 7.1% 0 100 0.1 F4 the proportion of service labor in total 40.4% 67.3% 0 100 0.07 F5 the proportion of service trade exports in total trade exports 10.5% 15.9% 50 50 0.1 F6service trade competitiveness index -0.12 -0.05 0 100 0.16 F7service trade international market share 4.3% 6.1% 50 50 0.18 F8service trade revealed comparative index 0.46 0.75 50 50 0.2 Input 861498 792646F9service sector FDI output 242552 1006903 0 100 0.13 [1] Hao Hai, Zong Jiafeng, System analysis and evaluation methods [M], Economic Science Press, 2007(12), 76. [2] Hao Hai, Zong Jiafeng, System analysis and evaluation methods [M], Economic Science Press, 2007(12), 82.
  • 12. TTOTAL POINTS 29 71 2.3The results of the evaluation of the competitiveness of service trade between the two countries As a calculating result, we know that the competitiveness of service trade in China is significantly lower than the service trade competitiveness in Germany. Through the above analysis, we obtain that there are three major issues exist in service trade of the two countries. service trade deficit from 1990 to 2011 -70000 -60000 -50000 -40000 -30000 -20000 -10000 0 10000 1990 1992 1994 1996 1998 2000 2002 2004 2006 2008 2010 YEAR DEFICIT Chinese deficit German deficit Figure8: service trade deficit from 1990 to 2011. (unit: Million USD) (Data source: UNCTAD) First of all, the service trade competitiveness index is negative; it indicates that the two countries are net importer of service trade. The deficit is serious and the index is lower than the international average. Figure 8 shows the service trade deficit in China and Germany from 1990 to 2011. The German service trade deficit is more serious than China for a long period of time; however, it shows a slightly downward trend in recent years. At the same time, Chinese service trade deficit has increased every year in a fast growth rate, so it is less competitive than Germany. Second of all, the international market share index is relatively low.. Although Germany and China rank the third and fourth place in the world, and the international market share of each country’s service trade increased a lot, the index of each is far lower than the U.S and the U.K. German and Chinese service trade have achieved certain positions in the international market, however, this weak status are suppressed by the larger market share of the U.S and the U.K. Similarly, there still a long way to go for China to keep up with the competitiveness in German service trade. Last of all, the index of revealed comparative advantage is relatively low. The value of RCA index in both countries are under 0.8 for a long period of time. It indicates that both the two countries have quite weak competitiveness in service trade. However, the value of RCA index in Germany rises; it shows positive prospects for the development in the future, the competitiveness is improving. On the other hand, the value of RCA index falls instead of rises, service trade in China is less competitive than Germany. There are several aspects in service trade that Germany is superior to China. The proportion of service export in GDP; the proportion of service labor in total labor; the proportion of service
  • 13. trade exports in total trade exports and the service sector FDI. These aspects show the positive activities of service trade in one country. China has to adjust the structure and direction of service trade in order to make an improvement in these aspects in the future. Nevertheless, we could also see that the annual growth rate of service trade in China is significantly better than Germany. Although service trade in China has a low starting point, it also has a strong enthusiasm and momentum toward development. 3 AHP analyses of the factors which influence the competitiveness of service trade between China and Germany Through the above analysis and comparison of the various indicators of service trade between the two countries, we know that the competitiveness of German service trade is better than China. However, what causes the differences in services trade between the two countries? Now we have to analyze the factors that affect the competitiveness of service trade between the two countries, so as to arrive to the revelation to conducive the development of Chinese service trade. 3.1The rationale of AHP Analytic Hierarchy Process [3] is proposed in the late 1970s by the United States Operations Research T·L·Satty. AHP is a multi-level weights analytical method; it could combine people's subjective judgment, it is a combination of concise qualitative and quantitative analysis method. It is characterized by the in-deep analysis of the nature of complex evaluation issues, factors and their intrinsic relationship. AHP use less quantitative information to digitalize the evaluated thinking process in order to solve the multi-objective, multi-criteria or unstructured complex issues. When using AHP method, we should establish the hierarchical structure of the evaluation model first. We have to analyze scope, objective, influencing factors and relationships between various factors of the evaluation issues. The highest layer of the evaluation is the target; the middle layers are the intermediate links to achieve the overall goal; the lowest layers are the programs selected by the evaluators. The second step is to establish the scale of relative importance as well as the judgment matrix in order to comparing the impacts of various factors. 2 Finally, calculate matrixes and get the result. According to the factors which influence the competitiveness of service trade, we use AHP to evaluate the two countries again, so we can know which factor causes the differences between them. 3.2 Factors which influence the service trade Factors which influence the service trade can be dividing into two main categories. One is the factors which influence the service trade competitive assets, including ①the size of the population factor (X1) refers to the proportion of service labor in total labor; ②humanity development factor (X2) including lifetime, knowledge and income. the lifetime is represented by the life expectancy; the knowledge is represented by the adult literacy rate; the income is represented by the per capita income with the measure of purchasing power parity; ③ knowledge [3] L·T·Satty, Decision making with the analytic hierarchy process [J], Services Sciences, 2008 (Vol.1, No.1): 83-98
  • 14. resource factor (X3) refers to the proportion of expenditures on research and development in total GDP. The other is the factors which influence the service trade competitive process. ①service trade scale factor (X4) refers to service trade international market share; ②trade structure factor including the proportion of service trade export in total export (X5) and the proportion of high-tech products export in total export(X6); ③Core Competences factor (X7) refers to the ratio of “Fortune 500” companies in one country; ④trade effectiveness factor (X8) refers to the per capita GDP; ⑤potential growth in service trade factor including the service trade industry labor productivity (X9) refers to the service sector GDP divided by service industry labor force, as well as the growth rate of service trade (X10). 3.3 Recursive hierarchy structure model analysis Table8 shows the factors which influence the competitiveness of service trade. We use the datum of China, Germany and the U.S in 2011. Figure9: the AHP model to evaluate the competitiveness of service trade Table8: indicators’ value of factors influencing service trade in 2011 FACTORS INDICATORS CHINA GERMANY USA the size of the population the proportion of service labor in total labor 40.4 % 67.3% 67.7% life expectancy (unit: year) 73 80 78 adult literacy rate 94% 100% 100%humanity development per capita income with the measure of purchasing power parity 8390 40230 48820 knowledge resource the proportion of expenditures on research and development in total GDP 1.47 % 2.82% 2.79% service trade scale service trade international market share 4.3% 6.1% 14.1% trade structure the proportion of service trade export in total export 8.8% 14.3% 28.5% China Germany USA Compet itivenes s Service labor Life knowle dge income R&D expendi ture Market share Service export High-te ch export ‘Fortun e 500’ compan y Per capital GDP Labor producti vity Growth rate
  • 15. the proportion of high-tech products export in total export 28% 15% 20% Core Competences the ratio of “Fortune 500” companies in one country 14.6 % 8.2% 26.4% trade effectiveness per capita GDP(unit: dollar) 5445 44060 48112 service trade industry labor productivity(unit: dollar/labor) 7264 20101 12542potential growth in service trade growth rate of service trade 7.0% 8.7% 8.9% (Data source: UNCTAD, WTO, service profiles 2011, The World Bank) 3.3.1 The scale of relative importance We have already established the hierarchy evaluation model, figure 9. Due to the units of various factors are different, so AHP method uses the scale of relative importance [4] to change the relative importance between two factors into a measurable number. Table9: the scale of relative importance The value of Aijscale difinition Explication 1 Factor i is equal to factor j contribution to the objectives is same 3 Factor i is slightly important than factor j a slight preference for one factor 5 Factor i is important than factor j a preference for one factor 7 Factor i is more important than factor j a significant preference for one factor 9 Factor i is extremely important than factor j a extreme preference for one factor 2,4,6,8 refer to the intermediate value between the above adjacent judgment reciprocal If the ratio of the importance of the factor i and factor j is Aij,so the ratio of the importance of the factor j and factor i Aji=1/Aij. 3.3.2 Comparative judgment matrix and calculation On the basis of the relative importance of the judgment has been established. First, we have to establish a 10-order judgment matrix to compare the relative importance between the criterions, as shown in Table 10; then we have to compare the datum of these three countries in 2011 according to the ten criterions, as well as establish ten 3-order judgment matrixes, as shown in Table 12. Table10: The judgment matrix about the ten criterions X1 X2 X3 X4 X5 X6 X7 X8 X9 X10 X1 the ratio of service labor 1 4 5 1/7 1/6 4 3 2 1/5 1/3 X2lifetime,knowledge, income 1/4 1 1/2 1/8 1/7 3 1/3 1/4 1/6 1/5 X3 the ratio of R&D outlay 1/5 2 1 1/8 1/5 3 1/2 1/3 1/7 1/6 X4 service trade MS 7 8 8 1 3 7 6 5 2 4 X5 the ratio of service export 6 7 5 1/3 1 6 5 4 2 3 X6 the ratio of hi-tech export 1/4 1/3 1/3 1/7 1/6 1 1/3 1/4 1/6 1/5 X7 the ratio of ‘Fortune 500’ 1/3 3 2 1/6 1/5 3 1 1/3 1/5 1/4 X8 per capita GDP 1/2 4 3 1/5 1/4 4 3 1 1/4 1/3 X9 service labor productivity 5 6 7 1/2 1/2 6 5 4 1 1/2
  • 16. X10 growth rate of service 4 5 6 1/4 1/3 5 4 3 2 1 There is several calculation of the matrix consistency as follows: first, normalize each column of the matrix A. A=                                   123453/14/1654 2/114562/12/1765 3/14/11344/15/1342/1 4/15/13/1135/16/1233/1 5/16/14/13/116/17/13/13/14/1 3245613/1576 4256731887 6/17/13/12/135/18/1125/1 5/16/14/13/137/18/12/114/1 3/15/12346/17/1541                                 100.0246.0149.0142.0119.0056.0084.0159.0124.0163.0 050.0123.0198.0177.0143.0084.0167.0185.0149.0204.0 033.0031.0050.0106.0096.0042.0067.0080.0099.0020.0 025.0025.0017.0036.0071.0034.0056.0053.0074.0014.0 020.0020.0012.0012.0024.0028.0048.0009.0008.0010.0 301.0246.0198.0177.0143.0168.0111.0132.0174.0245.0 401.0246.0248.0213.0167.0503.0335.0211.0198.0285.0 017.0018.0017.0019.0071.0033.0042.0026.0050.0008.0 020.0020.0012.0012.0071.0024.0042.0013.0025.0010.0 033.0025.0099.0106.0095.0028.0048.0132.0099.0041.0 Then, make the summation of each row of the matrix; normalize it again to get the eigenvector.                                 = 134.0 148.0 062.0 040.0 021.0 189.0 280.0 030.0 025.0 071.0 ~w Next, using the formula: wwA ~max~ λ= . maxλ is the maximum eigenvalue of matrix A. Normalize column vector Sum the row and normalize again
  • 17. According to the Perron Theorem, a positive matrix has one positive maximum eigenvalue as well as only one specific non-negative eigenvector. Now, the eigenvector is w~ , we can get the maxλ according to the formula as follows.                                 =′ 603.1 739.1 676.0 430.0 209.0 305.2 313.3 314.0 263.0 795.0 ~wA , because wwA ~max~ λ= . The calculation process as follows.    +++++++++   = 134.0 603.1 148.0 739.1 062.0 676.0 040.0 430.0 021.0 209.0 189.0 305.2 280.0 313.3 030.0 314.0 025.0 263.0 071.0 795.0 10 1 maxλ 153.11max ≈∴λ So the eigenvector and eigenvalue of matrix A is: { }134.0148.0062.0040.0021.0189.0280.0030.0025.0071.0~ =w 153.11max =λ However, only calculate the eigenvectors and eigenvalues of the A matrix is not enough; we also have to test the uniformity of value we obtained before. Because, when A is completely uniform, we can gat the accurate ordering vector feature, namely the eigenvector. However, the actual situation is that the matrix A is difficult to be completely uniform, but it can be proved when the closer the maxλ to the order n, the closer the solution obtained to the correct w , so the judgment we made is more reliable, the judgment matrix we got is closer to completely uniformi, then the ordered eigenvectors we achieved are more correct. The uniformity index CI is generally used to check the evaluators and judge the uniformity. The formula is as follows: 1 max − − = n n CI λ At the same time, we also need to use the average random uniformity index RI [5] , which is used as a measure of order judgment matrix to judge whether the matrix has satisfactory uniformity or not. Table11: average random consistency index RI order 3 4 5 6 7 8 9 10 11 12 13 14 15 RI 0.52 0.89 1.12 1.26 1.36 1.41 1.46 1.49 1.52 1.54 1.56 1.58 1.59 When the order of judgment matrix is bigger than 2, we have to use anther index, namely the Random coincidence coefficient CR. The formula of CR is as follows:
  • 18. RI CI CR = 3 When the value of CR is at about 10%, we consider that the judgment matrix has a satisfactory uniformity. In this case, 128.0 110 10153.11 1 max ≈ − − = − − = n n CI λ According to the table 11, 49.1=RIΘ 086.0 49.1 128.0 ≈==∴ RI CI CR As a result, the value of CR is 8.6%, so we can say the judgment matrix has satisfactory uniformity. Now, we have to establish several judgment matrixes to evaluate the competitiveness of these three countries according to the ten factors. Table12: The judgment matrix about the comparison between the three countries ①the ratio of service labor CHINA GERMANY USA CHINA 1 1/5 1/5 GERMANY 5 1 1 USA 5 1 1 ordering vector( w~ ) 0.10 0.45 0.45    ≈   ++           =      =′      =           =′ 007.3 45.0 40.1 45.0 40.1 10.0 28.0 3 1 max, 40.1 40.1 28.0 ~; 45.0 45.0 10.0 ~; 45.045.045.0 45.045.045.0 10.010.010.0 λwAwA 0067.0 52.0 0035.0 ,52.0;0035.0 13 3007.3 1 max ≈==∴== − − = − − = RI CI CRRI n n CI Θ λ ②humanity development CHINA GERMANY USA CHINA 1 1/8 1/9 GERMANY 8 1 1/2 USA 9 2 1 ordering vector( w~ ) 0.06 0.36 0.58    ≈   ++           =      =′      =           =′ 048.3 58.0 84.1 36.0 13.1 06.0 17.0 3 1 max, 84.1 13.1 17.0 ~; 58.0 36.0 06.0 ~; 62.064.050.0 31.032.044.0 07.004.006.0 λwAwA 046.0 52.0 024.0 ,52.0;024.0 13 3048.3 1 max ≈==∴== − − = − − = RI CI CRRI n n CI Θ λ ③the ratio of R&D outlay CHINA GERMANY USA [5] Hao Hai, Zong Jiafeng, System analysis and evaluation methods [M], Economic Science Press, 2007(12), 120.
  • 19. CHINA 1 1/7 1/6 GERMANY 7 1 2 USA 6 1/2 1 ordering vector( w~ ) 0.07 0.58 0.35    ≈   ++           =      =′      =           =′ 032.3 35.0 06.1 58.0 77.1 07.0 211.0 3 1 max, 06.1 77.1 211.0 ~; 35.0 58.0 07.0 ~; 32.030.043.0 63.061.050.0 05.009.007.0 λwAwA 031.0 52.0 016.0 ,52.0;016.0 13 3032.3 1 max ≈==∴== − − = − − = RI CI CRRI n n CI Θ λ    ≈   ++           =      =′      =           =′ 217.3 75.0 62.2 19.0 60.0 06.0 18.0 3 1 max, 62.2 60.0 18.0 ~; 75.0 19.0 06.0 ~; 80.085.060.0 11.012.033.0 09.003.007.0 λwAwA 138.0 52.0 072.0 ,52.0;072.0 13 3217.3 1 max ≈==∴== − − = − − = RI CI CRRI n n CI Θ λ    ≈   ++           =      =′      =           =′ 217.3 75.0 62.2 19.0 60.0 06.0 18.0 3 1 max, 62.2 60.0 18.0 ~; 75.0 19.0 06.0 ~; 80.085.060.0 11.012.033.0 09.003.007.0 λwAwA 138.0 52.0 072.0 ,52.0;072.0 13 3217.3 1 max ≈==∴== − − = − − = RI CI CRRI n n CI Θ λ ⑥the ratio of hi-tech export CHINA GERMANY USA CHINA 1 6 4 GERMANY 1/6 1 1/3 USA 1/4 3 1 ordering vector( w~ ) 0.69 0.09 0.22 ④ service trade market share CHINA GERMANY USA CHINA 1 1/5 1/9 GERMANY 5 1 1/7 USA 9 7 1 ordering vector( w~ ) 0.06 0.19 0.75 ⑤ the ratio of service export CHINA GERMANY USA CHINA 1 1/5 1/9 GERMANY 5 1 1/7 USA 9 7 1 ordering vector( w~ ) 0.06 0.19 0.75
  • 20.    ≈   ++           =      =′      =           =′ 056.3 22.0 66.0 09.0 28.0 69.0 11.2 3 1 max, 66.0 28.0 11.2 ~; 22.0 09.0 69.0 ~; 19.030.018.0 06.010.011.0 75.060.071.0 λwAwA 054.0 52.0 028.0 ,52.0;028.0 13 3056.3 1 max ≈==∴== − − = − − = RI CI CRRI n n CI Θ λ    ≈   ++           =      =′      =           =′ 255.3 72.0 58.2 06.0 18.0 22.0 70.0 3 1 max, 58.2 18.0 70.0 ~; 72.0 06.0 22.0 ~; 78.056.083.0 09.006.003.0 13.038.014.0 λwAwA 245.0 52.0 1275.0 ,52.0;1275.0 13 3255.3 1 max ≈==∴== − − = − − = RI CI CRRI n n CI Θ λ    ≈   ++           =      =′      =           =′ 052.3 57.0 85.1 37.0 20.1 06.0 16.0 3 1 max, 85.1 20.1 16.0 ~; 57.0 37.0 06.0 ~; 62.064.047.0 31.032.047.0 07.004.006.0 λwAwA 05.0 52.0 026.0 ,52.0;026.0 13 3052.3 1 max ===∴== − − = − − = RI CI CRRI n n CI Θ λ ⑨service labor productivity CHINA GERMANY USA CHINA 1 1/9 1/5 GERMANY 9 1 6 USA 5 1/6 1 ordering vector( w~ ) 0.06 0.73 0.21    ≈   ++           =      =′      =           =′ 155.3 21.0 63.0 73.0 53.2 06.0 18.0 3 1 max, 63.0 53.2 18.0 ~; 21.0 73.0 06.0 ~; 14.013.033.0 83.078.060.0 03.009.007.0 λwAwA ⑦ the ratio of ‘Fortune 500’ CHINA GERMANY USA CHINA 1 6 1/6 GERMANY 1/6 1 1/9 USA 6 9 1 ordering vector( w~ ) 0.22 0.06 0.72 ⑧ per capita GDP CHINA GERMANY USA CHINA 1 1/9 1/9 GERMANY 9 1 1/2 USA 9 2 1 ordering vector( w~ ) 0.06 0.37 0.57
  • 21. 149.0 52.0 0775.0 ,52.0;0775.0 13 3155.3 1 max ≈==∴== − − = − − = RI CI CRRI n n CI Θ λ    ≈   ++           =      =′      =           =′ 67.2 40.0 20.1 40.0 20.1 20.0 40.0 3 1 max, 20.1 20.1 40.0 ~; 40.0 40.0 20.0 ~; 40.040.040.0 40.040.040.0 20.020.020.0 λwAwA Because 3max ≥λ ,so here we set 3max =λ 。 0;0 13 33 1 max ==∴= − − = − − = RI CI CR n n CI λ From what have been calculated above, the results are as follows in table 13. We can see that most of the Random coincidence coefficient CR values are in the range of 10%, this shows that they have more satisfactory uniformity. Because there are so many matrixes we calculated here, nonuniformity is inevitable. We could allow the value of CR bigger than 10%, but within 20%. Table13: the calculated result of the second and third layers Second w~ T 0.071 0.025 0.030 0.280 0.189 0.021 0.040 0.062 0.148 0.134 0.10 0.06 0.07 0.06 0.06 0.69 0.22 0.06 0.06 0.20 0.45 0.36 0.58 0.19 0.19 0.09 0.06 0.37 0.73 0.40 Third w~ k 0.45 0.58 0.35 0.75 0.75 0.22 0.72 0.57 0.21 0.40 maxλ k 3.007 3.048 3.032 3.217 3.217 3.056 3.255 3.052 3.155 3.000 CI k 0.004 0.024 0.016 0.072 0.072 0.028 0.1275 0.026 0.078 0.000 CR k 0.67% 4.6% 3.1% 13.8% 13.8% 5.4% 24.5% 5.0% 14.9% 0% RI(n=3)=0.52 3.3.2 Comparative judgment and calculation Table10 shows the comparative judgment matrix about the ten criteria in the second layer. Table 12 shows the mutual comparative judgment matrix among the three countries in the third layer. Then table 14 would show the final ordering vector for the competitiveness of each country according to the total ordering principle. Table14: The total ordering of the competitiveness in each country Total Order Factors and criterio n the ratio of servic e labor hum anity deve lopm ent the ratio of R&D outla y servi ce trade mark et share the ratio of servi ce EX the ratio of hi-te ch EX the ratio of ‘Fort une 500’ per capit a GDP servi ce labor prod uctiv ity grow th rate of servi ce ⑩ growth rate of service CHINA GERMANY USA CHINA 1 1/2 1/2 GERMANY 2 1 1 USA 2 1 1 ordering vector( w~ ) 0.20 0.40 0.40
  • 22. 0.071 0.025 0.030 0.280 0.189 0.021 0.040 0.062 0.148 0.134 China 0.10153 0.10 0.06 0.07 0.06 0.06 0.69 0.22 0.06 0.06 0.20 Germany 0.33633 0.45 0.36 0.58 0.19 0.19 0.09 0.06 0.37 0.73 0.40 USA 0.56214 0.45 0.58 0.35 0.75 0.75 0.22 0.72 0.57 0.21 0.40 Now we can use the synthetic formula to synthesis the ordering vector of three countries. China: 10153.0134.02.0148.006.0062.006.004.022.0021.069.0 189.006.028.006.003.007.0025.006.0071.01.0 =×+×+×+×+× +×+×+×+×+× Germany 33633.0134.04.0148.073.0062.037.004.006.0021.009.0 189.019.028.019.003.058.0025.036.0071.045.0 =×+×+×+×+× +×+×+×+×+× USA: 56214.0134.04.0148.021.0062.057.004.072.0021.022.0 189.075.028.075.003.035.0025.058.0071.045.0 =×+×+×+×+× +×+×+×+×+× The synthetic ordering vector is as follows: )( )( TT wwww 562.0336.0102.0321~ == 4 Comprehensive comparisons of the reasons which influence the competitiveness of service trade between China and Germany Now we have got the ordering vector of the competitiveness of service trade among the three countries. )( )( TT wwww 562.0336.0102.0321~ == Obviously, there exists a huge competitiveness gap between China, Germany with the U.S. That means there are certain problems in the development of service trade in the two countries. In addition, as I have mentioned in the chapter 2, the competitiveness of service trade in Germany is significantly better than China. 4.1 Germany As I have discussed in the chapter 2, we know that there are lots of advantages in the development of service trade in Germany. For instance: the strong infrastructure, the stable traditional service industry, mighty new high-tech service industry as well as the rich service labor resources and powerful labor productivity. So, Germany plays an important role in the international service market. The development of service trade in Germany superior to China in many ways, such as: the abundant service labor resources, the harmonious humility situation, higher per capita GDP and relatively high service industry productivity. However, there also are some disadvantages. For example: the service trade international market share and the proportion of service trade export. There is still a lot of hard work to do for Germany so as to bridge the gap to the U.S. in addition, the annual growth rate of service is even inferior to China. All the evidences show that there are some strong resistances restrict the development of service trade in Germany. So the growth rate is slightly weaker.
  • 23. However, there are still some disadvantages in the development in Germany. Firstly, Germany is a central European country. Comparing with the U.S and China, it has the shortcoming in the following aspects, such as: the population, the land area, resources. Therefore, these aspects become one of the major drawbacks in the development of service trade. Secondly, after joining the European Union, Germany abandons the strong currency Mark. Undoubtedly, it would influence the financial service. Additionally, there are the preferential rights among the countries in the EU. So, the revenue of service trade in Germany decreases the motive force of development decrease. Thirdly, the world has not revived from the crisis yet. The European debt crisis happened in recent years make the economic situation even more weak. As this point, Germany not only has to protect its domestic economy, but also has to help and support Greek and Italy. Undoubtedly, these kind of worse situations become one of the major reasons to restrict the rapid development of service trade in Germany. 4.2 China From what I have discussed above, the ordering vector shows that the development of service trade in China is not optimistic. There is a little advantage in few aspects, such as: the proportion of high-tech products export in total trade export and the proportion of “Fortune 500” companies of China. The high proportion of high-tech products export indicates that China has the powerful potential of high-tech R&D. China should take advantage of this power into the development of service trade. As far as I am concerned, there are several disadvantages in the development of service trade in China. Firstly, for example: the weak humility development, the low per capita GDP, the low ratio of service labor and the lower labor productivity. That indicates that there is not a stable foundation of the service trade development in China. A weak foundation is harmful to the development of service trade in the future. Secondly, the lower proportion of R&D expenditures indicates that the structure of service trade in China is unreasonable. The huge proportion of traditional service is not only costly but also earn a little. From figure 10 and figure 11, we can find that the development of creative service in China increase very slowly, the amount is also much lower then that in Germany. Thirdly, the lower international market share of service trade in China and the low proportion of service export in total trade export indicates that China as a traditional trade country is still stuck in the model of single commodity trade.
  • 24. Import in creative service, 2000-2010 0 5000 10000 15000 20000 25000 2000 2001 2002 2003 2004 2005 2006 2007 2008 2009 2010 YEAR IMPORTS Germany-research and deveopment Germany- personal,cultural,recreat ionl service Germany- advertising,market researc China-research and deveopment China- personal,cultural,recreat ionl service China-advertising,market research Figure10: Import in creative service, 2000-2010 (unit: Million USD) (Data source: UNCTAD) Export in creative service, 2000-2010 0 5000 10000 15000 20000 25000 2000 2001 2002 2003 2004 2005 2006 2007 2008 2009 2010 YEAR EXPORTS Germany-reasearch and development Germany- persnal,cultural,recreati onal service Germany- advertising,market research China-reasearch and development China- persnal,cultural,recreati onal service China-advertising,market research Figure11: Export in creative service, 2000-2010 (unit: Million USD) (Data source: UNCTAD) As we all know, China has a large and cheap labor resources, so it has the advantage to develop the labor-intensive trade. However, the developments of countries in South America or East South Asia are gradually shake the status of China as the world factory with plenty cheap labor. In addition, Labor is the basis for the rapid development of China's economy, but also a resistance to restricting the development of high-tech capital-intensive economy in China. Huge population resulted in a series of social problems: the gap between the rich and the poor, the geographical gap, these disharmonious factors seriously affect the development of service trade in China. At the same time, the traditional concept of the majority of the people, value product than service labor. So labor involved in the services sector is relatively little, it has also become another reason for restricting the development of service trade in China.