
Recommended
More Related Content
Similar to H1Delhi3.pdf
Similar to H1Delhi3.pdf (20)
Recently uploaded
Recently uploaded (20)
H1Delhi3.pdf
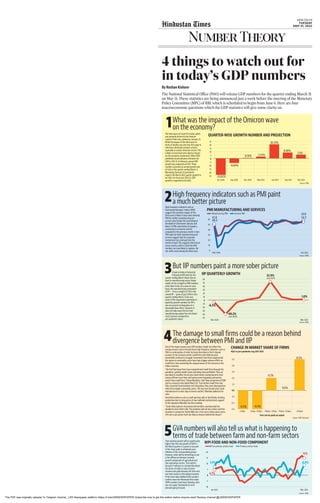
- 1. The third wave of Covid-19 in India, which was primarily driven by the Omicron variant of the virus, peaked on January 25. While the impact of the third wave in terms of deaths was very low, the surge in infections did derail economic activity, especially in contact intensive sectors. This is likely to have had some adverse impact on the economic momentum. When NSO published second advance estimates for GDP in 2021-22 in February, annual GDP growth was projected at 8.9%. These numbers assumed an annual growth rate of 4.8% in the quarter ending March. A Bloomberg forecast of economists expects the March 2022 quarter growth to be 3.8%. For fiscal year 2021-22, GDP growth is expected to be 8.8%. 1What was the impact of the Omicron wave on the economy? QUARTER-WISE GROWTH NUMBER AND PROJECTION High frequency indicators such as Purchasing Managers’ Indices (PMI) suggest the economic impact of the third wave is likely to have been minimal. PMI for neither manufacturing nor services went below the psychological threshold of 50 between January and March. A PMI value below 50 signals a contraction in economic activity compared to the previous month. In fact, PMI value for both manufacturing and services suggest that the economic momentum has continued into the month of April. This suggests that formal sector activity, which is what the PMI numbers are more likely to capture, did not suffer much during the third wave. 2High frequency indicators such as PMI paint a much better picture PMI MANUFACTURING AND SERVICES A look at Index of Industrial Production (IIP) data for the quarter ending March shows that at least in manufacturing sector, things might not be as bright as PMI numbers show them to be. On a year-on-year basis, the manufacturing component of IIP — it has a weight of 77% in the overall IIP — grew at just 0.95% in the quarter ending March. To be sure, some of the sequential moderation in quarterly growth numbers for IIP is also on account of dissipation of a favourable base effect. However, it does not take away the fact that manufacturing output has not shown much recovery compared to pre-pandemic values. 3But IIP numbers paint a more sober picture IIP QUARTERLY GROWTH That nominal growth will be significantly higher than the real growth of GDP in the March quarter is a given on account of the sharp spike in wholesale price inflation in the corresponding period. However, what will be interesting to see is the difference between nominal growth component of agriculture and non-agriculture sectors. This matters because it will give us a broad idea about the terms of trade or ratio of prices received and paid between the farm and non-farm sectors in the Indian economy. If the Gross Value Added (GVA) numbers confirm what the Wholesale Price Index (WPI) numbers have been showing, then one can expect headwinds to rural demand going forward. 5GVA numbers will also tell us what is happening to terms of trade between farm and non-farm sectors WPI FOOD AND NON-FOOD COMPONENT One of the major reasons why GDP numbers might not reflect the strong recovery seen in formal sector high frequency indicators such as PMI is a continuation of what has been described as the K-shaped recovery in the economy where small firms and relatively poor households continue to struggle. Economists have been arguing that the upturn in commodity prices have had a bigger adverse effect on small firms, thus worsening the unequal nature of the recovery in the Indian economy. “We find that large firms have outperformed small firms through the pandemic, gaining market share and being more profitable. They are also likely to weather the oil price shock better, having become more energy efficient over time and having more bargaining and pricing power than small firms,” Pranjul Bhandari, chief India economist at HSBC said in a research note dated March 28. “Even before small firms had fully recovered from lockdown-led-disruption, they were disproportion- ately hit by higher commodity prices. This has even forced some small manufacturers to shut shop in recent months,” Bhandari added in her note. Anecdotal evidence such as small spinning mills in Tamil Nadu shutting production due to rising prices of raw materials (cotton) lends support to the argument Bhandari has been making. “South India Spinners Association (all members unanimously) has decided to close 100% mills. The members will not buy cotton until the situation is conductive Textile Mills cite a 53% rise in cotton prices and a 21% rise in yarn prices from Jan-May as reasons behind the closure.” 4The damage to small firms could be a reason behind divergence between PMI and IIP CHANGE IN MARKET SHARE OF FIRMS Sep 2020 Mar 2021 Sep 2021 Dec 2021 Jun 2020 Mar 2020 Mar 2020 Jun 2012 Mar 2022 Firm size by paid up capital 4Q21 vs pre-pandemic avg 2017-2019 Mar 2022 Apr 2022 Source: CMIE Source: CMIE Source: CMIE Source: CMIE Source: HSBC Research Dec 2020 Jun 2021 50m- 100m 150m- 250m 50m 100m- 150m 250m -25 -20 -15 -10 -5 0 5 10 15 20 25 -6.64% 8.48% 5.4% -23.82% 20.33% 2.53% 0.74% 0 10 20 30 40 50 60 Services PMI Manufacturing PMI 51.8 49.3 4.7% 54.7 57.9 -50 -40 -30 -20 -10 0 10 20 30 40 50 60 -6.3% 1.0% -0.3 -0.2 -0.1 0.0 0.1 0.2 0.3 0.4 0.5 -0.3% 0.0% 0.2% -0.3% 0.5% Primary articles food WPI ex-primary articles food -10 -5 0 5 10 15 20 7.4% 8.9% 15% (Jun 2020) -40.2% (Jun 2021) 52.9% 4 things to watch out for in today’s GDP numbers By Roshan Kishore The National Statistical Office (NSO) will release GDP numbers for the quarter ending March 31 on May 31. These statistics are being announced just a week before the meeting of the Monetary Policy Committee (MPC) of RBI, which is scheduled to begin from June 6. Here are four macroeconomic questions which the GDP statistics will give some clarity on. NEW DELHI TUESDAY MAY 31, 2022 NumberTheory This PDF was originally uploade To Teligram channel_ LBS Newspaper platform (https://t.me/LBSNEWSPAPER) Subscribe now to get this edition before anyone else!! Backup channel:@LBSNEWSPAPER