More Related Content
Similar to Chapter 03 (20)
Chapter 03
- 1. Agenda – Day 1
• Network Planning in 3G
• WCDMA Air-Interface
• Power Budget Calculation
• Load Calculation
• Radio Network Dimensioning
• Capacity & Coverage Improvement
• Planning Support for 3G Roll-Out
39 © NOKIA FILENAMs.PPT/ DATE / NN
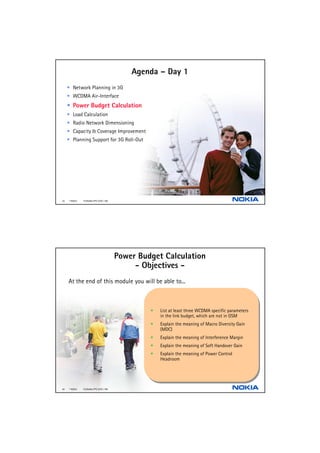
Power Budget Calculation
- Objectives -
At the end of this module you will be able to...
•• List at least three WCDMA specific parameters
List at least three WCDMA specific parameters
in the link budget, which are not in GSM
in the link budget, which are not in GSM
•• Explain the meaning of Macro Diversity Gain
Explain the meaning of Macro Diversity Gain
(MDC)
(MDC)
•• Explain the meaning of Interference Margin
Explain the meaning of Interference Margin
•• Explain the meaning of Soft Handover Gain
Explain the meaning of Soft Handover Gain
•• Explain the meaning of Power Control
Explain the meaning of Power Control
Headroom
Headroom
40 © NOKIA FILENAMs.PPT/ DATE / NN
- 2. Power Budget Calculation
Introduction
• Power Budget is needed for path loss & cell range calculations
• There are a few WCDMA-specific parameters in the power budget
compared with GSM:
• Processing gain
• Load margin (interference)
• Power control headroom
• Soft handover gain
• Limiting factors in the calculation
• Mobile station transmit power in UL.
• Total base station transmit power in DL.
• When balancing the uplink and downlink service areas both links must
be considered
41 © NOKIA FILENAMs.PPT/ DATE / NN
Power Budget Calculation
Overview
Result
Output Losses BS Path- Load SHO MS MS/ Ec/I0 Process- MDC Eb/N0
power (Cable, Antenna loss (Interfe- Gain anten- body ing gain gain
Combin-gain rence na loss (de-
er,…) margin) gain spreading)
Input Categories
Hardware related System related
Capacity related Application related
42 © NOKIA FILENAMs.PPT/ DATE / NN
- 3. Power Budget Calculation
Parameters
Link budget
Chip rate 3840.00 DL data rate 64.00
• Thermal Noise density [dBm/Hz] is defined as:
UL Data rate
UL Load
64.00
50%
DL load 85%
Thermal _ Noise _ Density = 10 * Log (kT )
NRT 64kbit/s, 3km/h 2
⇒ Where k is Boltzman's constant and T is the
Uplink Downlink temperature in Kelvin
⇒ In normal conditions (290 K) the thermal
RECEIVING END Node B UE
Thermal Noise Density dBm/Hz -173.98 -173.98
Receiver Noise Figure
Receiver Noise Density
dB
dBm/Hz
3.00
-170.98
8.00
-165.98 noise density is -173.98 dBm/Hz
Noise Power [NoW] dBm -105.14 -100.14
Reguired Eb/No
Soft handover MDC gain
dB
dB
2.00
0.00
5.50
1.00
• Receiver noise figure [dB]
Processing gain dB 17.78 17.78 ⇒ Equipment specific values which are
Interference margin (NR) dB 3.01 8.24
Required BTS Ec/Io [q] dB -12.77 -5.04 assumed to be 3dB at the BS and 8dB at the
Required Signal Power [S] dBm -117.91 -105.18
Cable loss dB 2.00 0.00 MS
Body loss dB 0.00 0.00
Antenna gain RX
Soft handover gain
dBi
dB
18.00
2.00
0.00
2.00
• Receiver Noise Density [dBm/Hz]
Power control headroom
Istropic power
dB
dBm
3.00
-132.91
0.00
-107.18
⇒ Receiver noise density is the sum of the
TRANSMITTING END UE Node B
thermal noise density and the receiver noise
Power per connection dBm 21.00 24.73 figure.
Cable loss dB 0.00 2.00
Body loss dB 0.00 0 ⇒ Thermal Noise density [dBm/Hz] + Receiver
noise figure [dB] = Receiver Noise Density
Antenna gain TX dBi 0.00 18
Peak EIRP dBm 21.00 40.73
Isotropic path loss
DL peak to average ratio
dB
dB
153.91 147.91
6.00 [dBm/Hz]
Isotropic path loss to the cell border 153.91
43 © NOKIA FILENAMs.PPT/ DATE / NN
Power Budget Calculation
Parameters
• In order to calculate the Noise power of the receiver (minimum baseband signal strength
at the receiver i.e. the receiver sensitivity for the non loaded network) the receiver noise
density has to be scaled to the WCDMA carrier bandwidth
⇒receiver noise power [dBm] = Receiver Noise Density [dBm/Hz] +
10log10(3.84*106) =-170.98 + 65.84 = -105.14
dBm
• Required Eb/N0 means that for some quality target (BLER) a certain average bit-energy
divided by total noise+interference spectral density (Eb/N0) is required
• the value depends on the service and the MS speed for which the link budget is to be
calculated
• Soft Handover MDC (macro diversity combining) gain, as a result of soft and softer
handover
• 40 % SHO overhead is used as average figure
• approx. 30% of MSs are connected to 2 or more BSs at the same time. Furthermore,
we can assume 20% is in 2-way SHO and 10% in 3-way SHO Consequently on
average the softhandover overhead is 0.70x1 + 0.2x2 + 0.10x3 = 1.4
44 © NOKIA FILENAMs.PPT/ DATE / NN
- 4. Power Budget Calculation
Uplink
Soft Handover MDC Gain
Soft HO
Combining Downlink
(including softer
combining gain for the
Softer HO other branch)
Combining
• In UL the MDC gain is 0 dB (on average)
• In UL the MDC gain is calculated over all the connections (the ones in SHO and the ones
not in SHO). Since there is only one transmitter in UL the MDC gain is negligible.
• soft handover combining is done at RNC level (selection combining)
• softer handover combining is done at the BTS (maximal ratio combining)
• In DL there the combining gain is about 1dB
• In DL the MDC gain calculated over all the connections (with and without SHO) is
having value of around 1dB.
• MS maximal ratio combining is used
45 © NOKIA FILENAMs.PPT/ DATE / NN
Power Budget Calculation
Soft Handover Gain
• Soft handover gain is the gain against shadow fading. This is roughly the gain of a
handover algorithm, in which the best BTS can always be chosen (based on minimal
transmit power of MS) against a hard handover algorithm based on geometrical distance.
• In reality the SHO gain is a function of required coverage probability and the standard
deviation of the signal for the environment.
• The gain is also dependent on whether the user is outdoors, where the likelihood of
multiple servers is high, or indoors where the radio channel tends to be dominated by a
much smaller number of serving cells.
• For indoors users the recommendation is to use smaller SHO gain value.
• SHO gain is measured as the gain in required Eb/No relative to that of single link and it
is averaged over all the radio links in the SHO area.
• Soft handover gain of 2 dB has been used average figure
RNC
46 © NOKIA FILENAMs.PPT/ DATE / NN
- 5. Power Budget Calculation
Parameters
• Processing gain is the gain that can be obtained from the spreading the signal (required
service bitrate) over the wide 3.84*106 Chips band. 10 ⋅ Log 3840 ⋅⋅10 = 24 .98 dB
3
10
10 3
12 .2
⇒For 12.2 kbit service the processing gain is
⇒the processing gain is calculated by using the L2 user datarate in the denominator, not
the actual radio interface rate matched symbol rate
• Interference margin is calculated from the UL/DL loading (η) values. This parameter shows
how much the Node B "sensitivity" is decreased due to the network load (subscribers in the
network) − 10 ⋅ Log 10 (1 − η ) [dB ]
⇒Interference margin =
• Required Ec/I0 is the required (in order to meet the baseband Eb/N0 criteria) RF C/I
⇒Required Ec/I0 = required Eb/N0 - softhandover MDC gain - processing gain +
interference margin
• Required Signal power is the required lowest signal strength that is needed for that
particular service and load.
⇒Required signal power = receiver noise power + required Ec/I0
47 © NOKIA FILENAMs.PPT/ DATE / NN
Power Budget Calculation
Processing Gain
because of the processing gain
Power Density
the spread signal can be
below the thermal noise level Processing Gain
Eb/No= + 4 dB
Eb/No= + 2 dB
Eb/No= + 1 dB
Required Signal Power
Noise level (ex. -105 dBm)
-9 dB NRT 384 kbps +10 dB
- 16 dB
RT 64 kbps +18 dB
- 21 dB
Voice 12.2 kbps +25 dB
48 © NOKIA FILENAMs.PPT/ DATE / NN
- 6. Power Budget Calculation
Parameters
• Power control headroom is the parameter to describe the margin against fast fading. This
parameter is needed because at the cell edge the mobile does not have enough power to
follow the fast fading dips. This is especially important for the slow moving mobiles!
MS moving towards the cell edge
25
20
B 15
d
10
0 0.5 1 1.5 2 2.5 3 3.5 4
20
10
m
B
d 0 Mobile transmission
-10
0 0.5 1 1.5 2 2.5 3 3.5 4
power starts hitting
1.5 its maximum value
1
0.5
0
Received quality
-0.5 degrades, more
0 0.5 1 1.5 2 2.5 3 3.5 4
15 frame errors
B
d
10 Eb/N0 target
5
increases fast
0 0.5 1 1.5 2 2.5 3 3.5 4
S ec onds
• Isotropic power is the minimum needed power for certain service in order to fulfill the
Eb/No requirement for that service
• Isotropic power=required signal power + cable loss + body loss - antenna gain -
soft handover gain + power control headroom
49 © NOKIA FILENAMs.PPT/ DATE / NN
Power Budget Calculation
Parameters
• Power per connection is the parameter to define the maximum TX power for the MS
and the needed power (for that service) from the Node B.
• Body loss: this parameter describes the additional loss in power budget. The loss can
is usually used for speech services where the mobile antenna is often shadowed by
the user's head. For data services the body loss can be set to 0dB due to that the
when having data service on the mobile is usually held in hand.
• Antenna gain TX (and RX): For MS having data services some gain can be used (2dBi)
??
• Peak EIRP: is the maximum transmitted power after the antenna.
• Peak EIRP = power per connection - cable losses - body loss + antenna gain
50 © NOKIA FILENAMs.PPT/ DATE / NN
- 7. Power Budget Calculation
Parameters
• Isotropic path loss: Maximum pathloss between the transmitting and receiving
antenna is calculated for UL and DL separately.
• Isotropic path loss: Peak EIRP - isotropic power
• DL peak to average ratio (IPL correction factor): this parameter describes the ratio
between the maximum pathloss and the average pathloss. Due to that the subscribers
are usually not located (all) at the cell edge but they are distributed through the
whole cell coverage area, this parameter is needed.
Worst case scenario - Reality - mobiles distributed (usually not evenly)
all the mobiles at the cell edge over the cell coverage area
51 © NOKIA FILENAMs.PPT/ DATE / NN
Power Budget Calculation
Power Budget Examples
Speech 64 kbits/s 128 kbits/s
Planner needs Uplink Downlink Uplink Downlink Uplink Downlink
to enter these RECEIVING END
Thermal Noise Density dBm/Hz
Node B UE
-173.98 -173.98
Node B
-173.98
UE
-173.98
Node B UE
-173.98 -173.98
WCDMA BTS Receiver Noise Figure dB 3.00 8.00 3.00 8.00 3.00 8.00
parameters BTS Receiver Noise Density dBm/Hz
BTS Noise Power [NoW] dBm
-170.98
-105.14
-165.98
-100.14
-170.98
-105.14
-165.98
-100.14
-170.98 -165.98
-105.14 -100.14
Reguired Eb/No dB 4.00 6.50 2.00 5.50 1.50 5.00
Soft handover MDC gain dB 0.00 1.00 0.00 1.00 0.00 1.00
Processing gain dB 24.98 24.98 17.78 17.78 14.26 14.77
Interference margin (NR) dB 3.01 6.99 3.01 6.99 3.01 6.99
Required BTS Ec/Io [q] dB -17.97 -12.49 -12.77 -6.29 -9.75 -3.78
Required Signal Power [S] dBm -123.11 -112.63 -117.91 -106.43 -114.89 -103.92
Cable loss dB 2.00 0.00 2.00 0.00 2.00 0.00
Body loss dB 0.00 3.00 0.00 0.00 0.00 0.00
Antenna gain RX dBi 18.00 0.00 18.00 0.00 18.00 0.00
Soft handover gain dB 2.00 2.00 2.00 2.00 2.00 2.00
Power control headroom dB 3.00 0.00 3.00 0.00 3.00 0.00
Isotropic power dBm -138.11 -111.63 -132.91 -108.43 -129.89 -105.92
TRANSMITTING END UE Node B UE Node B UE Node B
Power per connection dBm 21.00 22.48 21.00 23.48 21.00 28.97
Cable loss dB 0.00 2.00 0.00 2.00 0.00 2.00
Body loss dB 3.00 0 0.00 0 0.00 0
Antenna gain TX dBi 0.00 18 0.00 18 0.00 18
Peak EIRP dBm 18.00 38.48 21.00 39.48 21.00 44.97
Isotropic path loss dB 156.11 150.11 153.91 147.91 150.89 150.89
DL peak to average ratio dB 6.00 6.00 0.00
Isotropic path loss 156.11 153.91 150.89
52 © NOKIA FILENAMs.PPT/ DATE / NN
- 8. Power Budget Calculation
Coverage Area
CELL SIZE 12.2kbits 64kbits 128 kbits
• In WCDMA cellular networks the
Antenna height Node B 30.00 30.00 30.00 coverage area of cells overlap and the
Antenna height UE
Correction factor
1.50
0.00
1.50
0.00
1.50
0.00
mobile stations is able to connect to
more than just serving cell.
Outdoor location prob. 95% 95% 95%
Outdoor standard deviation 7.00 5.00 5.00 • This will increase the location
Slow fading margin
Outdoor cell size
7.27
2.27
4.51
2.36
4.51
1.93
probability against the isolated cell.
Indoor location prob. 95% 95% 95% • If we can reduce the LP from 96% to
BPL 18.00 18.00 18.00 90% we can reduce the Slow Fading
Indoor standard deviation 12.00 12.00 12.00
Slow fading margin 14.64 14.64 14.64
Margin and thus reduce the number of
Intdoor cell size 0.43 0.37 0.31 Node B of about 38%, in theory.
In car location prob. 95% 95% 95%
Car PL 5.00 5.00 5.00
In car standard deviation 8.00 8.00 8.00
Slow fading margin 8.70 8.70 8.70
In car cell size 1.49 1.29 1.06
53 © NOKIA FILENAMs.PPT/ DATE / NN