Marketplace and Quality Assurance Presentation - Vincent Chirchir
Entuity – managing aruba
1. Eye of the Storm 2011 management of Aruba WLANs
John Diamond, Principal Solutions Architect, Entuity Inc. May 2011
The following screenshots show how Aruba wireless LAN devices are managed and reported on by Eye
of the Storm (EYE). A model 3600-US Aruba Wireless Controller located in the PSE lab was remotely
managed using EYE for this exercise. The majority of the screenshots show the web browser UI and
various aspects of the visualization of the Wireless Controller and its associated access points.
The Explorer allows the devices under management to be navigated through using a tree structured
pane on the left. Various different panes are shown on the right in the context of the selected device.
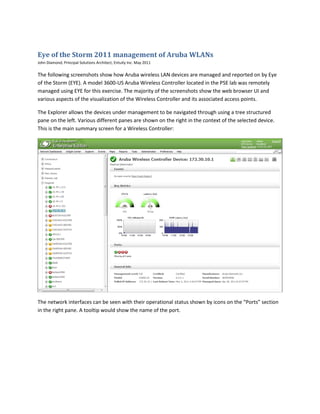
This is the main summary screen for a Wireless Controller:
The network interfaces can be seen with their operational status shown by icons on the “Ports” section
in the right pane. A tooltip would show the name of the port.
2. Clicking one of these icons changes the context to be that port which is also shown in the navigation
pane:
3. The most recent 4 hours of history are shown in the thumbnail charts for several metrics at the port
level. In this case the utilization levels were so low that they were not visible in the thumbnail charts but
a click on such a chart drills down into an interactive charting display that auto-sizes the Y axis by
default:
A list of ports with more details can be displayed:
4. An Advanced Details option allows all available aspects of the selected component to be displayed
textually:
5. One of the selection buttons in the top right of the device details pane allows the device level
monitoring thresholds to be visualized and adjusted. Wireless Controller specific threshold settings allow
various AP level conditions to be detected and corresponding real-time event generated. Examples of
these are the power and channel change frequency. These settings are auto-adjusted by the Wireless
Controller and frequent changes can indicate environmental problems with an AP:
Real-time events can be displayed in the UI and forwarded to external systems if required:
6. Details of each AP that is associated with a Wireless Controller are available:
Each antenna on each AP is also individually modeled, monitored and displayed:
7. WLAN details can also be displayed:
An addition client tool called the Component Viewer allows an alternative method of accessing all
available information about the Wireless Controllers and their associated APs:
8. One of the many included reports focuses specifically at Wireless Controller based WLANs. It catalogs
the controllers and their associated APs and provides a collection of inventory, asset and behavioral
details. This is especially useful for capacity planning exercises in the WLAN: