1. SCADA DASH BOARD
Introduction
According to Wikipedia, SCADA (Supervisory Control And Data Acquisition) is a system
that operates with coded signals over communication channels so as to provide control
of remote equipment (using typically one communication channel per remote station).
Architecture
SCADA dash board comprises of the Business and Operators end.
Business End
The business end is a web application accessible through a web browser.
Each end functions independently and integrates as a whole.
SCADA Setup and Usage
SCADA dashboard is accessible through the URL: scada.abujaelectricity.com/SCADA-
2/XII.php
NB: This will be changed subsequently to: “scada.abujaelectricity.com/SCADA/” once it
has been approved to have met the end user needs.
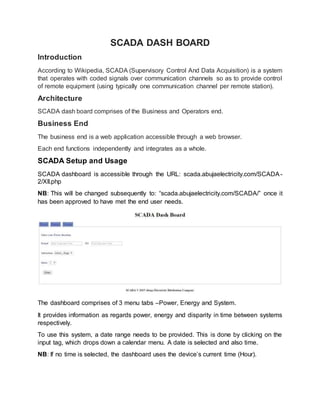
The dashboard comprises of 3 menu tabs –Power, Energy and System.
It provides information as regards power, energy and disparity in time between systems
respectively.
To use this system, a date range needs to be provided. This is done by clicking on the
input tag, which drops down a calendar menu. A date is selected and also time.
NB: If no time is selected, the dashboard uses the device’s current time (Hour).
2. A substation is selected from the list of dynamically updated substations available on the
database.
A meter address is also selected in the same manner as the substation.
Once all records have been provided the “Enter” button is clicked. This queries the
database using the user’s input.
When the server is done with the query, it returns to the user (web browser –front end)
representation of records using data analytical tools such as line graphs, pie and bar
charts.
Below are snap shots of the Dashboard:
4. Displayed Data set using Multiple Bar chart
Displayed Data set using Line Diagram
5. Data set being compared using Line Diagram
Operator’s End
Background
AEDC SCADA system is SATEC’s Power Monitoring and future Energy
Management Solution. It was designed to work seamlessly with SATEC
devices as well as many other device like raspberry pi, RTU, and PLC. The
SCADA system will reads data on a continuous basis from over 2,000
meters.
AEDC SCADA System Benefits
Early detection of problems prevents costly damage to equipment.
Power Quality Analysis enables efficientand professionalsolutions for
problems throughout the grid
Detect Sources of Energy inefficiency
Turn customers into partners by applying a transparent policy
Real-time date virtualizations.
Graphical representation of real-time data.
What AEDC SCADA System is for?
Collects data from meters
Analyzes the data
Presents the information using:
Tables
6. Line Diagrams
Standard Data Displays
Graphical Presentations
Interactive Graphs
Archiving and Display
Application Highlights
Navigation & Data Display through line diagram. This is a customize
navigation screens, such that when operators mouse over line
diagram, they get real-time data from MySQL database server.
8. Events and Alarms
Still under development.
Steps to access and use SCADA Frontend for Operators Audiences
1. Logon to your SCADA desktop system configure by IT department.
2. Open Internet Explorer or any browser of your choice.
3. On the address bar,type http://scada.abujaelectricity.com/scada3/ and
press enter key on your keyboard.
4.
5. You will now be presented with a web application interface as shown
below:
9. 6. Operators can navigate the SCADA Graphical User Interface with the
left navigation panel by mouse over on AEDC SUBSTATION link.
7. AEDC SUBSTATIONpage provide a landing page to view all Injection
Substations from one location. In this view, SCADA Operators are
made to select substation from drop down menu as shown below:
8. Mouse over AEDC SUBSTATION link will display a submenu for
injection substation areas:
i. Garki Area
ii. Wuse Area
9. Garki Area and Wuse Area links when click will display summary of all
substations in those areas.
10. Further mouse over Garki Area and Wuse Area will display
substations within those areas as illustrated below:
10. 11. So with a particular substation selected from the left navigation
panel, a line diagram will be display in the main content sectionof the
application. Example, in the line diagram above, the pilot substation
Wuse II-2 was selected and corresponding line diagram is display with
area maps within the diagrams.
12. Area maps in each line diagram representSATEC meters.When
mouse over, display real time readings from the meters at a particular
substation. In addition, when a particular substation is being view, you
can use the top navigation bar to view real time data across all SATEC
meters of a station. For example, Active Power is view across all
meters in the pilot substation Wuse II-2 as shown below:
13. On the same view of a substation selected from the left
navigation submenu, a onetime view of all SATEC meters from 11 and
33 KV can be view by clicking on the DATA POOL link from the top
navigation menu on a substation line diagram page.
11. 14. When on the DATA POOL view page, it is developed to refresh
at interval of 5 seconds.