SlideShare a Scribd company logo
1 of 8
Download to read offline
TRNEWS298JUNE–JULY–AUGUST2015
6
The author is Research
Scientist, Center for
Economic Development
and Research, University
of North Texas, Denton,
and Chair of the TRB
Standing Committee on
International Trade and
Transportation.
T
he Gulf of Mexico region has served for
decades as the U.S. headquarters for energy
production and exploration. Although petro-
leum dominates the region’s energy sector, other
industries include natural gas and coal, as well as
renewable energy sources. Recent trends in the
nation’s energy sector are having an effect on the
ports and private terminals along the Gulf of Mexico.
Petroleum Production
As the world’s population has grown and as develop-
ing nations have become wealthier, global oil produc-
tion has increased to meet demand. As shown in
Figure 1 (below), global oil production grew from
64.0 million barrels per day in 1980 to 89.8 billion bar-
rels in 2013—an increase of approximately 40 percent.
Despite claims of impending energy indepen-
dence, U.S. oil production grew only by 1.6 million
barrels per day between 1980 and 2013, to 12.4 mil-
lion barrels per day; U.S. refineries process 15 million
to 16 million barrels per day. In this period, the U.S.
share of global oil production peaked in 1985, when
it provided almost 20 percent of the world’s oil sup-
ply, and fell to its lowest level in 2005, when it con-
tributed slightly less than 10 percent. Since 2005, the
U.S. share of global oil production has increased,
reaching 13.7 percent in 2013.
Many U.S. ports, including ports and private
industry terminals along the Gulf of Mexico, have
benefited from the petroleum industry. In addition to
handling crude oil and petroleum products, these
facilities support an expansive and sophisticated oil
and gas exploration and production industry.
Figure 2 (page 7) shows the production of crude
oil in the Gulf of Mexico region between 1980 and
2013. Crude oil production in the Gulf region
declined between 1980 and 2007, as field production
in Texas fell. Increased production from offshore
wells in the Gulf of Mexico, however, partly offset
these losses during the 1990s and into the 2000s.
Pivotal Developments
After the Deepwater Horizon event in 2010, crude oil
production in the Gulf of Mexico stalled. The rupture
and explosion of the Deepwater Horizon well killed
11 workers and released more than 200 million gal-
lons of crude oil into the Gulf of Mexico, the worst
oil spill in U.S. history. Federal regulators applied a
U.S.GulfPortsHarbor
theChangingEnergySupplyM I C H A E L B O M B A
0.0%
2.0%
4.0%
6.0%
8.0%
10.0%
12.0%
14.0%
16.0%
18.0%
20.0%
0
10,000
20,000
30,000
40,000
50,000
60,000
70,000
80,000
90,000
100,000
1980
1981
1982
1983
1984
1985
1986
1987
1988
1989
1990
1991
1992
1993
1994
1995
1996
1997
1998
1999
2000
2001
2002
2003
2004
2005
2006
2007
2008
2009
2010
2011
2012
2013
U.S. Share of Global Production United States World
FIGURE 1 Total oil
production, thousands of
barrels per day,
1980–2012. (SOURCE: U.S.
Energy Information
Administration, 2014.)
The Maersk Developer drills an exploratory well in
the Gulf of Mexico. Gulf of Mexico ports and private
terminals support both the exploration and the
movement of crude oil and petroleum products.
PHOTO:JENNIFERA.DLOUHY,HOUSTONCHRONICLE
>>>>
TRNEWS298JUNE–JULY–AUGUST2015
7
higher level of scrutiny to offshore drilling and main-
tained a moratorium on deepwater drilling permits.
These responses effectively capped Gulf oil produc-
tion for several years.
Before the Deepwater Horizon disaster, offshore
drilling in the U.S. Gulf accounted for 25 to 30 per-
cent of total U.S. production. But while stricter over-
sight constrained offshore drilling, the shale plays in
Texas were beginning to ramp up production—
notably the Eagle Ford shale play in South Texas, the
Permian Basin shale play in West Texas, and the Bar-
nett shale play in the Dallas–Fort Worth region of
North Texas.
The Eagle Ford wells, in particular, produce a
large amount of crude oil and condensate, in addition
to natural gas. By 2013, Texas’s rapidly growing field
production of crude oil reduced the Gulf of Mexico’s
offshore share to less than 17 percent of total U.S. oil
production.
Petroleum Exploration
Gulf ports are the nexus of U.S. landside and offshore
petroleum exploration and production activities,
which require the movement of heavy equipment,
consumables, work crews, and extracted product.
For offshore drilling, all of these activities go through
ports or private terminals. West of Florida, the con-
struction, maintenance, and mooring of offshore
drilling platforms, as well as offshore servicing ves-
sels, are common sights at ports and private termi-
nals.
Offshore platforms usually transport cargoes to
shore via pipelines, although some facilities, like the
Cayo Arcas terminal in Mexico, load the crude oil
directly into tankers. With the lifting of the morato-
rium on new drilling in the Gulf of Mexico, several
major deepwater projects are moving forward, pro-
viding continuing opportunities for Gulf ports.
Landside oil and gas exploration and production
in the shale plays has generated significant volumes
of new cargoes for Gulf ports, especially for con-
sumables like sand and pipe. Hydraulic fracturing
requires a special type of sand, which is mixed with
water and chemicals and forced underground at high
pressures to extract the gas and oil. The grains of
sand must have the right dimensions; as a result, the
sand often is transported considerable distances to
the drilling sites.
All oil wells require pipe casing to line the bore
hole, but hydraulic fracturing wells run deep in the
ground and extend horizontally for significant dis-
tances, requiring a lot of pipe. Pipelines are the pre-
ferred mode for transporting the crude oil from the
wells to the refineries, but when pipelines are not
close by or may not have sufficient capacity, the
crude may travel by railway tank car or by tanker
truck to the pipeline network—or by barge directly
to the refineries. The Eagle Ford shale play, for exam-
ple, has increased barge traffic on the Gulf Intra-
coastal Waterway.
Crude Oil
Approximately half of the nation’s annual total of
foreign waterborne commerce is handled at ports
and private marine terminals in the Gulf of Mexico,
and a large share of that cargo is crude oil. During
2012, ports and private terminals along the Gulf of
Mexico handled almost 208 million tons of crude oil,
with almost 93 percent at locations west of the Mis-
sissippi River (see Figure 3, page 8).
Between 2008 and 2012, the volume of crude oil
handled in the Gulf declined by 21 million tons or
9.2 percent. Three factors influenced this trend. First,
personal vehicles continued to gain fuel efficiency.
Second, total vehicle miles traveled in the United
States have declined. Third, domestic oil production
from shale plays is replacing imported crude oil.
0
500
1,000
1,500
2,000
2,500
3,000
3,500
4,000
4,500
Alabama Field Production Louisiana Field Production
Mississippi Field Production Texas Field Production
Gulf of Mexico Production
Crude oil–filled barges
travel the Gulf
Intracoastal Waterway,
which has experienced
increased traffic from
hydraulic fracturing
activity in Texas shale
plays.
PHOTO:U.S.COASTGUARD
FIGURE 2 Crude oil
production in the Gulf of
Mexico region. (SOURCE:
U.S. Energy Information
Administration, 2014.)
TRNEWS298JUNE–JULY–AUGUST2015
8
This last trend is evident in the share of domestic
oil handled at Gulf ports (Figure 4, below). During
2008, less than 4.0 percent of crude oil handled at
Gulf ports originated from a domestic port, but by
2012, that figure had risen to 10 percent and will
likely increase for 2013 and 2014.
When the crude oil arrives onshore, refineries
render it into gasoline, diesel, and other petroleum
products or into feedstocks for the petrochemical
industry. Table 1 (right) shows that the United States
has the capacity to refine almost 18 million barrels of
crude oil per day.
The states along the Gulf of Mexico provide almost
half—49.8 percent—of that capacity. Texas provides
almost 29 percent of the nation’s oil refinery capacity,
followed by Louisiana at 18.3 percent; the remaining
U.S. Gulf states provide less than 3 percent: Missis-
sippi, 2.0 percent; Alabama 0.7 percent; and Florida,
less than one-tenth of 1 percent. The various fuels
produced are transported to local distribution centers
through pipelines or by tanker or barge.
Although the volume of crude oil imported by
Gulf ports and private terminals between 2008 and
2012 fell by 9.2 percent—the decline nationwide was
more than 25.5 percent—Gulf maritime facilities are
handling larger and larger volumes of outbound
petroleum products, mostly at ports and private ter-
minals in the Western Gulf. Between 2008 and 2012,
this volume grew by 41.3 million tons or 32.6 per-
cent. The trend suggests that pipelines increasingly
are feeding these refineries with domestically pro-
duced crude oil.
Natural Gas
Hydraulic fracturing also has increased the production
of natural gas in the United States. Between 2006 and
2013, U.S. production of natural gas increased by 27.5
percent or almost 6.5 million cubic feet (MMcf or
1,027,000,000 Btu; see Figure 5, page 9). Consump-
tion also has grown, as natural gas replaces coal for
generating electric power and as the petrochemical
industry takes advantage of the cheap feedstock.
The export of natural gas has increased, although
modestly. In 2013, approximately 5 percent of U.S.-
produced natural gas was exported, almost entirely
to Mexico and Canada. Most of the nation’s supply
of natural gas remains in the domestic market, keep-
ing natural gas prices in the United States low.
Logically, producers would want to export natural
gas to countries with higher prices. Table 2 (page 9)
shows the price for liquefied natural gas (LNG) in
Lake Charles, Louisiana, compared with the prices in
locations around the world. Although the price of
LNG has declined in the past year, the global price dif-
0
20
40
60
80
100
120
140
160
180
2008 2009 2010 2011 2012
TonsofPetroleumProducts(millions)
West Gulf Coast East Gulf Coast
0
50
100
150
200
250
2008 2009 2010 2011 2012
TonsofCrudeOil(millions)
West Gulf Coast East Gulf Coast
FIGURE 3 Tonnage of
crude oil offloaded at
U.S. Gulf ports and
private terminals,
2008–2012. (SOURCE: U.S.
Army Corps of Engineers,
2014.)
FIGURE 4 Tonnage of
petroleum products
originating from U.S.
Gulf ports and private
terminals, 2008–2012.
(SOURCE: U.S. Army Corps
of Engineers, 2014.)
TABLE 1 U.S. Refinery Capacity for Selected
States, as of January 1, 2014
Barrels per Production
Rank Location Calendar Day (%)
1 Texas 5,174,209 28.9
2 Louisiana 3,274,520 18.3
3 California 1,960,671 10.9
4 Illinois 958,645 5.3
5 Washington 631,700 3.5
6 Pennsylvania 596,000 3.3
7 Ohio 530,000 3.0
8 Oklahoma 523,300 2.9
9 New Jersey 468,000 2.6
10 Indiana 440,600 2.5
11 Mississippi 364,000 2.0
12 Minnesota 359,500 2.0
Remainder of the
United States 2,643,485 14.7
Total United States 17,924,630 100.0
Total U.S. Gulf
Coast Capacitya 8,108,826 45.2
a Only includes refineries located directly on the Gulf Coast.
SOURCE: U.S. Energy Information Administration, 2014.
TRNEWS298JUNE–JULY–AUGUST2015
9
ferential with the Lake Charles price ranged from
$4.54 to $13.06 per million Btu as of December 2014.
The difficulty of exporting natural gas relates pri-
marily to its transportation. Pipeline is the optimal
mode, but the natural gas pipelines between the
United States and Mexico or Canada are limited. Sell-
ing in more distant markets requires that the gas be
liquefied by chilling to Ϫ162°C (Ϫ260°F). Lique-
faction allows further compression, so that the gas
can be loaded onto LNG tankers for export. This
process requires a special facility; the United States
currently has none.
As of December 2014, however, four LNG export
terminals have received approval—three are in the
Gulf of Mexico: in Sabine and Hackberry, Louisiana,
and Freeport, Texas—and 10 others are planned
along the Gulf Coast. Export terminals for LNG cost
several billion dollars to construct, and the federal
permitting process is rigorous.
Another difficulty is that the draft of most LNG
tanker vessels is deep; more than 90 percent cannot
fit into the locks of the Panama Canal. With the
Panama Canal’s expansion, however, approximately
90 percent of the world’s fleet will be able to fit. Many
in the shipping and petroleum industry anticipate
that the liquefaction plants and the expanded
Panama Canal will make LNG a significant export
commodity from the Gulf of Mexico.
Coal
Coal is another source of fossil energy handled at
ports and private terminals in the Gulf region. Figure
FIGURE 5 U.S.
withdrawals and
production of natural gas
(MMcf), 1980–2013.
(SOURCE: U.S. Energy
Information
Administration, 2014.)
Oil drilling rig on the
Barnett Shale near
Alvarado, Texas. Most
domestically produced
crude oil stays in the
United States.
PHOTO:DAVIDR.TRIBBLE
0%
1%
2%
3%
4%
5%
6%
0
5
10
15
20
25
30
35
2012
2011
2010
2009
2008
2007
2006
2005
2004
2003
2002
2001
1999
1998
1997
1996
1995
1994
1993
1992
1991
1990
1989
1988
1987
1986
1985
1984
1983
1982
1981
1980
ShareofProductionExported
U.S.NaturalGasWithdrawals
(millionsofcubicfeet)
Percentage Exported U.S. Gas Gross Withdrawals (MMcf)
TABLE 2 Estimated World LNG Landed Prices: November 2013 and December 2014 (US$/MMBtu)
November December Differential with 2013–2014
Location 2013 2014 Lake Charles Difference
Canaport, Canada NA $16.78 $13.06 NA
Altamira, Mexico $16.40 $11.54 $7.82 -$4.86
Rio de Janeiro, Brazil $14.65 $11.35 $7.63 -$3.30
Bahia Blanca, Argentina $15.65 $11.78 $8.06 -$3.87
United Kingdom $10.66 $8.56 $4.84 -$2.10
Belgium $10.40 $8.26 $4.54 -$2.14
Spain $10.90 $9.76 $6.04 -$1.14
Korea $15.65 $12.00 $8.28 -$3.65
India $13.75 $11.45 $7.73 -$2.30
Japan $15.65 $12.00 $8.28 -$3.65
China $15.25 $11.60 $7.88 -$3.65
Lake Charles, La. $3.15 $3.72 — $0.57
NOTE: NA = not available. SOURCE: Waterborne Energy, Inc., 2013 and 2014.
TRNEWS298JUNE–JULY–AUGUST2015
10
6 (above) shows the volume of U.S. coal exports
handled within U.S. customs districts, large regions
that include multiple ports and terminals. These fig-
ures show that coal exports from the Gulf region
rose sharply between 2009 and 2012, from 12.8 mil-
lion to 41.6 million tons, but dropped 14.2 percent
to 35.7 million tons between 2012 and 2013.
Coal exports from the Gulf region comprised 30.1
percent of the U.S. total in 2013. The majority of the
coal, however, did not go to Asia, despite China’s
heavy use of coal for energy production. The cus-
tomers for 51.3 percent of U.S. export coal were the
nations of Europe; China received only 7.0 percent;
moreover, the Chinese government recently com-
mitted to cap coal use by 2020.
Major coal exporting facilities in the Gulf of Mex-
ico are located within or near the Ports of Houston,
Texas; New Orleans, Louisiana; and Mobile,
Alabama. As in the Pacific Northwest, environmen-
tal groups have worked to prevent the construction
of new coal export terminals. Although opponents
emphasize the local effects of the terminals, climate
change is usually the main concern.
Three terminals proposed in Corpus Christi,
Texas, were canceled because of market uncertainties
but also came under scrutiny from environmental
groups. The Port of Mobile, which receives approx-
imately two-thirds of its revenue from coal exports,
is considering a $140 million expansion near a coal
terminal.
Coal imports, in contrast, fell from 10.7 million
tons in 2009 to 4.1 million tons in 2013 (Figure 7,
below left). The Mobile customs district lost a large
volume of cargo; the Tampa, Florida, customs district
also experienced losses. The drop in coal imports
from the Gulf region reflects a national trend.
Wind
Renewable energy—namely wind—has played an
important role in the cargo mix for some Gulf ports
for a decade or more. The United States has only a
few wind turbine manufacturing facilities—many of
the nation’s wind turbines are manufactured over-
seas. Imported wind turbines must travel a portion
of their trip by water, moving in parts from the man-
ufacturer to final assembly.
Typically, a disassembled windmill arrives as
seven or more major components: three blades, three
or more tower sections, and the nacelle, which con-
tains the generator mounted at the top of the wind
turbine. The blades typically range in length from
105 to 160 feet, and the assembled tower sections
range from 100 to 150 feet in height. The nacelle is
roughly the size of a city bus. After these components
are offloaded from ships, they travel by truck and
sometimes by rail as oversize movements to the
places of installation.
Texas ports handle most of the wind turbine car-
goes in the Gulf of Mexico. Texas and some areas of
western, coastal Louisiana are the only locations in
the Gulf region with wind conditions to support
energy production. According to the U.S. Depart-
0%
5%
10%
15%
20%
25%
30%
35%
0
5
10
15
20
25
30
35
40
45
2009 2010 2011 2012 2013
ShareofU.S.Total
TonsofCoal(millions)
Tampa Houston–Galveston Mobile New Orleans
Gulf Region’s Share of Total
0.0%
10.0%
20.0%
30.0%
40.0%
50.0%
60.0%
0.0
2.0
4.0
6.0
8.0
10.0
12.0
2009 2010 2011 2012 2013
ShareofU.S.Total
TonsofCoal(millions)
Houston–Galveston New Orleans
Tampa Mobile
Gulf Region’s Share of Total
FIGURE 6 U.S. coal
exports by U.S. Customs
districts along the Gulf of
Mexico. (SOURCE: U.S.
Energy Information
Administration, 2014.)
FIGURE 7 U.S. coal
imports by U.S. Customs
districts along the Gulf of
Mexico. (SOURCE: U.S.
Energy Information
Administration, 2014.)
PHOTO:LANCEANDERIN,FLICKR
Coal exports from the Gulf more than tripled
between 2009 and 2012, topping 41 million tons,
but by 2013 decreased to 35.7 million tons.
TRNEWS298JUNE–JULY–AUGUST2015
11
ment of Energy, Texas is the only U.S. Gulf state that
produces wind power and ranks first among all states
in wind power capacity, with 12,354 megawatts
(MW) at the end of 2013; California ranks second,
with 5,829 MW.
Energy production from wind power relies on a
federal tax credit to make many projects financially
viable. A federal tax credit of $0.023 per kilowatt-
hour produced in the first 10 years of a wind project
expired in 2014. The loss of this tax credit could
reduce—if not eliminate—the installation of wind
turbines in the United States.
In addition, offshore wind farms in the Gulf of
Mexico are under proposal, with a total capacity of
4,371 MW; none of the facilities listed in Table 3,
however, has been built. Except for one in Louisiana,
all of the proposed offshore wind farms are in Texas.
The Port of Corpus Christi has become a renew-
able energy producer. The port took advantage of its
location along the Gulf Coast, its abundant land
holdings, and the almost constant winds in the area
to install six 1.5-MW wind turbines.
Wood Pellets
Wood pellets are another sustainable energy source
moving through Gulf ports. The vitamin-sized wood
waste products are burned to generate electricity.
Burning coal or natural gas releases carbon dioxide
(CO2) that was sequestered underground; in con-
trast, the CO2 in wood pellets, like that from other
biomass sources, is released by natural decomposi-
tion; therefore the net effect of the emissions is con-
sidered close to zero.
Wood pellets are in demand in Europe, where the
European Union has mandated production of 20
percent of electricity from renewable energy sources.
Because the pellets can be mixed with coal, utility
operators do not need to retrofit power plants. Envi-
ronmental advocacy groups, however, are concerned
that the demand for wood pellets may encourage
deforestation.
Many ports along the Gulf of Mexico already han-
dle wood products from the timber industry of the
Southeastern United States; wood pellets have
become one more commodity in the mix, particu-
larly at ports from the Florida Panhandle to Port
Arthur, Texas. As many states or utilities seek to sub-
stitute biomass fuels for coal, the wood pellet indus-
try is expected to continue growing.
Future Trends
A variety of factors, including channel deepening and
navigational improvements, fluctuating oil prices, cli-
mate change, and the opening of the Mexican petro-
leum industry to private investment, will influence
the near- and long-term future of ports and private ter-
minals in the Gulf of Mexico and their role in the
energy sector.
Channel Projects
The Water Resources Reform and Development Act of
2014 (WRRDA) has moved several significant chan-
nel projects important to the energy industry closer to
construction. The projects in Texas include the $1.1
billion Sabine-Neches Waterway project, the $239 mil-
lion Freeport Harbor Channel project, and the $353
million Corpus Christi Channel project, each serving
a major activity center for the oil and gas industry.
WRRDA also sets aside $50 million dollars of dis-
cretionary funding for “energy transfer ports.” These
U.S. Customs ports must have handled at least 40 mil-
lion tons of cargo during FY 2012, and energy com-
modities must have comprised at least 25 percent of
the tonnage. Although the need for port and naviga-
TABLE 3 Proposed Offshore Wind Farms in the Gulf of Mexico
State Project Name Generating Capacity (MW)
Louisiana Vermillion Bay 36
Texas Jefferson Offshore 300
Texas Galveston Offshore Wind Farm 150
Texas Galveston Offshore Wind Farm 2 150
Texas Galveston Test 3
Texas Brazoria Offshore 500
Texas Titan Platform 7
Texas Mustang Island Offshore Wind Farm 1,200
Texas Rio Grande North 1,000
Texas Rio Grande South 1,000
Texas Texas Offshore Pilot Research Project 25
TOTAL 4,371
NOTE: MW = megawatts = 1,000,000 watts.
SOURCE: OpenEI, 2014.
Many wind turbine parts
are manufactured
overseas, delivered to
Gulf ports, and shipped
by truck or rail—often as
oversize loads—for
assembly onsite.
PHOTO:J.BREW,FLICKR
TRNEWS298JUNE–JULY–AUGUST2015
12
tion improvements outstrips the supply of public
funding, the WRRDA will address some of the nation’s
most urgently needed improvements for the energy
sector.
Oil Prices
The refining side of the petroleum industry is relatively
stable, but the exploration and production side faces
intrinsic instability and risk. These instabilities lead to
price fluctuations and production booms and busts.
Petroleum prices often produce countervailing
impacts on the economy—higher prices can encour-
age oil exploration and drilling but also discourage
driving, reduce household incomes, and raise business
costs. Lower gasoline prices, usually seen as positive
for the economy, can diminish economic activity
related to exploration and drilling.
Historically, Gulf ports serving the energy industry
have benefited from higher prices, which encourage
more offshore exploration and production. More
recently, the growth in hydraulic fracturing has led to
the handling of more fracking sand, pipes, heavy
equipment, and crude oil. In contrast, prices that are
too high can reduce the volume of crude oil imported
for refinement into gasoline, distillates, and other
products.
Even with higher prices, the demand for gasoline
is fairly inelastic, and the number of refineries is rela-
tively fixed—reduced production therefore has rela-
tively small impacts on employment. The demand for
exploration and drilling activities, however, is highly
elastic and responds strongly to prices, generating or
contracting significant ancillary employment.
Offshore drilling and hydraulic fracturing are
expensive methods of extracting oil, and the viability
correlates strongly with the price of oil. In December
2014, for example, oil was approximately $60 per bar-
rel, down from more than $100 dollars a barrel at
midyear and with predictions of prices in the range of
$40 to $45. The high cost of extracting oil by hydraulic
fracturing and from the Canadian tar sands can make
some sources of oil and gas no longer financially
viable.
Industry experts have estimated that the Eagle
Ford shale wells can operate profitably in the range of
$40 to $60 per barrel, but the Permian Basin shale play
requires between $59 and $82 per barrel to break even.
Canadian tar sands need prices at $90 per barrel or
more to cover operating costs. As prices drop, explo-
ration and production will diminish, and the volume
of related crude oil, equipment, and consumables han-
dled at Texas ports will drop.
Climate Change
Although the global response to climate change has
been lackluster, the long-term effects and conse-
quences are yet to come. Fossil fuels play a significant
role in climate change; the world may be forced to rely
less on fossil fuels and more on renewable energy
sources. These changes may be decades away but
An exploratory drillship
on the Gulf of Mexico. In
general, demand for oil
exploration rises and falls
with oil prices.
In 2012 the Port of
Corpus Christi
constructed six wind
turbines along Nueces
Bay in Texas—the first
wind farm located on
industrial port property
in the country.
PHOTO:KM&G-MORRIS,FLICKR
PHOTO:JESSESAMU,PORTCORPUSCHRISTIAUTHORITY
TRNEWS298JUNE–JULY–AUGUST2015
13
likely will curtail or end many of the activities related
to fossil fuels in the Gulf of Mexico. Current and
potentially new sources of renewable energy will
become more prominent in port activities, but their
economic footprint is unlikely to be as large as that of
the fossil fuel industries today.
Mexico’s Oil Industry
In December 2013, Mexico’s Congress and Executive
Branch approved a constitutional amendment that
would allow private-sector investment in the explo-
ration and production of the nation’s oil and gas
reserves. The amendment can induce significant
investment of foreign capital into Mexico’s petroleum
industry.PetróleosMexicanos,orPEMEX,thenational
oil corporation, needs foreign investment, technical
expertise, and technologically advanced drilling equip-
ment to maximize the exploitation of current fields
and to drill in new oil fields and gas plays.
Northern Mexico—notably the Burgos shale basin
near the Texas border—may contain large shale gas
formations comparable in scale to the Eagle Ford shale
play. U.S. firms looking to expand operations or to
redeploy underutilized or idle drilling equipment will
likely consider sending their equipment into Mexico.
Other potential impacts to the Texas transportation
system include servicing the expanded drilling in
Mexico’s territorial waters in the Gulf—such as the
200-mile Exclusive Economic Zone—and shipping
oil and gas from Mexico to Texas for additional pro-
cessing. These movements could generate substantial
freight volumes, consisting of heavy oil field equip-
ment and other materials, such as pipes, from Texas
into Mexico, as well as petroleum products from
Northern Mexico into Texas. U.S. Gulf ports and pri-
vate terminals—particularly those west of the Missis-
sippi River—are likely to see increased freight volumes
related to activities in Mexico.
Critical Role and Challenges
The critical role of Gulf ports in the nation’s energy sec-
tor is expected to continue. A return to deepwater off-
shore drilling in the Gulf of Mexico, the continuation
of hydraulic fracturing in shale plays around the coun-
try, and the opening of the Mexican petroleum indus-
try to foreign investment will drive demand for the
services provided by Gulf ports and private terminals.
Inaddition,navigationimprovementsthroughWRRDA
andthecompletedexpansionofthePanamaCanalwill
make LNG a feasible U.S. export commodity.
Fluctuations in the price of oil, however, will chal-
lenge growth in the petroleum industry. The produc-
tion of energy by renewable sources also will continue
to have an important role at Gulf ports, although not
likely to replace fossil fuels in the short to medium
term. Renewable sources typically are more expen-
sive and are not able to provide energy on the scale
necessary to maintain current levels of consumption.
Over the longer term, the consequences of climate
change may become too great to ignore, and the
reliance on fossil fuels will have to be scaled back. The
economic consequences of this shift likely will mean
a contraction of the fossil fuel sector, affecting eco-
nomic activity in the Gulf region.
Resources
Dunn, S. Fracking 101: Breaking Down the Most Important
Part of Today’s Oil, Gas Drilling. Greeley Tribune. January
5, 2014. www.greeleytribune.com/news/9558384-113/
drilling-oil-equipment-wellbore.
Gold, R. Wood Pellets Catch Fire as Renewable Energy Source.
Wall Street Journal, July 7, 2009. www.wsj.com/articles/
SB124691728110402383.
Krauss, C. U.S. Coal Companies Scale Back Export Goals. New
York Times, September 13, 2013. www.nytimes.com/2013/
09/14/business/energy-environment/us-coal-companies-
scale-back-export-goals.html?pagewanted=all&_r=0.
Nunez, C. The Energy Boom You Haven’t Heard About: Wood
Pellets. National Geographic. http://news.national
geographic.com/news/energy/2014/12/141208-wood-
pellet-energy-boom-driven-by-exports/.
Nussbaum, A. Wind Power Tax Credit “Dead” in Congress
This Year. Bloomberg, March 11, 2014. www.bloomberg.
com/news/2014-03-11/wind-power-tax-credit-dead-in-
congress-this-year.html.
Plumer, B. How Far Do Oil Prices Have to Fall to Throttle the
U.S. Shale Boom? Vox. www.vox.com/2014/12/3/7327147/
oil-prices-breakeven-shale.
Shaw, J. Gulf Coast Ports Look Beyond the Box. Pacific Mar-
itime Magazine, Vol. 32. No. 6, June 2014. www.pacmar.
com/story/2014/06/01/features/gulf-coast-ports-look-
beyond-the-box/255.html.
Wong, E. In Step to Lower Carbon Emissions, China Will
Place a Limit on Coal Use in 2020. New York Times,
November 20, 2014. www.nytimes.com/2014/11/21/
business/energy-environment/china-to-place-limit-on-
coal-use-in-2020.html.
The Discoverer Enterprise
and other vessels
continued to recover oil
from the site for months
after the Deepwater
Horizon explosion in
2010.
PHOTO:BOBLAURA,U.S.COASTGUARD

More Related Content

What's hot

TD Securities Calgary Energy Conference 2014
TD Securities Calgary Energy Conference 2014TD Securities Calgary Energy Conference 2014
TD Securities Calgary Energy Conference 2014Enbridge Inc.
 
Arctic Oil and Gas Resource Development: Current Situation and Prospects
Arctic Oil and Gas Resource Development: Current Situation and ProspectsArctic Oil and Gas Resource Development: Current Situation and Prospects
Arctic Oil and Gas Resource Development: Current Situation and ProspectsRussian Council
 
APAC LNG PDF
APAC LNG PDFAPAC LNG PDF
APAC LNG PDFPaul Lim
 
New base special 15 september 2014
New base special  15 september   2014New base special  15 september   2014
New base special 15 september 2014Khaled Al Awadi
 
Dr Dev Kambhampati | DOE- LNG PRIMER
Dr Dev Kambhampati | DOE- LNG PRIMERDr Dev Kambhampati | DOE- LNG PRIMER
Dr Dev Kambhampati | DOE- LNG PRIMERDr Dev Kambhampati
 
Bord Gáis Energy Index August 2015
Bord Gáis Energy Index August 2015Bord Gáis Energy Index August 2015
Bord Gáis Energy Index August 2015Bord Gáis Energy
 
Bord Gáis Energy Index October 2015
Bord Gáis Energy Index October 2015Bord Gáis Energy Index October 2015
Bord Gáis Energy Index October 2015Bord Gáis Energy
 
Step on the Gas! How to Extend America's Energy Advantage
Step on the Gas! How to Extend America's Energy AdvantageStep on the Gas! How to Extend America's Energy Advantage
Step on the Gas! How to Extend America's Energy AdvantageMarcellus Drilling News
 
Final_YSU_MichiganSubmission
Final_YSU_MichiganSubmissionFinal_YSU_MichiganSubmission
Final_YSU_MichiganSubmissionKen Kilpatrick
 
150512 | Industrie & Energie | Is Saudi Arabia still ruling the OPEC? | Prese...
150512 | Industrie & Energie | Is Saudi Arabia still ruling the OPEC? | Prese...150512 | Industrie & Energie | Is Saudi Arabia still ruling the OPEC? | Prese...
150512 | Industrie & Energie | Is Saudi Arabia still ruling the OPEC? | Prese...Flevum
 
129285129 oraganizational-study
129285129 oraganizational-study129285129 oraganizational-study
129285129 oraganizational-studyhomeworkping8
 
R43390 Rail Transport of Crude Oil
R43390 Rail Transport of Crude OilR43390 Rail Transport of Crude Oil
R43390 Rail Transport of Crude OilAnthony Andrews
 
Shipping U.S. Crude Oil by Water: Vessel Flag Requirements and Safety Issues
Shipping U.S. Crude Oil by Water: Vessel Flag Requirements and Safety Issues Shipping U.S. Crude Oil by Water: Vessel Flag Requirements and Safety Issues
Shipping U.S. Crude Oil by Water: Vessel Flag Requirements and Safety Issues GE 94
 
New base 26 december 2019 energy news issue 1305 by khaled al awadi -compr...
New base 26 december 2019 energy news issue   1305  by khaled al awadi -compr...New base 26 december 2019 energy news issue   1305  by khaled al awadi -compr...
New base 26 december 2019 energy news issue 1305 by khaled al awadi -compr...Khaled Al Awadi
 
2019 Election| LNG| Natural Resources| Canada| August 2019
2019 Election| LNG| Natural Resources| Canada| August 20192019 Election| LNG| Natural Resources| Canada| August 2019
2019 Election| LNG| Natural Resources| Canada| August 2019paul young cpa, cga
 
New base energy news 22 october 2020 issue no. 1383 by senior editor khal...
New base energy news  22 october 2020   issue no. 1383  by senior editor khal...New base energy news  22 october 2020   issue no. 1383  by senior editor khal...
New base energy news 22 october 2020 issue no. 1383 by senior editor khal...Khaled Al Awadi
 

What's hot (20)

TD Securities Calgary Energy Conference 2014
TD Securities Calgary Energy Conference 2014TD Securities Calgary Energy Conference 2014
TD Securities Calgary Energy Conference 2014
 
Arctic Oil and Gas Resource Development: Current Situation and Prospects
Arctic Oil and Gas Resource Development: Current Situation and ProspectsArctic Oil and Gas Resource Development: Current Situation and Prospects
Arctic Oil and Gas Resource Development: Current Situation and Prospects
 
APAC LNG PDF
APAC LNG PDFAPAC LNG PDF
APAC LNG PDF
 
New base special 15 september 2014
New base special  15 september   2014New base special  15 september   2014
New base special 15 september 2014
 
Dr Dev Kambhampati | DOE- LNG PRIMER
Dr Dev Kambhampati | DOE- LNG PRIMERDr Dev Kambhampati | DOE- LNG PRIMER
Dr Dev Kambhampati | DOE- LNG PRIMER
 
Bord Gáis Energy Index August 2015
Bord Gáis Energy Index August 2015Bord Gáis Energy Index August 2015
Bord Gáis Energy Index August 2015
 
Bord Gáis Energy Index October 2015
Bord Gáis Energy Index October 2015Bord Gáis Energy Index October 2015
Bord Gáis Energy Index October 2015
 
Step on the Gas! How to Extend America's Energy Advantage
Step on the Gas! How to Extend America's Energy AdvantageStep on the Gas! How to Extend America's Energy Advantage
Step on the Gas! How to Extend America's Energy Advantage
 
Devon Stock Report-3
Devon Stock Report-3Devon Stock Report-3
Devon Stock Report-3
 
Final_YSU_MichiganSubmission
Final_YSU_MichiganSubmissionFinal_YSU_MichiganSubmission
Final_YSU_MichiganSubmission
 
GLOBAL CRUDE OIL MARKET
GLOBAL CRUDE OIL MARKETGLOBAL CRUDE OIL MARKET
GLOBAL CRUDE OIL MARKET
 
150512 | Industrie & Energie | Is Saudi Arabia still ruling the OPEC? | Prese...
150512 | Industrie & Energie | Is Saudi Arabia still ruling the OPEC? | Prese...150512 | Industrie & Energie | Is Saudi Arabia still ruling the OPEC? | Prese...
150512 | Industrie & Energie | Is Saudi Arabia still ruling the OPEC? | Prese...
 
129285129 oraganizational-study
129285129 oraganizational-study129285129 oraganizational-study
129285129 oraganizational-study
 
R43390 Rail Transport of Crude Oil
R43390 Rail Transport of Crude OilR43390 Rail Transport of Crude Oil
R43390 Rail Transport of Crude Oil
 
Shipping U.S. Crude Oil by Water: Vessel Flag Requirements and Safety Issues
Shipping U.S. Crude Oil by Water: Vessel Flag Requirements and Safety Issues Shipping U.S. Crude Oil by Water: Vessel Flag Requirements and Safety Issues
Shipping U.S. Crude Oil by Water: Vessel Flag Requirements and Safety Issues
 
New base 26 december 2019 energy news issue 1305 by khaled al awadi -compr...
New base 26 december 2019 energy news issue   1305  by khaled al awadi -compr...New base 26 december 2019 energy news issue   1305  by khaled al awadi -compr...
New base 26 december 2019 energy news issue 1305 by khaled al awadi -compr...
 
2019 Election| LNG| Natural Resources| Canada| August 2019
2019 Election| LNG| Natural Resources| Canada| August 20192019 Election| LNG| Natural Resources| Canada| August 2019
2019 Election| LNG| Natural Resources| Canada| August 2019
 
Crude oil Falling Prices
Crude oil Falling PricesCrude oil Falling Prices
Crude oil Falling Prices
 
The Macondo blowout
The Macondo blowoutThe Macondo blowout
The Macondo blowout
 
New base energy news 22 october 2020 issue no. 1383 by senior editor khal...
New base energy news  22 october 2020   issue no. 1383  by senior editor khal...New base energy news  22 october 2020   issue no. 1383  by senior editor khal...
New base energy news 22 october 2020 issue no. 1383 by senior editor khal...
 

Viewers also liked

Texas - Global Logistics-Driven Investment
Texas - Global Logistics-Driven InvestmentTexas - Global Logistics-Driven Investment
Texas - Global Logistics-Driven Investmentawasserm
 
Florida Economic Development Council
Florida Economic Development CouncilFlorida Economic Development Council
Florida Economic Development Councilawasserm
 
Pinellas "Creative" - Focus Group Presentation
Pinellas "Creative" - Focus Group PresentationPinellas "Creative" - Focus Group Presentation
Pinellas "Creative" - Focus Group Presentationpinellascreative
 
Final Fuel Volume Consumption vs. Gas Prices
Final Fuel Volume Consumption vs. Gas PricesFinal Fuel Volume Consumption vs. Gas Prices
Final Fuel Volume Consumption vs. Gas PricesCourtney Correa
 
Pinellas Creative Presentation - May 24, 2011
Pinellas Creative Presentation - May 24, 2011Pinellas Creative Presentation - May 24, 2011
Pinellas Creative Presentation - May 24, 2011pinellascreative
 
Eric Peterson - ABC Conference Jan 2015
Eric Peterson - ABC Conference Jan 2015Eric Peterson - ABC Conference Jan 2015
Eric Peterson - ABC Conference Jan 2015Eric R. Peterson
 
8 Daily Super Powers for a Successful 2013
8 Daily Super Powers for a Successful 20138 Daily Super Powers for a Successful 2013
8 Daily Super Powers for a Successful 2013Ari Bancale
 
California Logistics and Economic Development
California Logistics and Economic DevelopmentCalifornia Logistics and Economic Development
California Logistics and Economic Developmentawasserm
 

Viewers also liked (9)

Texas - Global Logistics-Driven Investment
Texas - Global Logistics-Driven InvestmentTexas - Global Logistics-Driven Investment
Texas - Global Logistics-Driven Investment
 
Florida Economic Development Council
Florida Economic Development CouncilFlorida Economic Development Council
Florida Economic Development Council
 
Pinellas "Creative" - Focus Group Presentation
Pinellas "Creative" - Focus Group PresentationPinellas "Creative" - Focus Group Presentation
Pinellas "Creative" - Focus Group Presentation
 
Final Fuel Volume Consumption vs. Gas Prices
Final Fuel Volume Consumption vs. Gas PricesFinal Fuel Volume Consumption vs. Gas Prices
Final Fuel Volume Consumption vs. Gas Prices
 
Pinellas Creative Presentation - May 24, 2011
Pinellas Creative Presentation - May 24, 2011Pinellas Creative Presentation - May 24, 2011
Pinellas Creative Presentation - May 24, 2011
 
Eric Peterson - ABC Conference Jan 2015
Eric Peterson - ABC Conference Jan 2015Eric Peterson - ABC Conference Jan 2015
Eric Peterson - ABC Conference Jan 2015
 
praveen CV.docx 2
praveen CV.docx 2praveen CV.docx 2
praveen CV.docx 2
 
8 Daily Super Powers for a Successful 2013
8 Daily Super Powers for a Successful 20138 Daily Super Powers for a Successful 2013
8 Daily Super Powers for a Successful 2013
 
California Logistics and Economic Development
California Logistics and Economic DevelopmentCalifornia Logistics and Economic Development
California Logistics and Economic Development
 

Similar to Usa gulf coast ports

Challenges in the oil and gas sector overview and outlook
Challenges in the oil and gas sector  overview and outlookChallenges in the oil and gas sector  overview and outlook
Challenges in the oil and gas sector overview and outlookdammygee
 
Crude energy-guide-to-oil-gas-investing
Crude energy-guide-to-oil-gas-investingCrude energy-guide-to-oil-gas-investing
Crude energy-guide-to-oil-gas-investingKolyo Dankov
 
Qnb group the US could become energy independent by 2030
Qnb group the US could become energy independent by 2030Qnb group the US could become energy independent by 2030
Qnb group the US could become energy independent by 2030QNB Group
 
ase for critical thinkingScenarioplanningatRoyalDu.docx
ase for critical thinkingScenarioplanningatRoyalDu.docxase for critical thinkingScenarioplanningatRoyalDu.docx
ase for critical thinkingScenarioplanningatRoyalDu.docxwildmandelorse
 
Marco sully perez on oil and gas extraction
Marco sully perez on oil and gas extractionMarco sully perez on oil and gas extraction
Marco sully perez on oil and gas extractionMarco Sully Perez
 
Case for critical thinkingScenarioplanningatRoyalD.docx
Case for critical thinkingScenarioplanningatRoyalD.docxCase for critical thinkingScenarioplanningatRoyalD.docx
Case for critical thinkingScenarioplanningatRoyalD.docxcowinhelen
 
Dismukes global brgs_presentation_08-16-10
Dismukes global brgs_presentation_08-16-10Dismukes global brgs_presentation_08-16-10
Dismukes global brgs_presentation_08-16-10Jordan Lane
 
Dismukes nabe presentation_08-10-10_v2
Dismukes nabe presentation_08-10-10_v2Dismukes nabe presentation_08-10-10_v2
Dismukes nabe presentation_08-10-10_v2Jordan Lane
 
Dismukes jones walker_banking_presentation_08-31-10
Dismukes jones walker_banking_presentation_08-31-10Dismukes jones walker_banking_presentation_08-31-10
Dismukes jones walker_banking_presentation_08-31-10Jordan Lane
 
NewBase 16 October 2023 Energy News issue - 1665 by Khaled Al Awadi_compres...
NewBase  16 October 2023  Energy News issue - 1665 by Khaled Al Awadi_compres...NewBase  16 October 2023  Energy News issue - 1665 by Khaled Al Awadi_compres...
NewBase 16 October 2023 Energy News issue - 1665 by Khaled Al Awadi_compres...Khaled Al Awadi
 
The Benefits of Hydraulic Fracturing
The Benefits of Hydraulic FracturingThe Benefits of Hydraulic Fracturing
The Benefits of Hydraulic FracturingRobert Edgar
 
Geopolitics in oil and gas market
Geopolitics in oil and gas marketGeopolitics in oil and gas market
Geopolitics in oil and gas marketAdjei Sephen
 
Dismukes ac meeting_09-09-10_corrected
Dismukes ac meeting_09-09-10_correctedDismukes ac meeting_09-09-10_corrected
Dismukes ac meeting_09-09-10_correctedJordan Lane
 

Similar to Usa gulf coast ports (20)

Challenges in the oil and gas sector overview and outlook
Challenges in the oil and gas sector  overview and outlookChallenges in the oil and gas sector  overview and outlook
Challenges in the oil and gas sector overview and outlook
 
Crude energy-guide-to-oil-gas-investing
Crude energy-guide-to-oil-gas-investingCrude energy-guide-to-oil-gas-investing
Crude energy-guide-to-oil-gas-investing
 
Oil Shale Economics
Oil Shale EconomicsOil Shale Economics
Oil Shale Economics
 
Qnb group the US could become energy independent by 2030
Qnb group the US could become energy independent by 2030Qnb group the US could become energy independent by 2030
Qnb group the US could become energy independent by 2030
 
OS-brochure-eng
OS-brochure-engOS-brochure-eng
OS-brochure-eng
 
ase for critical thinkingScenarioplanningatRoyalDu.docx
ase for critical thinkingScenarioplanningatRoyalDu.docxase for critical thinkingScenarioplanningatRoyalDu.docx
ase for critical thinkingScenarioplanningatRoyalDu.docx
 
Marco sully perez on oil and gas extraction
Marco sully perez on oil and gas extractionMarco sully perez on oil and gas extraction
Marco sully perez on oil and gas extraction
 
Case for critical thinkingScenarioplanningatRoyalD.docx
Case for critical thinkingScenarioplanningatRoyalD.docxCase for critical thinkingScenarioplanningatRoyalD.docx
Case for critical thinkingScenarioplanningatRoyalD.docx
 
Dismukes global brgs_presentation_08-16-10
Dismukes global brgs_presentation_08-16-10Dismukes global brgs_presentation_08-16-10
Dismukes global brgs_presentation_08-16-10
 
Dismukes nabe presentation_08-10-10_v2
Dismukes nabe presentation_08-10-10_v2Dismukes nabe presentation_08-10-10_v2
Dismukes nabe presentation_08-10-10_v2
 
Oil industry report
Oil industry reportOil industry report
Oil industry report
 
Invest in Oil Shale
Invest in Oil ShaleInvest in Oil Shale
Invest in Oil Shale
 
Dismukes jones walker_banking_presentation_08-31-10
Dismukes jones walker_banking_presentation_08-31-10Dismukes jones walker_banking_presentation_08-31-10
Dismukes jones walker_banking_presentation_08-31-10
 
Covering the Green Economy - The Future of Energy
Covering the Green Economy - The Future of EnergyCovering the Green Economy - The Future of Energy
Covering the Green Economy - The Future of Energy
 
North Dakota 2014
North Dakota  2014North Dakota  2014
North Dakota 2014
 
NewBase 16 October 2023 Energy News issue - 1665 by Khaled Al Awadi_compres...
NewBase  16 October 2023  Energy News issue - 1665 by Khaled Al Awadi_compres...NewBase  16 October 2023  Energy News issue - 1665 by Khaled Al Awadi_compres...
NewBase 16 October 2023 Energy News issue - 1665 by Khaled Al Awadi_compres...
 
The Benefits of Hydraulic Fracturing
The Benefits of Hydraulic FracturingThe Benefits of Hydraulic Fracturing
The Benefits of Hydraulic Fracturing
 
Geopolitics in oil and gas market
Geopolitics in oil and gas marketGeopolitics in oil and gas market
Geopolitics in oil and gas market
 
2012-27-e
2012-27-e2012-27-e
2012-27-e
 
Dismukes ac meeting_09-09-10_corrected
Dismukes ac meeting_09-09-10_correctedDismukes ac meeting_09-09-10_corrected
Dismukes ac meeting_09-09-10_corrected
 

Recently uploaded

办理学位证中佛罗里达大学毕业证,UCF成绩单原版一比一
办理学位证中佛罗里达大学毕业证,UCF成绩单原版一比一办理学位证中佛罗里达大学毕业证,UCF成绩单原版一比一
办理学位证中佛罗里达大学毕业证,UCF成绩单原版一比一F sss
 
Amazon TQM (2) Amazon TQM (2)Amazon TQM (2).pptx
Amazon TQM (2) Amazon TQM (2)Amazon TQM (2).pptxAmazon TQM (2) Amazon TQM (2)Amazon TQM (2).pptx
Amazon TQM (2) Amazon TQM (2)Amazon TQM (2).pptxAbdelrhman abooda
 
Indian Call Girls in Abu Dhabi O5286O24O8 Call Girls in Abu Dhabi By Independ...
Indian Call Girls in Abu Dhabi O5286O24O8 Call Girls in Abu Dhabi By Independ...Indian Call Girls in Abu Dhabi O5286O24O8 Call Girls in Abu Dhabi By Independ...
Indian Call Girls in Abu Dhabi O5286O24O8 Call Girls in Abu Dhabi By Independ...dajasot375
 
From idea to production in a day – Leveraging Azure ML and Streamlit to build...
From idea to production in a day – Leveraging Azure ML and Streamlit to build...From idea to production in a day – Leveraging Azure ML and Streamlit to build...
From idea to production in a day – Leveraging Azure ML and Streamlit to build...Florian Roscheck
 
Dubai Call Girls Wifey O52&786472 Call Girls Dubai
Dubai Call Girls Wifey O52&786472 Call Girls DubaiDubai Call Girls Wifey O52&786472 Call Girls Dubai
Dubai Call Girls Wifey O52&786472 Call Girls Dubaihf8803863
 
dokumen.tips_chapter-4-transient-heat-conduction-mehmet-kanoglu.ppt
dokumen.tips_chapter-4-transient-heat-conduction-mehmet-kanoglu.pptdokumen.tips_chapter-4-transient-heat-conduction-mehmet-kanoglu.ppt
dokumen.tips_chapter-4-transient-heat-conduction-mehmet-kanoglu.pptSonatrach
 
(PARI) Call Girls Wanowrie ( 7001035870 ) HI-Fi Pune Escorts Service
(PARI) Call Girls Wanowrie ( 7001035870 ) HI-Fi Pune Escorts Service(PARI) Call Girls Wanowrie ( 7001035870 ) HI-Fi Pune Escorts Service
(PARI) Call Girls Wanowrie ( 7001035870 ) HI-Fi Pune Escorts Serviceranjana rawat
 
Brighton SEO | April 2024 | Data Storytelling
Brighton SEO | April 2024 | Data StorytellingBrighton SEO | April 2024 | Data Storytelling
Brighton SEO | April 2024 | Data StorytellingNeil Barnes
 
Building on a FAIRly Strong Foundation to Connect Academic Research to Transl...
Building on a FAIRly Strong Foundation to Connect Academic Research to Transl...Building on a FAIRly Strong Foundation to Connect Academic Research to Transl...
Building on a FAIRly Strong Foundation to Connect Academic Research to Transl...Jack DiGiovanna
 
Schema on read is obsolete. Welcome metaprogramming..pdf
Schema on read is obsolete. Welcome metaprogramming..pdfSchema on read is obsolete. Welcome metaprogramming..pdf
Schema on read is obsolete. Welcome metaprogramming..pdfLars Albertsson
 
Kantar AI Summit- Under Embargo till Wednesday, 24th April 2024, 4 PM, IST.pdf
Kantar AI Summit- Under Embargo till Wednesday, 24th April 2024, 4 PM, IST.pdfKantar AI Summit- Under Embargo till Wednesday, 24th April 2024, 4 PM, IST.pdf
Kantar AI Summit- Under Embargo till Wednesday, 24th April 2024, 4 PM, IST.pdfSocial Samosa
 
VIP High Profile Call Girls Amravati Aarushi 8250192130 Independent Escort Se...
VIP High Profile Call Girls Amravati Aarushi 8250192130 Independent Escort Se...VIP High Profile Call Girls Amravati Aarushi 8250192130 Independent Escort Se...
VIP High Profile Call Girls Amravati Aarushi 8250192130 Independent Escort Se...Suhani Kapoor
 
Call Girls In Dwarka 9654467111 Escorts Service
Call Girls In Dwarka 9654467111 Escorts ServiceCall Girls In Dwarka 9654467111 Escorts Service
Call Girls In Dwarka 9654467111 Escorts ServiceSapana Sha
 
04242024_CCC TUG_Joins and Relationships
04242024_CCC TUG_Joins and Relationships04242024_CCC TUG_Joins and Relationships
04242024_CCC TUG_Joins and Relationshipsccctableauusergroup
 
VIP Call Girls Service Miyapur Hyderabad Call +91-8250192130
VIP Call Girls Service Miyapur Hyderabad Call +91-8250192130VIP Call Girls Service Miyapur Hyderabad Call +91-8250192130
VIP Call Girls Service Miyapur Hyderabad Call +91-8250192130Suhani Kapoor
 
EMERCE - 2024 - AMSTERDAM - CROSS-PLATFORM TRACKING WITH GOOGLE ANALYTICS.pptx
EMERCE - 2024 - AMSTERDAM - CROSS-PLATFORM  TRACKING WITH GOOGLE ANALYTICS.pptxEMERCE - 2024 - AMSTERDAM - CROSS-PLATFORM  TRACKING WITH GOOGLE ANALYTICS.pptx
EMERCE - 2024 - AMSTERDAM - CROSS-PLATFORM TRACKING WITH GOOGLE ANALYTICS.pptxthyngster
 
Industrialised data - the key to AI success.pdf
Industrialised data - the key to AI success.pdfIndustrialised data - the key to AI success.pdf
Industrialised data - the key to AI success.pdfLars Albertsson
 

Recently uploaded (20)

办理学位证中佛罗里达大学毕业证,UCF成绩单原版一比一
办理学位证中佛罗里达大学毕业证,UCF成绩单原版一比一办理学位证中佛罗里达大学毕业证,UCF成绩单原版一比一
办理学位证中佛罗里达大学毕业证,UCF成绩单原版一比一
 
VIP Call Girls Service Charbagh { Lucknow Call Girls Service 9548273370 } Boo...
VIP Call Girls Service Charbagh { Lucknow Call Girls Service 9548273370 } Boo...VIP Call Girls Service Charbagh { Lucknow Call Girls Service 9548273370 } Boo...
VIP Call Girls Service Charbagh { Lucknow Call Girls Service 9548273370 } Boo...
 
Amazon TQM (2) Amazon TQM (2)Amazon TQM (2).pptx
Amazon TQM (2) Amazon TQM (2)Amazon TQM (2).pptxAmazon TQM (2) Amazon TQM (2)Amazon TQM (2).pptx
Amazon TQM (2) Amazon TQM (2)Amazon TQM (2).pptx
 
꧁❤ Aerocity Call Girls Service Aerocity Delhi ❤꧂ 9999965857 ☎️ Hard And Sexy ...
꧁❤ Aerocity Call Girls Service Aerocity Delhi ❤꧂ 9999965857 ☎️ Hard And Sexy ...꧁❤ Aerocity Call Girls Service Aerocity Delhi ❤꧂ 9999965857 ☎️ Hard And Sexy ...
꧁❤ Aerocity Call Girls Service Aerocity Delhi ❤꧂ 9999965857 ☎️ Hard And Sexy ...
 
Indian Call Girls in Abu Dhabi O5286O24O8 Call Girls in Abu Dhabi By Independ...
Indian Call Girls in Abu Dhabi O5286O24O8 Call Girls in Abu Dhabi By Independ...Indian Call Girls in Abu Dhabi O5286O24O8 Call Girls in Abu Dhabi By Independ...
Indian Call Girls in Abu Dhabi O5286O24O8 Call Girls in Abu Dhabi By Independ...
 
From idea to production in a day – Leveraging Azure ML and Streamlit to build...
From idea to production in a day – Leveraging Azure ML and Streamlit to build...From idea to production in a day – Leveraging Azure ML and Streamlit to build...
From idea to production in a day – Leveraging Azure ML and Streamlit to build...
 
Dubai Call Girls Wifey O52&786472 Call Girls Dubai
Dubai Call Girls Wifey O52&786472 Call Girls DubaiDubai Call Girls Wifey O52&786472 Call Girls Dubai
Dubai Call Girls Wifey O52&786472 Call Girls Dubai
 
dokumen.tips_chapter-4-transient-heat-conduction-mehmet-kanoglu.ppt
dokumen.tips_chapter-4-transient-heat-conduction-mehmet-kanoglu.pptdokumen.tips_chapter-4-transient-heat-conduction-mehmet-kanoglu.ppt
dokumen.tips_chapter-4-transient-heat-conduction-mehmet-kanoglu.ppt
 
(PARI) Call Girls Wanowrie ( 7001035870 ) HI-Fi Pune Escorts Service
(PARI) Call Girls Wanowrie ( 7001035870 ) HI-Fi Pune Escorts Service(PARI) Call Girls Wanowrie ( 7001035870 ) HI-Fi Pune Escorts Service
(PARI) Call Girls Wanowrie ( 7001035870 ) HI-Fi Pune Escorts Service
 
Brighton SEO | April 2024 | Data Storytelling
Brighton SEO | April 2024 | Data StorytellingBrighton SEO | April 2024 | Data Storytelling
Brighton SEO | April 2024 | Data Storytelling
 
Building on a FAIRly Strong Foundation to Connect Academic Research to Transl...
Building on a FAIRly Strong Foundation to Connect Academic Research to Transl...Building on a FAIRly Strong Foundation to Connect Academic Research to Transl...
Building on a FAIRly Strong Foundation to Connect Academic Research to Transl...
 
Schema on read is obsolete. Welcome metaprogramming..pdf
Schema on read is obsolete. Welcome metaprogramming..pdfSchema on read is obsolete. Welcome metaprogramming..pdf
Schema on read is obsolete. Welcome metaprogramming..pdf
 
Kantar AI Summit- Under Embargo till Wednesday, 24th April 2024, 4 PM, IST.pdf
Kantar AI Summit- Under Embargo till Wednesday, 24th April 2024, 4 PM, IST.pdfKantar AI Summit- Under Embargo till Wednesday, 24th April 2024, 4 PM, IST.pdf
Kantar AI Summit- Under Embargo till Wednesday, 24th April 2024, 4 PM, IST.pdf
 
VIP High Profile Call Girls Amravati Aarushi 8250192130 Independent Escort Se...
VIP High Profile Call Girls Amravati Aarushi 8250192130 Independent Escort Se...VIP High Profile Call Girls Amravati Aarushi 8250192130 Independent Escort Se...
VIP High Profile Call Girls Amravati Aarushi 8250192130 Independent Escort Se...
 
Call Girls in Saket 99530🔝 56974 Escort Service
Call Girls in Saket 99530🔝 56974 Escort ServiceCall Girls in Saket 99530🔝 56974 Escort Service
Call Girls in Saket 99530🔝 56974 Escort Service
 
Call Girls In Dwarka 9654467111 Escorts Service
Call Girls In Dwarka 9654467111 Escorts ServiceCall Girls In Dwarka 9654467111 Escorts Service
Call Girls In Dwarka 9654467111 Escorts Service
 
04242024_CCC TUG_Joins and Relationships
04242024_CCC TUG_Joins and Relationships04242024_CCC TUG_Joins and Relationships
04242024_CCC TUG_Joins and Relationships
 
VIP Call Girls Service Miyapur Hyderabad Call +91-8250192130
VIP Call Girls Service Miyapur Hyderabad Call +91-8250192130VIP Call Girls Service Miyapur Hyderabad Call +91-8250192130
VIP Call Girls Service Miyapur Hyderabad Call +91-8250192130
 
EMERCE - 2024 - AMSTERDAM - CROSS-PLATFORM TRACKING WITH GOOGLE ANALYTICS.pptx
EMERCE - 2024 - AMSTERDAM - CROSS-PLATFORM  TRACKING WITH GOOGLE ANALYTICS.pptxEMERCE - 2024 - AMSTERDAM - CROSS-PLATFORM  TRACKING WITH GOOGLE ANALYTICS.pptx
EMERCE - 2024 - AMSTERDAM - CROSS-PLATFORM TRACKING WITH GOOGLE ANALYTICS.pptx
 
Industrialised data - the key to AI success.pdf
Industrialised data - the key to AI success.pdfIndustrialised data - the key to AI success.pdf
Industrialised data - the key to AI success.pdf
 

Usa gulf coast ports

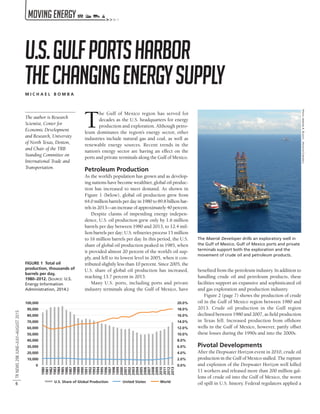
  • 1. TRNEWS298JUNE–JULY–AUGUST2015 6 The author is Research Scientist, Center for Economic Development and Research, University of North Texas, Denton, and Chair of the TRB Standing Committee on International Trade and Transportation. T he Gulf of Mexico region has served for decades as the U.S. headquarters for energy production and exploration. Although petro- leum dominates the region’s energy sector, other industries include natural gas and coal, as well as renewable energy sources. Recent trends in the nation’s energy sector are having an effect on the ports and private terminals along the Gulf of Mexico. Petroleum Production As the world’s population has grown and as develop- ing nations have become wealthier, global oil produc- tion has increased to meet demand. As shown in Figure 1 (below), global oil production grew from 64.0 million barrels per day in 1980 to 89.8 billion bar- rels in 2013—an increase of approximately 40 percent. Despite claims of impending energy indepen- dence, U.S. oil production grew only by 1.6 million barrels per day between 1980 and 2013, to 12.4 mil- lion barrels per day; U.S. refineries process 15 million to 16 million barrels per day. In this period, the U.S. share of global oil production peaked in 1985, when it provided almost 20 percent of the world’s oil sup- ply, and fell to its lowest level in 2005, when it con- tributed slightly less than 10 percent. Since 2005, the U.S. share of global oil production has increased, reaching 13.7 percent in 2013. Many U.S. ports, including ports and private industry terminals along the Gulf of Mexico, have benefited from the petroleum industry. In addition to handling crude oil and petroleum products, these facilities support an expansive and sophisticated oil and gas exploration and production industry. Figure 2 (page 7) shows the production of crude oil in the Gulf of Mexico region between 1980 and 2013. Crude oil production in the Gulf region declined between 1980 and 2007, as field production in Texas fell. Increased production from offshore wells in the Gulf of Mexico, however, partly offset these losses during the 1990s and into the 2000s. Pivotal Developments After the Deepwater Horizon event in 2010, crude oil production in the Gulf of Mexico stalled. The rupture and explosion of the Deepwater Horizon well killed 11 workers and released more than 200 million gal- lons of crude oil into the Gulf of Mexico, the worst oil spill in U.S. history. Federal regulators applied a U.S.GulfPortsHarbor theChangingEnergySupplyM I C H A E L B O M B A 0.0% 2.0% 4.0% 6.0% 8.0% 10.0% 12.0% 14.0% 16.0% 18.0% 20.0% 0 10,000 20,000 30,000 40,000 50,000 60,000 70,000 80,000 90,000 100,000 1980 1981 1982 1983 1984 1985 1986 1987 1988 1989 1990 1991 1992 1993 1994 1995 1996 1997 1998 1999 2000 2001 2002 2003 2004 2005 2006 2007 2008 2009 2010 2011 2012 2013 U.S. Share of Global Production United States World FIGURE 1 Total oil production, thousands of barrels per day, 1980–2012. (SOURCE: U.S. Energy Information Administration, 2014.) The Maersk Developer drills an exploratory well in the Gulf of Mexico. Gulf of Mexico ports and private terminals support both the exploration and the movement of crude oil and petroleum products. PHOTO:JENNIFERA.DLOUHY,HOUSTONCHRONICLE >>>>
  • 2. TRNEWS298JUNE–JULY–AUGUST2015 7 higher level of scrutiny to offshore drilling and main- tained a moratorium on deepwater drilling permits. These responses effectively capped Gulf oil produc- tion for several years. Before the Deepwater Horizon disaster, offshore drilling in the U.S. Gulf accounted for 25 to 30 per- cent of total U.S. production. But while stricter over- sight constrained offshore drilling, the shale plays in Texas were beginning to ramp up production— notably the Eagle Ford shale play in South Texas, the Permian Basin shale play in West Texas, and the Bar- nett shale play in the Dallas–Fort Worth region of North Texas. The Eagle Ford wells, in particular, produce a large amount of crude oil and condensate, in addition to natural gas. By 2013, Texas’s rapidly growing field production of crude oil reduced the Gulf of Mexico’s offshore share to less than 17 percent of total U.S. oil production. Petroleum Exploration Gulf ports are the nexus of U.S. landside and offshore petroleum exploration and production activities, which require the movement of heavy equipment, consumables, work crews, and extracted product. For offshore drilling, all of these activities go through ports or private terminals. West of Florida, the con- struction, maintenance, and mooring of offshore drilling platforms, as well as offshore servicing ves- sels, are common sights at ports and private termi- nals. Offshore platforms usually transport cargoes to shore via pipelines, although some facilities, like the Cayo Arcas terminal in Mexico, load the crude oil directly into tankers. With the lifting of the morato- rium on new drilling in the Gulf of Mexico, several major deepwater projects are moving forward, pro- viding continuing opportunities for Gulf ports. Landside oil and gas exploration and production in the shale plays has generated significant volumes of new cargoes for Gulf ports, especially for con- sumables like sand and pipe. Hydraulic fracturing requires a special type of sand, which is mixed with water and chemicals and forced underground at high pressures to extract the gas and oil. The grains of sand must have the right dimensions; as a result, the sand often is transported considerable distances to the drilling sites. All oil wells require pipe casing to line the bore hole, but hydraulic fracturing wells run deep in the ground and extend horizontally for significant dis- tances, requiring a lot of pipe. Pipelines are the pre- ferred mode for transporting the crude oil from the wells to the refineries, but when pipelines are not close by or may not have sufficient capacity, the crude may travel by railway tank car or by tanker truck to the pipeline network—or by barge directly to the refineries. The Eagle Ford shale play, for exam- ple, has increased barge traffic on the Gulf Intra- coastal Waterway. Crude Oil Approximately half of the nation’s annual total of foreign waterborne commerce is handled at ports and private marine terminals in the Gulf of Mexico, and a large share of that cargo is crude oil. During 2012, ports and private terminals along the Gulf of Mexico handled almost 208 million tons of crude oil, with almost 93 percent at locations west of the Mis- sissippi River (see Figure 3, page 8). Between 2008 and 2012, the volume of crude oil handled in the Gulf declined by 21 million tons or 9.2 percent. Three factors influenced this trend. First, personal vehicles continued to gain fuel efficiency. Second, total vehicle miles traveled in the United States have declined. Third, domestic oil production from shale plays is replacing imported crude oil. 0 500 1,000 1,500 2,000 2,500 3,000 3,500 4,000 4,500 Alabama Field Production Louisiana Field Production Mississippi Field Production Texas Field Production Gulf of Mexico Production Crude oil–filled barges travel the Gulf Intracoastal Waterway, which has experienced increased traffic from hydraulic fracturing activity in Texas shale plays. PHOTO:U.S.COASTGUARD FIGURE 2 Crude oil production in the Gulf of Mexico region. (SOURCE: U.S. Energy Information Administration, 2014.)
  • 3. TRNEWS298JUNE–JULY–AUGUST2015 8 This last trend is evident in the share of domestic oil handled at Gulf ports (Figure 4, below). During 2008, less than 4.0 percent of crude oil handled at Gulf ports originated from a domestic port, but by 2012, that figure had risen to 10 percent and will likely increase for 2013 and 2014. When the crude oil arrives onshore, refineries render it into gasoline, diesel, and other petroleum products or into feedstocks for the petrochemical industry. Table 1 (right) shows that the United States has the capacity to refine almost 18 million barrels of crude oil per day. The states along the Gulf of Mexico provide almost half—49.8 percent—of that capacity. Texas provides almost 29 percent of the nation’s oil refinery capacity, followed by Louisiana at 18.3 percent; the remaining U.S. Gulf states provide less than 3 percent: Missis- sippi, 2.0 percent; Alabama 0.7 percent; and Florida, less than one-tenth of 1 percent. The various fuels produced are transported to local distribution centers through pipelines or by tanker or barge. Although the volume of crude oil imported by Gulf ports and private terminals between 2008 and 2012 fell by 9.2 percent—the decline nationwide was more than 25.5 percent—Gulf maritime facilities are handling larger and larger volumes of outbound petroleum products, mostly at ports and private ter- minals in the Western Gulf. Between 2008 and 2012, this volume grew by 41.3 million tons or 32.6 per- cent. The trend suggests that pipelines increasingly are feeding these refineries with domestically pro- duced crude oil. Natural Gas Hydraulic fracturing also has increased the production of natural gas in the United States. Between 2006 and 2013, U.S. production of natural gas increased by 27.5 percent or almost 6.5 million cubic feet (MMcf or 1,027,000,000 Btu; see Figure 5, page 9). Consump- tion also has grown, as natural gas replaces coal for generating electric power and as the petrochemical industry takes advantage of the cheap feedstock. The export of natural gas has increased, although modestly. In 2013, approximately 5 percent of U.S.- produced natural gas was exported, almost entirely to Mexico and Canada. Most of the nation’s supply of natural gas remains in the domestic market, keep- ing natural gas prices in the United States low. Logically, producers would want to export natural gas to countries with higher prices. Table 2 (page 9) shows the price for liquefied natural gas (LNG) in Lake Charles, Louisiana, compared with the prices in locations around the world. Although the price of LNG has declined in the past year, the global price dif- 0 20 40 60 80 100 120 140 160 180 2008 2009 2010 2011 2012 TonsofPetroleumProducts(millions) West Gulf Coast East Gulf Coast 0 50 100 150 200 250 2008 2009 2010 2011 2012 TonsofCrudeOil(millions) West Gulf Coast East Gulf Coast FIGURE 3 Tonnage of crude oil offloaded at U.S. Gulf ports and private terminals, 2008–2012. (SOURCE: U.S. Army Corps of Engineers, 2014.) FIGURE 4 Tonnage of petroleum products originating from U.S. Gulf ports and private terminals, 2008–2012. (SOURCE: U.S. Army Corps of Engineers, 2014.) TABLE 1 U.S. Refinery Capacity for Selected States, as of January 1, 2014 Barrels per Production Rank Location Calendar Day (%) 1 Texas 5,174,209 28.9 2 Louisiana 3,274,520 18.3 3 California 1,960,671 10.9 4 Illinois 958,645 5.3 5 Washington 631,700 3.5 6 Pennsylvania 596,000 3.3 7 Ohio 530,000 3.0 8 Oklahoma 523,300 2.9 9 New Jersey 468,000 2.6 10 Indiana 440,600 2.5 11 Mississippi 364,000 2.0 12 Minnesota 359,500 2.0 Remainder of the United States 2,643,485 14.7 Total United States 17,924,630 100.0 Total U.S. Gulf Coast Capacitya 8,108,826 45.2 a Only includes refineries located directly on the Gulf Coast. SOURCE: U.S. Energy Information Administration, 2014.
  • 4. TRNEWS298JUNE–JULY–AUGUST2015 9 ferential with the Lake Charles price ranged from $4.54 to $13.06 per million Btu as of December 2014. The difficulty of exporting natural gas relates pri- marily to its transportation. Pipeline is the optimal mode, but the natural gas pipelines between the United States and Mexico or Canada are limited. Sell- ing in more distant markets requires that the gas be liquefied by chilling to Ϫ162°C (Ϫ260°F). Lique- faction allows further compression, so that the gas can be loaded onto LNG tankers for export. This process requires a special facility; the United States currently has none. As of December 2014, however, four LNG export terminals have received approval—three are in the Gulf of Mexico: in Sabine and Hackberry, Louisiana, and Freeport, Texas—and 10 others are planned along the Gulf Coast. Export terminals for LNG cost several billion dollars to construct, and the federal permitting process is rigorous. Another difficulty is that the draft of most LNG tanker vessels is deep; more than 90 percent cannot fit into the locks of the Panama Canal. With the Panama Canal’s expansion, however, approximately 90 percent of the world’s fleet will be able to fit. Many in the shipping and petroleum industry anticipate that the liquefaction plants and the expanded Panama Canal will make LNG a significant export commodity from the Gulf of Mexico. Coal Coal is another source of fossil energy handled at ports and private terminals in the Gulf region. Figure FIGURE 5 U.S. withdrawals and production of natural gas (MMcf), 1980–2013. (SOURCE: U.S. Energy Information Administration, 2014.) Oil drilling rig on the Barnett Shale near Alvarado, Texas. Most domestically produced crude oil stays in the United States. PHOTO:DAVIDR.TRIBBLE 0% 1% 2% 3% 4% 5% 6% 0 5 10 15 20 25 30 35 2012 2011 2010 2009 2008 2007 2006 2005 2004 2003 2002 2001 1999 1998 1997 1996 1995 1994 1993 1992 1991 1990 1989 1988 1987 1986 1985 1984 1983 1982 1981 1980 ShareofProductionExported U.S.NaturalGasWithdrawals (millionsofcubicfeet) Percentage Exported U.S. Gas Gross Withdrawals (MMcf) TABLE 2 Estimated World LNG Landed Prices: November 2013 and December 2014 (US$/MMBtu) November December Differential with 2013–2014 Location 2013 2014 Lake Charles Difference Canaport, Canada NA $16.78 $13.06 NA Altamira, Mexico $16.40 $11.54 $7.82 -$4.86 Rio de Janeiro, Brazil $14.65 $11.35 $7.63 -$3.30 Bahia Blanca, Argentina $15.65 $11.78 $8.06 -$3.87 United Kingdom $10.66 $8.56 $4.84 -$2.10 Belgium $10.40 $8.26 $4.54 -$2.14 Spain $10.90 $9.76 $6.04 -$1.14 Korea $15.65 $12.00 $8.28 -$3.65 India $13.75 $11.45 $7.73 -$2.30 Japan $15.65 $12.00 $8.28 -$3.65 China $15.25 $11.60 $7.88 -$3.65 Lake Charles, La. $3.15 $3.72 — $0.57 NOTE: NA = not available. SOURCE: Waterborne Energy, Inc., 2013 and 2014.
  • 5. TRNEWS298JUNE–JULY–AUGUST2015 10 6 (above) shows the volume of U.S. coal exports handled within U.S. customs districts, large regions that include multiple ports and terminals. These fig- ures show that coal exports from the Gulf region rose sharply between 2009 and 2012, from 12.8 mil- lion to 41.6 million tons, but dropped 14.2 percent to 35.7 million tons between 2012 and 2013. Coal exports from the Gulf region comprised 30.1 percent of the U.S. total in 2013. The majority of the coal, however, did not go to Asia, despite China’s heavy use of coal for energy production. The cus- tomers for 51.3 percent of U.S. export coal were the nations of Europe; China received only 7.0 percent; moreover, the Chinese government recently com- mitted to cap coal use by 2020. Major coal exporting facilities in the Gulf of Mex- ico are located within or near the Ports of Houston, Texas; New Orleans, Louisiana; and Mobile, Alabama. As in the Pacific Northwest, environmen- tal groups have worked to prevent the construction of new coal export terminals. Although opponents emphasize the local effects of the terminals, climate change is usually the main concern. Three terminals proposed in Corpus Christi, Texas, were canceled because of market uncertainties but also came under scrutiny from environmental groups. The Port of Mobile, which receives approx- imately two-thirds of its revenue from coal exports, is considering a $140 million expansion near a coal terminal. Coal imports, in contrast, fell from 10.7 million tons in 2009 to 4.1 million tons in 2013 (Figure 7, below left). The Mobile customs district lost a large volume of cargo; the Tampa, Florida, customs district also experienced losses. The drop in coal imports from the Gulf region reflects a national trend. Wind Renewable energy—namely wind—has played an important role in the cargo mix for some Gulf ports for a decade or more. The United States has only a few wind turbine manufacturing facilities—many of the nation’s wind turbines are manufactured over- seas. Imported wind turbines must travel a portion of their trip by water, moving in parts from the man- ufacturer to final assembly. Typically, a disassembled windmill arrives as seven or more major components: three blades, three or more tower sections, and the nacelle, which con- tains the generator mounted at the top of the wind turbine. The blades typically range in length from 105 to 160 feet, and the assembled tower sections range from 100 to 150 feet in height. The nacelle is roughly the size of a city bus. After these components are offloaded from ships, they travel by truck and sometimes by rail as oversize movements to the places of installation. Texas ports handle most of the wind turbine car- goes in the Gulf of Mexico. Texas and some areas of western, coastal Louisiana are the only locations in the Gulf region with wind conditions to support energy production. According to the U.S. Depart- 0% 5% 10% 15% 20% 25% 30% 35% 0 5 10 15 20 25 30 35 40 45 2009 2010 2011 2012 2013 ShareofU.S.Total TonsofCoal(millions) Tampa Houston–Galveston Mobile New Orleans Gulf Region’s Share of Total 0.0% 10.0% 20.0% 30.0% 40.0% 50.0% 60.0% 0.0 2.0 4.0 6.0 8.0 10.0 12.0 2009 2010 2011 2012 2013 ShareofU.S.Total TonsofCoal(millions) Houston–Galveston New Orleans Tampa Mobile Gulf Region’s Share of Total FIGURE 6 U.S. coal exports by U.S. Customs districts along the Gulf of Mexico. (SOURCE: U.S. Energy Information Administration, 2014.) FIGURE 7 U.S. coal imports by U.S. Customs districts along the Gulf of Mexico. (SOURCE: U.S. Energy Information Administration, 2014.) PHOTO:LANCEANDERIN,FLICKR Coal exports from the Gulf more than tripled between 2009 and 2012, topping 41 million tons, but by 2013 decreased to 35.7 million tons.
  • 6. TRNEWS298JUNE–JULY–AUGUST2015 11 ment of Energy, Texas is the only U.S. Gulf state that produces wind power and ranks first among all states in wind power capacity, with 12,354 megawatts (MW) at the end of 2013; California ranks second, with 5,829 MW. Energy production from wind power relies on a federal tax credit to make many projects financially viable. A federal tax credit of $0.023 per kilowatt- hour produced in the first 10 years of a wind project expired in 2014. The loss of this tax credit could reduce—if not eliminate—the installation of wind turbines in the United States. In addition, offshore wind farms in the Gulf of Mexico are under proposal, with a total capacity of 4,371 MW; none of the facilities listed in Table 3, however, has been built. Except for one in Louisiana, all of the proposed offshore wind farms are in Texas. The Port of Corpus Christi has become a renew- able energy producer. The port took advantage of its location along the Gulf Coast, its abundant land holdings, and the almost constant winds in the area to install six 1.5-MW wind turbines. Wood Pellets Wood pellets are another sustainable energy source moving through Gulf ports. The vitamin-sized wood waste products are burned to generate electricity. Burning coal or natural gas releases carbon dioxide (CO2) that was sequestered underground; in con- trast, the CO2 in wood pellets, like that from other biomass sources, is released by natural decomposi- tion; therefore the net effect of the emissions is con- sidered close to zero. Wood pellets are in demand in Europe, where the European Union has mandated production of 20 percent of electricity from renewable energy sources. Because the pellets can be mixed with coal, utility operators do not need to retrofit power plants. Envi- ronmental advocacy groups, however, are concerned that the demand for wood pellets may encourage deforestation. Many ports along the Gulf of Mexico already han- dle wood products from the timber industry of the Southeastern United States; wood pellets have become one more commodity in the mix, particu- larly at ports from the Florida Panhandle to Port Arthur, Texas. As many states or utilities seek to sub- stitute biomass fuels for coal, the wood pellet indus- try is expected to continue growing. Future Trends A variety of factors, including channel deepening and navigational improvements, fluctuating oil prices, cli- mate change, and the opening of the Mexican petro- leum industry to private investment, will influence the near- and long-term future of ports and private ter- minals in the Gulf of Mexico and their role in the energy sector. Channel Projects The Water Resources Reform and Development Act of 2014 (WRRDA) has moved several significant chan- nel projects important to the energy industry closer to construction. The projects in Texas include the $1.1 billion Sabine-Neches Waterway project, the $239 mil- lion Freeport Harbor Channel project, and the $353 million Corpus Christi Channel project, each serving a major activity center for the oil and gas industry. WRRDA also sets aside $50 million dollars of dis- cretionary funding for “energy transfer ports.” These U.S. Customs ports must have handled at least 40 mil- lion tons of cargo during FY 2012, and energy com- modities must have comprised at least 25 percent of the tonnage. Although the need for port and naviga- TABLE 3 Proposed Offshore Wind Farms in the Gulf of Mexico State Project Name Generating Capacity (MW) Louisiana Vermillion Bay 36 Texas Jefferson Offshore 300 Texas Galveston Offshore Wind Farm 150 Texas Galveston Offshore Wind Farm 2 150 Texas Galveston Test 3 Texas Brazoria Offshore 500 Texas Titan Platform 7 Texas Mustang Island Offshore Wind Farm 1,200 Texas Rio Grande North 1,000 Texas Rio Grande South 1,000 Texas Texas Offshore Pilot Research Project 25 TOTAL 4,371 NOTE: MW = megawatts = 1,000,000 watts. SOURCE: OpenEI, 2014. Many wind turbine parts are manufactured overseas, delivered to Gulf ports, and shipped by truck or rail—often as oversize loads—for assembly onsite. PHOTO:J.BREW,FLICKR
  • 7. TRNEWS298JUNE–JULY–AUGUST2015 12 tion improvements outstrips the supply of public funding, the WRRDA will address some of the nation’s most urgently needed improvements for the energy sector. Oil Prices The refining side of the petroleum industry is relatively stable, but the exploration and production side faces intrinsic instability and risk. These instabilities lead to price fluctuations and production booms and busts. Petroleum prices often produce countervailing impacts on the economy—higher prices can encour- age oil exploration and drilling but also discourage driving, reduce household incomes, and raise business costs. Lower gasoline prices, usually seen as positive for the economy, can diminish economic activity related to exploration and drilling. Historically, Gulf ports serving the energy industry have benefited from higher prices, which encourage more offshore exploration and production. More recently, the growth in hydraulic fracturing has led to the handling of more fracking sand, pipes, heavy equipment, and crude oil. In contrast, prices that are too high can reduce the volume of crude oil imported for refinement into gasoline, distillates, and other products. Even with higher prices, the demand for gasoline is fairly inelastic, and the number of refineries is rela- tively fixed—reduced production therefore has rela- tively small impacts on employment. The demand for exploration and drilling activities, however, is highly elastic and responds strongly to prices, generating or contracting significant ancillary employment. Offshore drilling and hydraulic fracturing are expensive methods of extracting oil, and the viability correlates strongly with the price of oil. In December 2014, for example, oil was approximately $60 per bar- rel, down from more than $100 dollars a barrel at midyear and with predictions of prices in the range of $40 to $45. The high cost of extracting oil by hydraulic fracturing and from the Canadian tar sands can make some sources of oil and gas no longer financially viable. Industry experts have estimated that the Eagle Ford shale wells can operate profitably in the range of $40 to $60 per barrel, but the Permian Basin shale play requires between $59 and $82 per barrel to break even. Canadian tar sands need prices at $90 per barrel or more to cover operating costs. As prices drop, explo- ration and production will diminish, and the volume of related crude oil, equipment, and consumables han- dled at Texas ports will drop. Climate Change Although the global response to climate change has been lackluster, the long-term effects and conse- quences are yet to come. Fossil fuels play a significant role in climate change; the world may be forced to rely less on fossil fuels and more on renewable energy sources. These changes may be decades away but An exploratory drillship on the Gulf of Mexico. In general, demand for oil exploration rises and falls with oil prices. In 2012 the Port of Corpus Christi constructed six wind turbines along Nueces Bay in Texas—the first wind farm located on industrial port property in the country. PHOTO:KM&G-MORRIS,FLICKR PHOTO:JESSESAMU,PORTCORPUSCHRISTIAUTHORITY
  • 8. TRNEWS298JUNE–JULY–AUGUST2015 13 likely will curtail or end many of the activities related to fossil fuels in the Gulf of Mexico. Current and potentially new sources of renewable energy will become more prominent in port activities, but their economic footprint is unlikely to be as large as that of the fossil fuel industries today. Mexico’s Oil Industry In December 2013, Mexico’s Congress and Executive Branch approved a constitutional amendment that would allow private-sector investment in the explo- ration and production of the nation’s oil and gas reserves. The amendment can induce significant investment of foreign capital into Mexico’s petroleum industry.PetróleosMexicanos,orPEMEX,thenational oil corporation, needs foreign investment, technical expertise, and technologically advanced drilling equip- ment to maximize the exploitation of current fields and to drill in new oil fields and gas plays. Northern Mexico—notably the Burgos shale basin near the Texas border—may contain large shale gas formations comparable in scale to the Eagle Ford shale play. U.S. firms looking to expand operations or to redeploy underutilized or idle drilling equipment will likely consider sending their equipment into Mexico. Other potential impacts to the Texas transportation system include servicing the expanded drilling in Mexico’s territorial waters in the Gulf—such as the 200-mile Exclusive Economic Zone—and shipping oil and gas from Mexico to Texas for additional pro- cessing. These movements could generate substantial freight volumes, consisting of heavy oil field equip- ment and other materials, such as pipes, from Texas into Mexico, as well as petroleum products from Northern Mexico into Texas. U.S. Gulf ports and pri- vate terminals—particularly those west of the Missis- sippi River—are likely to see increased freight volumes related to activities in Mexico. Critical Role and Challenges The critical role of Gulf ports in the nation’s energy sec- tor is expected to continue. A return to deepwater off- shore drilling in the Gulf of Mexico, the continuation of hydraulic fracturing in shale plays around the coun- try, and the opening of the Mexican petroleum indus- try to foreign investment will drive demand for the services provided by Gulf ports and private terminals. Inaddition,navigationimprovementsthroughWRRDA andthecompletedexpansionofthePanamaCanalwill make LNG a feasible U.S. export commodity. Fluctuations in the price of oil, however, will chal- lenge growth in the petroleum industry. The produc- tion of energy by renewable sources also will continue to have an important role at Gulf ports, although not likely to replace fossil fuels in the short to medium term. Renewable sources typically are more expen- sive and are not able to provide energy on the scale necessary to maintain current levels of consumption. Over the longer term, the consequences of climate change may become too great to ignore, and the reliance on fossil fuels will have to be scaled back. The economic consequences of this shift likely will mean a contraction of the fossil fuel sector, affecting eco- nomic activity in the Gulf region. Resources Dunn, S. Fracking 101: Breaking Down the Most Important Part of Today’s Oil, Gas Drilling. Greeley Tribune. January 5, 2014. www.greeleytribune.com/news/9558384-113/ drilling-oil-equipment-wellbore. Gold, R. Wood Pellets Catch Fire as Renewable Energy Source. Wall Street Journal, July 7, 2009. www.wsj.com/articles/ SB124691728110402383. Krauss, C. U.S. Coal Companies Scale Back Export Goals. New York Times, September 13, 2013. www.nytimes.com/2013/ 09/14/business/energy-environment/us-coal-companies- scale-back-export-goals.html?pagewanted=all&_r=0. Nunez, C. The Energy Boom You Haven’t Heard About: Wood Pellets. National Geographic. http://news.national geographic.com/news/energy/2014/12/141208-wood- pellet-energy-boom-driven-by-exports/. Nussbaum, A. Wind Power Tax Credit “Dead” in Congress This Year. Bloomberg, March 11, 2014. www.bloomberg. com/news/2014-03-11/wind-power-tax-credit-dead-in- congress-this-year.html. Plumer, B. How Far Do Oil Prices Have to Fall to Throttle the U.S. Shale Boom? Vox. www.vox.com/2014/12/3/7327147/ oil-prices-breakeven-shale. Shaw, J. Gulf Coast Ports Look Beyond the Box. Pacific Mar- itime Magazine, Vol. 32. No. 6, June 2014. www.pacmar. com/story/2014/06/01/features/gulf-coast-ports-look- beyond-the-box/255.html. Wong, E. In Step to Lower Carbon Emissions, China Will Place a Limit on Coal Use in 2020. New York Times, November 20, 2014. www.nytimes.com/2014/11/21/ business/energy-environment/china-to-place-limit-on- coal-use-in-2020.html. The Discoverer Enterprise and other vessels continued to recover oil from the site for months after the Deepwater Horizon explosion in 2010. PHOTO:BOBLAURA,U.S.COASTGUARD