
Recommended
Recommended
More Related Content
What's hot
What's hot (20)
Similar to English 8 Q2 WK1.pptx
Similar to English 8 Q2 WK1.pptx (20)
Recently uploaded
Recently uploaded (20)
English 8 Q2 WK1.pptx
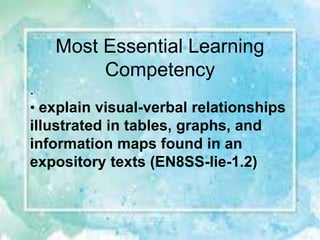
- 1. Most Essential Learning Competency . • explain visual-verbal relationships illustrated in tables, graphs, and information maps found in an expository texts (EN8SS-Iie-1.2)
- 2. At the end of this lesson, you should be able to: a. define expository text b. enumerate and explain the text features found in an expository text; and c. interpret graphics in an expository text
- 3. Let’s have a review! 1. Which of the following is the correct definition of an Adjective? a. It is a word that expresses a state of being b. It is a word that expresses strong obligation c. It is a word that describes nouns and pronouns
- 4. 2. The words below are adjectives that express positive feeling, except _______. a. anxious b. carefree c. inspired
- 5. 3. Which of the following verbs express strong obligation? a. am b. dislike c. must 4. Which among the adverbs below expresses unhappiness because of failing to meet expectations? a. disappointingly b. unexpectedly c. unluckily
- 6. 5. Which among the sentences below use a linking verb that helps express an opinion. a. You are brave enough to tell what you truly feel. b. You should talk to the guidance counselor when you feel sad. c. You must submit your resignation letter tomorrow.
- 9. Most Essential Learning Competency . • explain visual-verbal relationships illustrated in tables, graphs, and information maps found in an expository texts (EN8SS-Iie-1.2)
- 10. At the end of this lesson, you should be able to: • interpret textual aids in expository text; and • create and present using a textual aid from the given expository • enumerate and explain other textual aids such as venn diagram, flowchart and infographics;
- 11. It is a text feature emphasizing relationships between elements of some space, such as objects, regions, or themes. a. Graph b. Map c. Venn Diagram
- 12. It is a graphical representation typically arranged in rows and columns, or possibly in a more complex structure. a. Graph b. Map c. Venn Diagram
- 13. It is a graphical representation for data visualization, in which "the data is represented by symbols, such as bars in a bar chart, lines in a line chart, or slices in a pie chart". a. Graph b. Map c. Chart
- 14. What is expository text? It presents facts and information on specific topic. Expository texts are designed to explain, inform or describe.
- 15. Why do authors use graphics in expository text? Authors use graphics to help readers understand the concept presented.
- 16. Ways to interpret graphics in expository text? .
- 17. 1. INFOGRAPHICS Are graphic visual representations of information, data, or knowledge intended to present information quickly and clearly. They can improve cognition by utilizing graphics to enhance the human visual system's ability to see patterns and trends.
- 18. 2. Diagrams A diagram is a drawing, image, or sketch that is used to help the reader visualize what the author is describing in the text. There are certain components that diagrams must help the reader understand them and the text. HERE are examples of Diagram.
- 19. Venn diagram When one substance dissolves into another, a solution is formed. A solution is a homogeneous mixture consisting of a solute dissolved into a solvent . The solute is the substance that is being dissolved, while the solvent is the dissolving medium. Solutions can be formed with many different types and forms of solutes and solvents.
- 20. A solute is the material present in the smaller amount in the solution while a solvent is the material present in the larger amount in the solution. The boiling point of solute is higher than solvent
- 21. Solve using the PEMDAS Rule 225 ÷ 15 + 14 × 5 – 128 ÷ 16 + 25 Solution: First we carry out the divisions (colored in red) 225 ÷ 15 + 14 × 5 – 128 ÷ 16 + 25 15 + 14 × 5 – 8 + 25 Next, we multiply (colored in green) 15 + 14 × 5 – 8 + 25 15 + 70 – 8 + 25 Now, we will workout addition (colored in blue) 15 + 70 – 8 + 25 15 + 70 + 25 – 8 110 – 8 And then finally subtraction (colored in yellow) 110 – 8 = 102 Thus, 225 ÷ 15 + 14 × 5 – 128 ÷ 16 + 25 = 102
- 24. Braden (1983) coined the terms visual- verbal symbiosis and visual-verbal discontinuity. Dwyer (1988) found a symbiotic relationship between verbal and visual literacy when the two were combined to facilitate student achievement. The concept of visual-verbal symbiosis is rooted in the idea that "visuals" support "verbals," and vice versa.
- 25. Visuals are considered to be things that can be seen, visible things other than printed words that are used in a communication process. The term verbal applies to written or spoken words. The natural tendency for visual and verbal components to be mutually supportive has been called visual-verbal symbiosis. When the natural relationship is destroyed, the result is visual verbal discontinuity.
- 26. Directions: Out of the text given, make a venn diagram. DALANDAN AND CALAMANSI Dalandan calamansi are both citrus fruits, which has juicy flesh and a pulpy rind. Their sizes differ, dalandan is bigger than a calamansi. When it comes to taste, dalandan is slightly sweeter than calamansi. Their skins also vary. Although there are some differences between the two fruits, both are delicious and healthy.
- 27. They both provide Vitamin C which is necessary for the growth, development and repair of all body tissues. It also boosts the immune system to fight against Covid -19.
- 28. Study the textual aid and answer the given questions. Interpreting textual aids
- 29. 1. Who among the following are considered as A5 category? a. Frontline health workers b. Individuals with comorbidities c. Indigent people
- 30. 2. If the estimated population of A2 category is 311,000 about how many were vaccinated? a. 220, 140 b. 230,140 c. 240, 140
- 31. Estimated population of A2 311,000 Percentage of vaccinated A2 X .74 Total number of vaccinated A2 230,140
- 32. Why is there a need to understand the visual verbal relationships in an expository text? We need to understand the visual elements accompanying text in order to improve our comprehension especially when dealing an informative materials. Visual Cues or Textual Aids are used to highlight the necessary or important information in a text.
- 33. Directions: Present your priorities in life using. Write at least 2 activities to make it happen. MY PRIORITIES