SlideShare a Scribd company logo
1 of 73
REVIEW OF
CARBONTRADING
IN THE
INDIAN BUILDING SECTOR
A. SHASHANK SPA/NS/BEM/469
MBEM (2nd Semester)
2009-10
SPA, New Delhi
GUIDED BY:
Dr. ANIL SAWHNEY
Mrs. RENUKA BHOGE
Seminar-1:
Final Review
BUILDING ENGINEERING & MANAGEMENT,
SCHOOLOF PLANNING & ARCHITECTURE, NEW DELHI
Friday
21st May’10
Chapter-1
1.1
NEED OF STUDY
Building industry is one of the largest energy consuming sector of the world. The work is
going on in the direction of making buildings less energy consumer. There are green
building rating systems (TERI-Griha, LEED etc.) through which we can make them energy
efficient.
38%
35%
27%
Energy Consumption
Building
Industry
Transportatio
n
This topic has been chosen as Carbon
trading under Clean Development
Mechanism (CDM) provides opportunity to
make our building more energy efficient and
at the same time providing direct monetary
benefits. Source: (UNEP, 2007,World BusinessCouncil for Sustainable
Development (WBCSD), 2007, deT'Serclaes, 2007).
Chapter-1
1.3
SCOPE OF STUDY
The scope of my work shall be restricted to the Building Sector of India (Including big &
small developers).
Policies followed and applied in such projects & benefits out of this (monetary &
environmental).
1.2.1 To find out the potentials involved in building sector, so it can lead the way in
controlling the GHG emissions,
1.2.2 To find out barriers present in building sector for low applicability of CDM,
1.2.3 To analyze the factors responsible for low applicability of CDM to building industry
1.2
AIM & OBJECTIVES
1.4
Research Methodology
Identifying need of study, aims & objectives and Scope of Seminar
Study the Literature
related to the topic
SOURCE:Websites, Papers,
Publications, journals etc. to
understand the topic
INTEND: Understanding
Various Mechanisms evolved,
need & their working
CarbonTrading, CDM &
Energy Efficiency
Concepts of CDM & EE and
their Applicability
Conditions in case of
buildings
To find out the potentials
& Barriers present in
Building Sector
Case Studies
To study outcome in terms
of energy consumption &
CERs Earned
To find out Possible areas
in building Sector for
Applicability of CDM
Conclusions & Future of CarbonTrading
Chapter-1
Carbon has become a
tradable commodity! 1
1.0
INTRODUCTION
Chapter-1
1 Ms. Pamposh Bhat, Director CDM
KYOTO
PROTOCOL
GLOBAL
WARMING
The Kyoto Protocol is an international treaty ratified by over 190 countries
to reduce greenhouse gas emissions that could cause global climate effects.
 First Commitment Period is 2008 to 2012
Annex-1: Developed (Industrialized) countries, OBLIGATORY GHG REDUCTION
 Have to reduce GHG Emission by 5.2 % less to that of 1990 by
first Commitment Period
Non Annex-1: DevelopingCountries, voluntary participation
Chapter-3
3.2
KYOTO PROTOCOL
3.2
KYOTO PROTOCOL
To achieve these goals, they are given a flexibility through 3 market based
forces, these are:
EmissionTrading (ET) as per article 17
Joint Implementation (JI) as per article 6
Clean Development Mechanism (CDM) as per article 12
 ET & JI are the mechanism to be practiced by Developed countries, while
CDM is the way out to incorporate developing countries for participation
in Kyoto Protocol.
Chapter-3
3.2
KYOTO PROTOCOL
There are 6 major Categories/Sectors under which all emissions are taken care off.They are;
 Energy (EE, Renewable Energy)
 Increasing building efficiency
 commercial/industrial energy efficiency
 Fuel switching
 re-powering, upgrading instrumentation
 Transport
 Methane Recovery
 Industrial Process Changes
 Cogeneration
 Agricultural Sector
Chapter-3
3.3
CarbonTrading
Carbon Trading: It is a system of buying & selling CER points awarded to those countries
by “Designated Operational Entities” (DOE) of UNFCCC, which further they sell to
developed nations, thus the goals of mitigatingGHG emissions will be met.
• Developing states participate in Kyoto Protocol through the CDM.
• Assist in creating sustainable development,
• To generate “Certified Emission Reductions” (CER) for use by the investor,
• Provides opportunity to reduce emissions anywhere in the world-wherever
the cost is lowest.
Chapter-3
 Carbon credits are a tradable permit scheme, or Certified Emission Reduction
(CER).
 They possesses a monetary value.
 Each credit gives the owner the right to emit one tonne of carbon dioxide.
 1 CER or 1 Carbon Credit = 1 t CO2
 Such a credit can be sold in the international market at the prevailing market price.
 1 CER is costing €12 to €17 in European Carbon Market as on now.
3.3
Carbon Credit or “CER”
Chapter-3
Industrialized countries (Annex I)
Developing countries (Non-Annex I)
CDM project
activity
To assist in achieving
sustainable development
To assist in meeting their
emission limitation
commitments
Project participants
Investors
(private business,
governments, NGOs)
(private business,
governments, NGOs)
Source: ‘INDIA-Climate Change Mitigation IndoGerman Bilateral
cooperation‘ by Ms. Pamposh Bhatt, Director, Climate Change
3.4
CDM (Working)
Chapter-3
CDM is an instrument of cooperation between developed and developing country parties
Three main objectives:
Developed countries to invest in projects of developing countries to reduce emission.
Assist developing country to achieve sustainable development
Contribute to achieving stabilization of concentrations of GHGs in the atmosphere.
Criteria for participation:
Voluntary (with some Annex-1 country (ies))
Party to the Kyoto Protocol (Non-Annex 1 countries)
3.4
Clean Development Mechanism (CDM)
Chapter-3
3.7
INDIAN BUILDING INDUSTRY
(Source: Need for Regulating the Construction Industry in India,
by SK Tripathi, Director (Corporate Planning), HUDCO)
second largest contributor in the GDP
work force of nearly 32 million
market size is worth about Rs. 2,48,000 crores
Other associated sectors worth Rs. 1,92,000 crores
3 segments of building sector;
 Buildings (general construction)
 Infrastructure (heavy civil works)
 Services (HVAC, plumbing, electrical)
Chapter-3
Chapter-4
Energy Efficiency & CDM in Buildings
Very lowApplication in building industry till date
GHG emission from buildings:
in 2004 8.6 billion tonnes
by 2030 (estimated) 15.6 billion tonnes
In India:
CERs generated till date (by all sectors): 74,464,962 CER
CERs generated by Building Industry: approx. 15,000 CER (quite low)
4.1
CDM & BUILDING INDUSTRY
Chapter-4
Energy Efficiency & CDM in Buildings
4.1
CDM & BUILDING INDUSTRY
Accelerated Chiller Replacement Program in INDIA: a world bank Initiative
• Large size old CFC Chillers to be replaced by High Efficiency HFC Chillers
• Expected Chiller Replacement by 2007-10 > 500 nos.
• Energy Consumption Estimated: 40-50 %
• Expected GHG Reductions by 2012: 2.3 MT CO2
• Old Chillers to be scrapped to avoid any leakages
(Source: India-Accelerated Chiller Replacement Program-Overviews
& Issues by Martina Bosi & Klauss Opermann)
4.3
CDM
Project
Cycle
10-12
Months
4-5
Months
2-3
Months
Whole
Process
takes 1½
to 2Years
Source: UNFCCC
Contents of a PDD:
 General description of project activity (baseline & additional functions adopted)
 Application of a baseline & monitoring methodology.
 Duration of project activity/crediting period.
 Environmental impacts.
 Stakeholders’ comments.
4.3
CDM Project Cycle…(contd.)
Chapter-4
Energy Efficiency & CDM in Buildings
Concept of Addtionality:
To be eligible to earn tradable CERs, all CDM projects must prove that a
reduction in GHG emissions resulting from the project would not have
occurred without the CDM project activity.
Chapter-4
Energy Efficiency & CDM in Buildings
4.3
CDM Project Cycle…(contd.)
Graph Source: Rasmesh Ramachandran, DNV
4.3
CDM
Project
Cycle…(contd.)
Chapter-4
Energy Efficiency & CDM in Buildings
4.3
CDM Project Cycle…(contd.)
TABLE: 3.1
Volume of CERs Generated annually
(TCO2)
Fee (US Dollars)
<= 15000 (SSC Projects) 5000
>15000 and <= 50000 10000
>50000 and <= 100000 15000
>100000 and <= 200000 20000
>200000 30000 Source: UNFCCC
Small Scale Project Activity
When a project is saving energy on generation side up till 60 GWhth on annual basis.
The aggregate energy savings of a single project may not exceed the equivalent of 15
GWh perYear.
A proposed small-scale project activity shall be deemed to be a debundled component of a
large project activity if there is a registered small-scale CDM project activity or an
application to register another small-scaleCDM project activity:
1. With the same project participants;
2. In the same project category and technology/measure; and
3. Registered within the previous 2 years; and whose project boundary is within 1 km of the
project boundary of the proposed small-scale activity at the closest point.
Chapter-4
Energy Efficiency & CDM in Buildings
PROJECTS CAN BE IMPLEMENTED INTHREE DIFFERENT MODELS
Unilateral Model: Bilateral Model: Multilateral Model:
project is implemented by
non‐annex I party without
an Annex I partner or
financing and then the CERs
are sold in the international
market.
Cooperation between and
Annex I party
with a Non‐Annex I party
Acquire multi Annex I parties
contributing to a centrally
managed fund with a non‐
Annex I party.
Chapter-4
Energy Efficiency & CDM in Buildings
4.3
CDM Project Cycle…(contd.)
5.1
ITC Sonar Bangla, Kolkata
Chapter-5
CaseStudy-1
Project Parties:
Host Party: Govt. of India & UK
Public/Private Participant: ITC Limited, India & ABN Amro Bank N.V., London
Through study, areas of possible energy savings were located.
Project Overview:
 five-star, 238-room hotel
 Designed as per NBC & ASHRAE standards
in 2003, a LEED platinum building
 Started preparing after one year of
completion for CDM (in 2004)
 Become a registered project in 2006
5.1
ITC Sonar Bangla, Kolkata
Chapter-5
CaseStudy-1
Baseline Scenario: as it was the first of its kind project, same project had
been taken as baseline.
• Initially started in 2003
• After one year operation it started preparing forCDM-EB approval.
• One year project run made up the baseline scenario to prove
“ADDITIONALITY”.
• Project Cost for implementation of technologies: Rs. 59.5 Lacs + FEES
• CER sell out for oneYear: Rs. 14.71 Lacs
a) Energy efficiency measures –generation side;
• Installation of magnetizer at the fuel inlet line (for better fuel atomization)
• Re-Utilization of low energy waste heat of the boiler flue gas to pre heat the
boiler feed water
• Utilization of condensate steam for hot water generation
b) Energy efficiency measures -demand side;
• installation of new frequency drives
• Retrofit of Pre-cooled Air Unit (PAU)
• solar thermal heater in place of electric water heater
• Retrofit of sewage treatment unit
• reduce, reuse and recycle of water
5.1
ITC Sonar Bangla, Kolkata
Chapter-5
CaseStudy-1
ProjectType Small Scale Project Activity
(commercial energy efficiency improvement project)
Location Kolkata, West Bengal
Type Type-II Energy Efficiency Improvement Project
Categories Project Category- II. B: Supply side energy efficiency
improvements
Project Category- II. E: Energy Efficiency and fuel switch
measures
Expected Energy
Savings
Under Category-II. B: up to 2.16 GWhth
Under Category-II. E: up to 2.12 GWh
Technologies Adopted Efficiency measures –generation side
Efficiency measures –demand side
5.1
ITC
Sonar
Bangla,
Kolkata
Project Duration 2+10 years
Starting Date 01st Jan’06
Registration with
UNFCCC
01 Jan 08 - 31 Dec 08 (Fixed)
CER Expected 2987 tCO2 (initially applied)
1996 t CO2 (finally approved)
CER Issued 1996 tCO2 (two years) for 2008 & 2009
revenue earned Rs. 14.7 lakhs (in FirstYear)* though not sold yet
Expected operational
lifetime of
technology/Equipments
15Years
4.1
ITC
Sonar
Bangla,
Kolkata
Financial Year Business Electricity Bill Bill : Business
2004-05 (before CDM) 38 crore 7 crore 1: 5.50
2007-08 (after CDM) 100 crore Rs. 5.8 crore 1: 17.25
Current Status of Savings:
5.1
Observations
Chapter-5
CaseStudy-1
• First Building project to earn Carbon Credits.
• By implementing efficiency improvement technologies to existing systems Sonar
bangla is able to save a considerable amount of energy, & mitigatingGHG emissions.
• Though they made provisions for 2987 CER, finally got approved are 1996 CER, which are
almost 33% less than the projected savings.
• Still project is able to get back the costs incurred in a period of approx. 4 years.
Chapter-5
CaseStudy-2
5.2
Technopolis IT Park, Kolkata
Project Overview:
 14 storey ITTower situated in Kolkata
 625,000 sq. ft. of workspace
 Become a registered project in 2007
 It is LEED-Gold rated office building.
Project Partners:
Host Party: Govt. of India
Public/Private Participant: Phoenix Software Limited(PSL)
5.2
Technopolis
IT
Park,
Kolkata
ProjectType Small Scale Project Activity
(energy efficiency measures inTechnopolis IT Park)
Location Kolkata, West Bengal
Type Type-II Energy Efficiency Improvement Project
Categories Project Category- II. E: Energy Efficiency and fuel switch
measures for building
Expected Energy
Savings
Under Category-II. E: up to 8.37 GWh/annum
Technologies Adopted Efficiency measures –demand side
Applications  HVAC Control
 Water Management
 Energy Management System
Project Duration 2+10 years
Starting Date 01st Jan’08
Registration with
UNFCCC
22 Apr 09 - 21 Apr 19 (Fixed)
CER Expected 8724.15 tCO2 per annum (initially applied)
8,448 tCO2 equivalent per annum (Finally approved)
CER Issued 8448 tCO2 (for 2009)
revenue earned Not sold yet
Expected operational
lifetime of
technology/Equipments
15Years
4.2
Technopolis
IT
Park,
Kolkata
5.2
Technopolis
IT
Park,
Kolkata
Parameters
affecting the HVAC
Baseline Building EE measures in
Technopolis
Remarks
MeasuresAdopted those affected Designed Heat Load inTechnopolis
Exterior Wall
Construction
U-factor:
1.0Btu/hr.ft2.0F
U-factor:
0.32Btu/hr.ft2.0F
Reduction in
designed heat
load
GlassWall Exposure
 U-value of Glass:
 ShadingCo-
efficient of glass:
 Light
Transmittance:
 Spandrel & Sill
Insulation:
 PlainGlass
used
 1.0Btu/hr.ft2.0F
 0.656
 70% on all
sides
 Not Provided
 Low “e”-glass
panes
 0.27Btu/hr.ft2.0F &
0.41Btu/hr.ft2.0F
 0.15 & 0.12
 23% & 6%
 With mineral wool
Reduction in
designed heat
load
Roof Insulation Baseline Building EE measures in
Technopolis
Remarks
 Insulation:
 U-Value:
 Terrace Garden:
 R-15 over-deck
 0.63Btu/hr.ft2.0
F
 Not provided
 R-15 Extruded
Polystyrene
 0.052Btu/hr.ft2.0F
 Provided
Reduction in
designed heat
load
AHU No Heat Recovery
Wheel (HRW)
Heat RecoveryWheels
(HRW) provided
Reduction in
designed heat
load
Chillers: Air cooled Chillers 2 water-cooled
centrifugal & 1 water-
cooled screw chiller
 Load Efficiency: 1.17kW/ton 0.576 kW/ton
5.2
Technopolis
IT
Park,
Kolkata
Current Status of Savings:
5.2
Observations
Chapter-5
CaseStudy-2
Alternatives Baseline Building Technopolis
(kWh) Electrical Plug Loads 4,120,022 4,120,022
Chiller Plant 8,084,944 2,646,941
CoolingTower 0 396,286
ChilledWater Circulation
Pumps
549,125 99,942
AHUs 3,474,910 593,304
Total electricity consumption
of the HVAC system per annum
16,229,001 7,856,495
Energy Saving per annum 8,372,509
Or say 51.59%
• The project is designed taking CDM implementation in consideration & applied to LEED-
Gold certification also.
• Improved technologies are used to decrease the energy load on demand side of the
system, which subsequently reduces the energy generation load on SEB (State Electricity
Board).
• A considerable energy saving more than 50% is achieved by appropriate planning &
intelligent implementation of technologies, which is again a huge Economical influence.
5.2
Observations
Chapter-5
CaseStudy-2
Chapter-5
CaseStudy-3
5.3
OlympiaTech Park, Chennai
Project Overview:
 IT building situated in Chennai, developed by
KhivrajTech Park Pvt. Ltd.
 Applied for registration in 2008-09
 LEED-Gold Rated Office Building
ProjectTeam:
Architects: RSPArchitects, Singapore
Structural Consultants: M/s.Struarc - headed by Mr.T.M. Ramakrishnan,
Civil Contractor: M/S. Consolidated Consortium Construction Ltd.
HVAC Cosultants: AirTreatment Engineering Pvt. Ltd
Energy Modeling: Environmental Design Solutions (EDS),New Delhi
ProjectType Small Scale Project Activity
(Energy Efficient Design Project – OLYMPIATECH PARK)
Location Chennai,Tamilnadu
Type Type-II Energy Efficiency Improvement Project
Categories Project Category- II. E: Energy Efficiency and fuel switch
measures for building
Expected Energy
Savings
Under Category-II. E: up to 17.5 GWh per year
Technologies Adopted Efficiency measures –demand side
Applications adoption of high efficiency equipment, high efficiency
materials, advanced control systems
Project Duration 2+10 years
Starting Date 17th Sept’07
CER Expected 15,073 tCO2 (per annum)
CER Issued Under validation
5.3
Olympia
Tech
Park,
Chennai
Technologies Adopted:
• wall construction – Materials with better insulation properties
• roof construction – Over deck insulation and roof garden
• Energy Efficient glass wall area - High performance glazing. Double glazed glass with low
U-value, optimum light transmittance and optimum shading co-efficient
• Energy Efficient design of the Heating Ventilation and Air-Conditioning (HVAC)
system. This includes:
 Efficient chillers – Higher Co-efficient of Performance chillers
 Variable Frequency Drives (VFDs) for Air Handing Unit (AHU) fans and chilled
water pumps
 Heat recovery wheels
Chapter-5
CaseStudy-3
5.3
OlympiaTech Park, Chennai
Chapter-5
CaseStudy-3
5.3
Observations
Emission Reductions
S. No. Notation Parameter Unit Value
1 BEy Baseline Emissions tCO2 32022
2 PEy Project Emissions tCO2 16949
3 ERy (1-2) Emission Reductions tCO2 15073
The project cost was INR 400 crores, while to incorporate these efficient technologies
only INR 18 crores more have to spent, which is less than 5% of the total project cost.
It is observed that an additional cost of about Rs. 100/- per sq. ft. has been spent to make
the building eligible to earn Carbon Credits.
Project energy saving is approx. 47% to baseline building, which also promote energy
saving on supply side of SEB, as well as significant reduction in fuel consumption.
6.1
Economic Analysis
Chapter-6
Analysis
CDM project cycle stages
where costs are incurred
Cost Estimates
Pre-operational phase design PIN/PDD Preparation Rs. 50000/-
Validation (to be paid to DOE) 5-12 % of CERValue
Registration (to be paid to CDM
EB)
2.25 to 2.50 Lakhs
Operational phase Monitoring & Verification (to be
paid to DOE)
5-12 % of CERValue
Certification (to be paid to CDM
EB)
2% of the CER value
Risk mitigation 1% - 3% of CER value
PROJECT NAME Initial
Project
Cost
EXPECTED REVENUE
THROUGH CERs
(INR)*
5%
CONSULTANT
FEES (INR)
Remarks
ITC Sonar Bangla,
Kolkata
59, 50, 000 14, 70, 000 73, 500 Features added
later
Technopolis IT
Park, Kolkata
N.A.** 65, 90, 000 3, 29, 500 incorporated at
design stage
OlympiaTech
Park , Chennai
N.A.** 1, 08, 50, 000 5, 42, 500 incorporated at
design stage
6.1
Economic Analysis
Chapter-6
Analysis
* Revenues earned by selling one years CERs.
**Costs incurred to incorporate more efficient technologies are not incorporated
Project Name Extra Money Spent
(INR)
Revenues Earned
(INR)
Payback Period
ITC Sonar Bangla,
Kolkata
63, 23, 500 14, 71, 000 41/4Years
Technopolis IT Park,
Kolkata
6, 29, 500* 65, 90, 000 Less than 2
months**
OlympiaTech Park ,
Chennai
8, 42, 500* 1, 08, 50, 000 Less than 2
months**
* Only Documentation & fees charges are included
**Costs incurred to incorporate more efficient technologies are not incorporated
6.1
Payback Calculation
Chapter-6
Analysis
7.1
Energy Efficient Building: Making a Case
Chapter-7
Conclusions
Basic Building Information:
Project taken: Airport Authority of India, Safdarjung, New Delhi
Built-up Area & Floors: 20,000 Sq. ft. (G+2)
HVAC System:Fully air conditioned (for 16 hrs occupancy)
Project Implementation:
Project Type: Small Scale Project Activity-Energy Efficiency Improvement Project
Type &/Category: II/II-E
Technologies to Implement (referTable 7.6): adoption of high efficiency equipment, high
efficiency materials, advanced control systems
Data needed: Climatic data of the city
Energy Simulation through software (we considered Ecotect & Equest)
Features Measure of
Performance
Existing
(Baseline)
Building
Retrofitting
Proposals
Remarks
Retrofitting Measures Adopted to reduce heat load in AAI Office, New Delhi
Exterior Wall
Construction
Material Normal Mass
Wall
Autoclaved
Aerated
Concrete (AAC)
blocks
Reduction in
designed heat
load
U-Value
(Btu/hr.ft20F)
0.42 0.10
Table 7.6:
Energy Efficient Measures
Chapter-7
Energy Efficient Building: Making a Case
Features Measure of
Performance
Existing
(Baseline)
Building
Retrofitting
Proposals
Remarks
Retrofitting Measures Adopted to reduce heat load in AAI Office, New Delhi
GlassWall Exposure Material Plain Glass used Double glazed
panels with Low
“e”-glass panes
Reduction in
designed heat
load
U-Value
(Btu/hr.ft20F)
1.30 on all sides 0.27 on all sides
Shading Co-efficient 0.51 on all sides 0.15 on all sides
LightTransmittance 70% on all sides 23% on north &
6% on other sides
Table 7.6:
Energy Efficient Measures
Chapter-7
Energy Efficient Building: Making a Case
Features Measure of
Performance
Existing (Baseline)
Building
Retrofitting
Proposals
Remarks
Retrofitting Measures Adopted to reduce heat load in AAI Office, New Delhi
Roof Insulation Material Truss Roof Making RCC roof
with R-15 over-deck
insulation. High
reflective coating
applied
Reduction in
designed heat
load
U-Value
(Btu/hr.ft20F)
0.12 0.067
Terrace Garden Not provided Provided (which
reduces heat island
effect)
Table 7.6:
Energy Efficient Measures
Chapter-7
Energy Efficient Building: Making a Case
Features Measure of
Performance
Existing
Building
Retrofitting Proposals Remarks
Retrofitting Measures Adopted to reduce heat load in AAI Office, New Delhi
AHU No Heat
Recovery
Wheel (HRW)
Heat Recovery Wheels
(HRW) shall be provided
Reduction in
designed heat
load
Chillers Air cooled
Chillers
Replace them with water
cooled chillers
Reduction in
Electricity
Consumption
COP 3.0 6.1
VFD in pumping
System
Not present Provided in both primary &
secondary system
Load Efficiency 1.10kW/TR 0.576 kW/TR
Table 7.6:
Energy Efficient Measures
Chapter-7
Energy Efficient Building: Making a Case
Alternative Electrical
Plug Loads
Chiller Plant Cooling
Tower
Chilled
Water
Circulation
Pumps
AHUs Total
electricity
consumption
of the HVAC
system per
annum
Existing Building 55679.70 109263.32 0.00 7421.11 46961.39 219325.51
AAI office
building after
project
implementation
55679.70 35771.87 5355.57 1350.66 8018.16 106175.96
Net Energy Saving (KWh) 113149.55
51.58%
TABLE 7.7:
Electrical End-useTotals (kWh)
Chapter-7
Energy Efficient Building: Making a Case
TABLE 7.8:
CER Calculations
Chapter-7
Energy Efficient Building: Making a Case
EHVAC,b-(in MWh/yr) in the baseline scenario 164
Top,HVAC,b – Operating hours 16
EHVAC,b,y – Electricity consumed by HVAC system (in MWh/yr) in year
‘y’(BaselineCase)
164
EHVAC, p, y – Electricity consumed after Project implementation in HVAC
system (in MWh/yr) in year ‘y’
50
Er,y – Reduction in electricity consumption compared to baseline building
(MWh/Year)
113
Er,GRID,y – Reduced electricity drawal from the grid (MWh/year) 113
EFGRID,y – Emission Factor for electricity drawn from grid by Central
ElectricityAuthority, Ministry of Power, Government of India
1.009
BEy – Baseline Emissions (in t CO2/annum) 114.17
Emission Reductions due to energy efficiency measures taken in the HVAC
system of "AAI office" (in t CO2/annum)
114
TABLE 7.9:
Monetary Aspects of Project Implementation
Chapter-7
Energy Efficient Building: Making a Case
Before Project
Implementation
After Project
Implementation
Unit Rate
(INR)
Monetary
Aspect (INR)
Direct Saving
(CER’s)
Nil 114 CER 720 82000
Energy
Consumption
(KWh)
219325.51 106175.96 4.50 509000
Net Savings per year after Project implementation (INR) 591000
7.1.9:
Observations
Chapter-7
Energy Efficient Building: Making a Case
 Project is able to earn 114 CER worth Rs. 82000/- after implementing the technologies.
 Project implementation fees is Rs. 3.0 Lakhs (cost of retrofitting is not included), while
direct savings are lower, hence it may not be feasible to apply for CDM implementation.
 Either increasing the footprint of building or considering 5-10 such buildings as ONE
Project activity .
 Though both direct & indirect benefits are larger (Rs. 5.90 Lakhs) per year, hence;
 If the fees bourne by UNFCCC for small projects can be eliminated, then the
promoters may go for CDM implementation.
8.1.1
Conclusions (Potentials)
Chapter-8
Conclusions
 Building sector has a greater potential for the CDM applicability.
 All the projects are also registered LEED-Certified projects.
 Though there are investment barriers, technological barriers and most importantly
barrier due to prevailing practices (due to lack of compulsory laws), through case studies
it is observed that CDM application makes building:
 More energy efficient (these savings are measurable)
 Pays direct monetary benefits to the project developer.
 CER value is increasing as yearly.
 If the parameters are followed on an early design stage, payback period is quite
small.
 Hotel Sonar Bangla incorporated technologies only to make already available systems
more efficient, which shows that retrofitting projects can also earn potential Carbon
Credits in case of commercial buildings.
 Though the payback period will be a little longer, but it brings additional benefits like
energy savings, environmental benefits & a satisfaction towards contributing in
sustainable development.
 Energy consumption is reduced by approx. 50 %
8.1.1
Conclusions (Potentials….contd):
Chapter-8
Conclusions
8.1.2
Conclusions (Barriers):
Chapter-8
Conclusions
 Dependency for cleaner technologies on developed nations & their high costs.
 there are many buildings but as their footprint is quite low, CDM implementation is not
feasible. (as we calculated aspects for AAI office building)
 Many technologies & their aspects to save energy has to be taken care off in a building.
 Time taken in registration is about 2 years, and possibilities of getting registration are
depends upon strict monitoring processes.
 Many different stakeholders involved in a building project, their coordination is a
problem.
Though there are barriers present in the building sector, the benefits are
more (direct & indirect), (as we listed out through case studies).
Besides all things it is more satisfactory as we can make a difference (and
the difference will be huge), if we adopt the path of making world a
sustainable & habitable place for us & for our future generations to come.
CDM is a working & feasible solution
8.1.3
Conclusions
Chapter-8
Conclusions
8.2
Future Scope of study
Chapter-8
Conclusions
As the talks are going on Execution Board (EB) level for ammendments;
 Proposal of programmatic CDM
 Reducing fee/ eliminating for SSC projects
ThankYou
ABBREVIATIONS
AAU Assigned Amount Unit
BAU Business-as-Usual
CDM Clean Development Mechanism
CoP Conference of Parties to the UNFCCC
CER Certified Emission Reductions
COP Co-efficient of Performance
DNA Designated National Authority
DOEs Designated Operational Entities
EB Executive Board
EIA Environnemental Impact Assesment
ERU Emission Réduction Unit
ET Emissions Trading
GEF Global Environmental Benefits
GHG Green House Gases
HCA Host Country Approval
IEA International Energy Agency
IPCC Intergovernmental Panel on Climate Change
IETA International Emissions Trading Association
KP Kyoto Protocol
NGO Non-Governmental Organization
PIN Project Idea Note
PDD Project Design Document
RMU Removal Units
UNFCCC United Nation Framework Convention on
Climate Change
VVM Validation and Verification Manual
GLOSSARY
REFERENCES
UNEP SBCI: The Kyoto Protocol, the Clean Development
Mechanism, and the Building and Construction Sector
Thomas Esdaile-Bouquet : Cogeneration Projects within the CDM Framework
Martina Bosi, member of IEA,World Bank: (Published Papers to cut down Carbon Emission in
Buildings)
Executive Report, December 2007: Reducing U.S. Greenhouse Gas Emissions: How much
& what cost?
Websites:
http://cdm.unfccc.int> UNFCCC
http://cdmindia.nic.in > CDM India
http://www.ipcc.ch/ > IPCC
http://epaper.timesofindia.com/APD26302/PrintArt.asp > Copenhagen Summit
http://www.grida.no/news/press/3350.aspx
CONTENTS
Chapter-1: Introduction 1-4
Introduction
Need of Study
Aims & Objectives
Scope of Study
Methodology
Chapter-2: Literature Review 5-10
Published & Unpublished Literature
Chapter-3: Carbon trading to mitigate Global warming 11-27
GlobalWarming & its impact on Environment
Kyoto (mechanism) Protocol
CarbonTrading
UNFCCC
Clean Development Mechanism
Status of Registered Projects
Indian Building Industry
Chapter-4: Energy Efficiency & CDM in Buildings 28-37
CDM & Building Industry
Energy Efficiency in Buildings through CDM
CDM project cycle
Concept of Additionality
Chapter-5: Case Studies 38-55
ITC Sonar Hotel, Kolkata
Technopolis, Kolkata
Olympia,Chennai
Chapter-6: Analysis 56-59
EconomicAnalysis
Methods chose for EconomicAnalysis
Costs RelatedTo CDM Application
Observations FromThe Analysis
CONTENTS
Chapter-7: Energy Efficiency Report; Making a Case 60-80
AirportAuthority of India, Safdarjung, New Delhi
Thermal Analysis
Thermal Analysis Results
Making of Case
Observations
Chapter-8: Conclusions 81-82
References
Appendix-A: SSC PDD Form
MONITORING REPORT: ITC Sonar Bangla, Kolkata
CONTENTS
CDM is an aspect (through which developing countries may participate in KP)
which leads a way to control it, without compromising development.
1.1
NEED OF STUDY
Chapter-1
38%
35%
27%
Energy Consumption
Building
Industry
Transportation
Source: (UNEP, 2007,World BusinessCouncil for Sustainable Development (WBCSD), 2007, deT'Serclaes, 2007).
3.1
Global Warming
Chapter-3
Worldwide GHG emission:
3.3
GREEN HOUSE GASES
TABLE-2.1
Green House Gas (GHG) GlobalWarming
Potential (GWP)
Key Industrial Sources
Carbon-di-oxide (CO2) 1 Combustion of fossil fuels; cement manufacture
Methane (CH4) 21 Oil & gas extraction and processing; mining;
landfills; wastewater
Nitrous oxide (N2O) 310 Adipic acid and nitric acid production; wastewater
treatment
Per fluoro carbon (PFCs) 560-9,200 Refrigerant manufacture and use; Al and Mg
smelting
Hydro fluoro carbon (HFCs) 140-11,700 Refrigerant manufacture and use
Sulphur hexa fluoride (SF6) Above 10,000
(Approx. 22,900)
Al and Mg smelting; high voltage electrical
switching equipment
Source: UNFCCC
Chapter-3
Scale
Registered
Projects
LARGE 1136
SMALL 908
Registered project activities by scale. Total: 1,899
As on 16.11.2009
As on 12.02.2010
Registered Projects: BY SCALE
Source: UNFCCC
Chapter-3
As on 12.02.2010
As on 16.11.2009
Registered Projects: BY SCOPE
Sector
Registered
Projects
Energy industries 1502
Waste handling and
disposal
458
Energy demand 25
Construction 0
Source: UNFCCC
Chapter-3
Registered project activities by Host Party. Total: 1,899
As on 16.11.2009
As on 12.02.2010
Country No. Of Projects
China 741
India 484
Brazil 168
Registered Projects: BY HOST PARTY
Source: UNFCCC
Chapter-3
Country CERs
China 179,528,995
India 74,464,962
Republic of
Korea
49,809,792
Brazil 38,050,351
CERs ISSUED, BY HOST PARTY
As on 12.02.2010
Source: UNFCCC
Chapter-3
1. Planning a
CDM project
CDM project participants plan a CDM project activity
 There are several conditions in order to be registered as a
CDM project activity and CDM project participants should
consider those conditions form a planning stage
2. Prepare the
project design
document
(PDD)
CDM project participants prepare the project design document
(PDD) for a CDM project activity
 There is the standard format for the PDD and CDM project
participants must fill in all the contents as necessary
4.3
CDM
Project
Cycle…(contd.)
3. Getting
approval from
host Party
and Annex I
Party
CDM project participants shall get written approvals of voluntary
participation form the designated national authority (DNA) of a host
Party and an Annex I Party
 The written approval from host Party should include
confirmation by the host Party that a project activity assists it in
achieving sustainable development.
 The details of approval procedure is up to each Party
4.Validation
and
registration
Process of independent evaluation of a project activity against the
requirements of the CDM on the basis of the PDD.
 Validation is carried out by a designed operational entity
(DOE), which shall be different from first.
 There is a formal procedure for validation.
Registration is the formal acceptance of a validated project as a
CDM project activity.
 Registration is done by the CDM Executive Board.
 There is a formal procedure for registration.
4.3
CDM
Project
Cycle
…(contd.)
5. Monitoring a
CDM project
activity
CDM project participants collect and archive all relevant data
necessary for calculating GHG emission reductions by a CDM
project activity, in accordance with the monitoring plan written
in the PDD.
6.Verification and
certification
Verification is the periodic independent review and ex post
determination of the monitored GHG emission reductions
 Verification is carried out by a designated operational
entity (DOE).
 There is a formal procedure for verification.
Certification is the written assurance by a DOE that a project
activity achieved the reductions in GHG emissions as verified.
 A DOE also does certification.
4.3
CDM
Project
Cycle
…(contd.)
7. Issuance of
CERs
The EB will issue CERs equal to the verified amount of GHG emission
reductions.
• GHG emission reductions since 2000 may be eligible to claim
CERs.
Among issued CERs;
 2% for “the share of proceeds” to assist developing countries that
are particularly vulnerable to climate change.
 X% for “the share of proceeds” to cover administrative expenses
of the CDM.
• The CoP upon the recommendation of the EB shall
determine the value of X.
8. Distribution
of CERs
CERs will be distributed among CDM project participants
 The decision on the distribution of CERs from a CDM project
activity shall exclusively be taken by project participants.
4.3
CDM
Project
Cycle
…(contd.)

More Related Content

Similar to REVIEW OF CARBON TRADING IN THE INDIAN BUILDING SECTOR

CDM-Process, Progress and challenges Indian Perspective
CDM-Process, Progress and challenges Indian PerspectiveCDM-Process, Progress and challenges Indian Perspective
CDM-Process, Progress and challenges Indian Perspective
Nirav Modh
 
Carbon trading 19 41_45
Carbon trading 19 41_45Carbon trading 19 41_45
Carbon trading 19 41_45
domsr
 
Capstone Project_2013-15
Capstone Project_2013-15Capstone Project_2013-15
Capstone Project_2013-15
Priyankur Dhar
 
Carbon Market 101
Carbon Market 101Carbon Market 101
Carbon Market 101
edward_007
 
Clean development mechanism in india
Clean development mechanism in indiaClean development mechanism in india
Clean development mechanism in india
Vivek Verma
 

Similar to REVIEW OF CARBON TRADING IN THE INDIAN BUILDING SECTOR (20)

CDM-Process, Progress and challenges Indian Perspective
CDM-Process, Progress and challenges Indian PerspectiveCDM-Process, Progress and challenges Indian Perspective
CDM-Process, Progress and challenges Indian Perspective
 
Carbon trading 19 41_45
Carbon trading 19 41_45Carbon trading 19 41_45
Carbon trading 19 41_45
 
Financing Energy Optimization Projects
Financing Energy Optimization Projects Financing Energy Optimization Projects
Financing Energy Optimization Projects
 
Carbon Financing for Renewable Energy Projects in Zimbabwe – A Case of Chipen...
Carbon Financing for Renewable Energy Projects in Zimbabwe – A Case of Chipen...Carbon Financing for Renewable Energy Projects in Zimbabwe – A Case of Chipen...
Carbon Financing for Renewable Energy Projects in Zimbabwe – A Case of Chipen...
 
Development and Utilization of Alternative Energy Sources
Development and Utilization of Alternative Energy SourcesDevelopment and Utilization of Alternative Energy Sources
Development and Utilization of Alternative Energy Sources
 
Capstone Project_2013-15
Capstone Project_2013-15Capstone Project_2013-15
Capstone Project_2013-15
 
cdm (1).ppt
cdm (1).pptcdm (1).ppt
cdm (1).ppt
 
My seminar
My seminarMy seminar
My seminar
 
llM University of Reading 2013 Carbontrading
llM University of Reading 2013 CarbontradingllM University of Reading 2013 Carbontrading
llM University of Reading 2013 Carbontrading
 
Market Based Mechanism in Indonesia, a Joint Crediting Mechanism Case Study
Market Based Mechanism in Indonesia, a Joint Crediting Mechanism Case StudyMarket Based Mechanism in Indonesia, a Joint Crediting Mechanism Case Study
Market Based Mechanism in Indonesia, a Joint Crediting Mechanism Case Study
 
Carbon Market 101
Carbon Market 101Carbon Market 101
Carbon Market 101
 
Clean development mechanism in india
Clean development mechanism in indiaClean development mechanism in india
Clean development mechanism in india
 
Carbon finance for beginners (Kyoto Protocol and its mechanisms; Current stat...
Carbon finance for beginners (Kyoto Protocol and its mechanisms; Current stat...Carbon finance for beginners (Kyoto Protocol and its mechanisms; Current stat...
Carbon finance for beginners (Kyoto Protocol and its mechanisms; Current stat...
 
Pricing carbon_ Trade-offs and opportunities for India _ ORF.pdf
Pricing carbon_ Trade-offs and opportunities for India _ ORF.pdfPricing carbon_ Trade-offs and opportunities for India _ ORF.pdf
Pricing carbon_ Trade-offs and opportunities for India _ ORF.pdf
 
Energy Technologies - Scenarios to 2050
Energy Technologies - Scenarios to 2050Energy Technologies - Scenarios to 2050
Energy Technologies - Scenarios to 2050
 
An Analysis of Clean Development Mechanism
An Analysis of Clean Development MechanismAn Analysis of Clean Development Mechanism
An Analysis of Clean Development Mechanism
 
Clean Development Mechanism
Clean Development MechanismClean Development Mechanism
Clean Development Mechanism
 
Carbon credit
Carbon credit Carbon credit
Carbon credit
 
Carbon Credit
Carbon CreditCarbon Credit
Carbon Credit
 
Understanding Carbon Credits Business
Understanding Carbon Credits BusinessUnderstanding Carbon Credits Business
Understanding Carbon Credits Business
 

Recently uploaded

Jual obat aborsi Jakarta 085657271886 Cytote pil telat bulan penggugur kandun...
Jual obat aborsi Jakarta 085657271886 Cytote pil telat bulan penggugur kandun...Jual obat aborsi Jakarta 085657271886 Cytote pil telat bulan penggugur kandun...
Jual obat aborsi Jakarta 085657271886 Cytote pil telat bulan penggugur kandun...
ZurliaSoop
 
Unlocking Exploration: Self-Motivated Agents Thrive on Memory-Driven Curiosity
Unlocking Exploration: Self-Motivated Agents Thrive on Memory-Driven CuriosityUnlocking Exploration: Self-Motivated Agents Thrive on Memory-Driven Curiosity
Unlocking Exploration: Self-Motivated Agents Thrive on Memory-Driven Curiosity
Hung Le
 
Proofreading- Basics to Artificial Intelligence Integration - Presentation:Sl...
Proofreading- Basics to Artificial Intelligence Integration - Presentation:Sl...Proofreading- Basics to Artificial Intelligence Integration - Presentation:Sl...
Proofreading- Basics to Artificial Intelligence Integration - Presentation:Sl...
David Celestin
 

Recently uploaded (19)

LITTLE ABOUT LESOTHO FROM THE TIME MOSHOESHOE THE FIRST WAS BORN
LITTLE ABOUT LESOTHO FROM THE TIME MOSHOESHOE THE FIRST WAS BORNLITTLE ABOUT LESOTHO FROM THE TIME MOSHOESHOE THE FIRST WAS BORN
LITTLE ABOUT LESOTHO FROM THE TIME MOSHOESHOE THE FIRST WAS BORN
 
BEAUTIFUL PLACES TO VISIT IN LESOTHO.pptx
BEAUTIFUL PLACES TO VISIT IN LESOTHO.pptxBEAUTIFUL PLACES TO VISIT IN LESOTHO.pptx
BEAUTIFUL PLACES TO VISIT IN LESOTHO.pptx
 
in kuwait௹+918133066128....) @abortion pills for sale in Kuwait City
in kuwait௹+918133066128....) @abortion pills for sale in Kuwait Cityin kuwait௹+918133066128....) @abortion pills for sale in Kuwait City
in kuwait௹+918133066128....) @abortion pills for sale in Kuwait City
 
BIG DEVELOPMENTS IN LESOTHO(DAMS & MINES
BIG DEVELOPMENTS IN LESOTHO(DAMS & MINESBIG DEVELOPMENTS IN LESOTHO(DAMS & MINES
BIG DEVELOPMENTS IN LESOTHO(DAMS & MINES
 
History of Morena Moshoeshoe birth death
History of Morena Moshoeshoe birth deathHistory of Morena Moshoeshoe birth death
History of Morena Moshoeshoe birth death
 
The Concession of Asaba International Airport: Balancing Politics and Policy ...
The Concession of Asaba International Airport: Balancing Politics and Policy ...The Concession of Asaba International Airport: Balancing Politics and Policy ...
The Concession of Asaba International Airport: Balancing Politics and Policy ...
 
"I hear you": Moving beyond empathy in UXR
"I hear you": Moving beyond empathy in UXR"I hear you": Moving beyond empathy in UXR
"I hear you": Moving beyond empathy in UXR
 
Abortion Pills Fahaheel ௹+918133066128💬@ Safe and Effective Mifepristion and ...
Abortion Pills Fahaheel ௹+918133066128💬@ Safe and Effective Mifepristion and ...Abortion Pills Fahaheel ௹+918133066128💬@ Safe and Effective Mifepristion and ...
Abortion Pills Fahaheel ௹+918133066128💬@ Safe and Effective Mifepristion and ...
 
SOLID WASTE MANAGEMENT SYSTEM OF FENI PAURASHAVA, BANGLADESH.pdf
SOLID WASTE MANAGEMENT SYSTEM OF FENI PAURASHAVA, BANGLADESH.pdfSOLID WASTE MANAGEMENT SYSTEM OF FENI PAURASHAVA, BANGLADESH.pdf
SOLID WASTE MANAGEMENT SYSTEM OF FENI PAURASHAVA, BANGLADESH.pdf
 
ECOLOGY OF FISHES.pptx full presentation
ECOLOGY OF FISHES.pptx full presentationECOLOGY OF FISHES.pptx full presentation
ECOLOGY OF FISHES.pptx full presentation
 
Jual obat aborsi Jakarta 085657271886 Cytote pil telat bulan penggugur kandun...
Jual obat aborsi Jakarta 085657271886 Cytote pil telat bulan penggugur kandun...Jual obat aborsi Jakarta 085657271886 Cytote pil telat bulan penggugur kandun...
Jual obat aborsi Jakarta 085657271886 Cytote pil telat bulan penggugur kandun...
 
Unlocking Exploration: Self-Motivated Agents Thrive on Memory-Driven Curiosity
Unlocking Exploration: Self-Motivated Agents Thrive on Memory-Driven CuriosityUnlocking Exploration: Self-Motivated Agents Thrive on Memory-Driven Curiosity
Unlocking Exploration: Self-Motivated Agents Thrive on Memory-Driven Curiosity
 
2024 mega trends for the digital workplace - FINAL.pdf
2024 mega trends for the digital workplace - FINAL.pdf2024 mega trends for the digital workplace - FINAL.pdf
2024 mega trends for the digital workplace - FINAL.pdf
 
Proofreading- Basics to Artificial Intelligence Integration - Presentation:Sl...
Proofreading- Basics to Artificial Intelligence Integration - Presentation:Sl...Proofreading- Basics to Artificial Intelligence Integration - Presentation:Sl...
Proofreading- Basics to Artificial Intelligence Integration - Presentation:Sl...
 
Ready Set Go Children Sermon about Mark 16:15-20
Ready Set Go Children Sermon about Mark 16:15-20Ready Set Go Children Sermon about Mark 16:15-20
Ready Set Go Children Sermon about Mark 16:15-20
 
Digital collaboration with Microsoft 365 as extension of Drupal
Digital collaboration with Microsoft 365 as extension of DrupalDigital collaboration with Microsoft 365 as extension of Drupal
Digital collaboration with Microsoft 365 as extension of Drupal
 
Introduction to Artificial intelligence.
Introduction to Artificial intelligence.Introduction to Artificial intelligence.
Introduction to Artificial intelligence.
 
Using AI to boost productivity for developers
Using AI to boost productivity for developersUsing AI to boost productivity for developers
Using AI to boost productivity for developers
 
ICT role in 21st century education and it's challenges.pdf
ICT role in 21st century education and it's challenges.pdfICT role in 21st century education and it's challenges.pdf
ICT role in 21st century education and it's challenges.pdf
 

REVIEW OF CARBON TRADING IN THE INDIAN BUILDING SECTOR

  • 1. REVIEW OF CARBONTRADING IN THE INDIAN BUILDING SECTOR A. SHASHANK SPA/NS/BEM/469 MBEM (2nd Semester) 2009-10 SPA, New Delhi GUIDED BY: Dr. ANIL SAWHNEY Mrs. RENUKA BHOGE Seminar-1: Final Review BUILDING ENGINEERING & MANAGEMENT, SCHOOLOF PLANNING & ARCHITECTURE, NEW DELHI Friday 21st May’10
  • 2. Chapter-1 1.1 NEED OF STUDY Building industry is one of the largest energy consuming sector of the world. The work is going on in the direction of making buildings less energy consumer. There are green building rating systems (TERI-Griha, LEED etc.) through which we can make them energy efficient. 38% 35% 27% Energy Consumption Building Industry Transportatio n This topic has been chosen as Carbon trading under Clean Development Mechanism (CDM) provides opportunity to make our building more energy efficient and at the same time providing direct monetary benefits. Source: (UNEP, 2007,World BusinessCouncil for Sustainable Development (WBCSD), 2007, deT'Serclaes, 2007).
  • 3. Chapter-1 1.3 SCOPE OF STUDY The scope of my work shall be restricted to the Building Sector of India (Including big & small developers). Policies followed and applied in such projects & benefits out of this (monetary & environmental). 1.2.1 To find out the potentials involved in building sector, so it can lead the way in controlling the GHG emissions, 1.2.2 To find out barriers present in building sector for low applicability of CDM, 1.2.3 To analyze the factors responsible for low applicability of CDM to building industry 1.2 AIM & OBJECTIVES
  • 4. 1.4 Research Methodology Identifying need of study, aims & objectives and Scope of Seminar Study the Literature related to the topic SOURCE:Websites, Papers, Publications, journals etc. to understand the topic INTEND: Understanding Various Mechanisms evolved, need & their working CarbonTrading, CDM & Energy Efficiency Concepts of CDM & EE and their Applicability Conditions in case of buildings To find out the potentials & Barriers present in Building Sector Case Studies To study outcome in terms of energy consumption & CERs Earned To find out Possible areas in building Sector for Applicability of CDM Conclusions & Future of CarbonTrading Chapter-1
  • 5. Carbon has become a tradable commodity! 1 1.0 INTRODUCTION Chapter-1 1 Ms. Pamposh Bhat, Director CDM KYOTO PROTOCOL GLOBAL WARMING
  • 6. The Kyoto Protocol is an international treaty ratified by over 190 countries to reduce greenhouse gas emissions that could cause global climate effects.  First Commitment Period is 2008 to 2012 Annex-1: Developed (Industrialized) countries, OBLIGATORY GHG REDUCTION  Have to reduce GHG Emission by 5.2 % less to that of 1990 by first Commitment Period Non Annex-1: DevelopingCountries, voluntary participation Chapter-3 3.2 KYOTO PROTOCOL
  • 7. 3.2 KYOTO PROTOCOL To achieve these goals, they are given a flexibility through 3 market based forces, these are: EmissionTrading (ET) as per article 17 Joint Implementation (JI) as per article 6 Clean Development Mechanism (CDM) as per article 12  ET & JI are the mechanism to be practiced by Developed countries, while CDM is the way out to incorporate developing countries for participation in Kyoto Protocol. Chapter-3
  • 8. 3.2 KYOTO PROTOCOL There are 6 major Categories/Sectors under which all emissions are taken care off.They are;  Energy (EE, Renewable Energy)  Increasing building efficiency  commercial/industrial energy efficiency  Fuel switching  re-powering, upgrading instrumentation  Transport  Methane Recovery  Industrial Process Changes  Cogeneration  Agricultural Sector Chapter-3
  • 9. 3.3 CarbonTrading Carbon Trading: It is a system of buying & selling CER points awarded to those countries by “Designated Operational Entities” (DOE) of UNFCCC, which further they sell to developed nations, thus the goals of mitigatingGHG emissions will be met. • Developing states participate in Kyoto Protocol through the CDM. • Assist in creating sustainable development, • To generate “Certified Emission Reductions” (CER) for use by the investor, • Provides opportunity to reduce emissions anywhere in the world-wherever the cost is lowest. Chapter-3
  • 10.  Carbon credits are a tradable permit scheme, or Certified Emission Reduction (CER).  They possesses a monetary value.  Each credit gives the owner the right to emit one tonne of carbon dioxide.  1 CER or 1 Carbon Credit = 1 t CO2  Such a credit can be sold in the international market at the prevailing market price.  1 CER is costing €12 to €17 in European Carbon Market as on now. 3.3 Carbon Credit or “CER” Chapter-3
  • 11. Industrialized countries (Annex I) Developing countries (Non-Annex I) CDM project activity To assist in achieving sustainable development To assist in meeting their emission limitation commitments Project participants Investors (private business, governments, NGOs) (private business, governments, NGOs) Source: ‘INDIA-Climate Change Mitigation IndoGerman Bilateral cooperation‘ by Ms. Pamposh Bhatt, Director, Climate Change 3.4 CDM (Working) Chapter-3
  • 12. CDM is an instrument of cooperation between developed and developing country parties Three main objectives: Developed countries to invest in projects of developing countries to reduce emission. Assist developing country to achieve sustainable development Contribute to achieving stabilization of concentrations of GHGs in the atmosphere. Criteria for participation: Voluntary (with some Annex-1 country (ies)) Party to the Kyoto Protocol (Non-Annex 1 countries) 3.4 Clean Development Mechanism (CDM) Chapter-3
  • 13. 3.7 INDIAN BUILDING INDUSTRY (Source: Need for Regulating the Construction Industry in India, by SK Tripathi, Director (Corporate Planning), HUDCO) second largest contributor in the GDP work force of nearly 32 million market size is worth about Rs. 2,48,000 crores Other associated sectors worth Rs. 1,92,000 crores 3 segments of building sector;  Buildings (general construction)  Infrastructure (heavy civil works)  Services (HVAC, plumbing, electrical) Chapter-3
  • 14. Chapter-4 Energy Efficiency & CDM in Buildings Very lowApplication in building industry till date GHG emission from buildings: in 2004 8.6 billion tonnes by 2030 (estimated) 15.6 billion tonnes In India: CERs generated till date (by all sectors): 74,464,962 CER CERs generated by Building Industry: approx. 15,000 CER (quite low) 4.1 CDM & BUILDING INDUSTRY
  • 15. Chapter-4 Energy Efficiency & CDM in Buildings 4.1 CDM & BUILDING INDUSTRY Accelerated Chiller Replacement Program in INDIA: a world bank Initiative • Large size old CFC Chillers to be replaced by High Efficiency HFC Chillers • Expected Chiller Replacement by 2007-10 > 500 nos. • Energy Consumption Estimated: 40-50 % • Expected GHG Reductions by 2012: 2.3 MT CO2 • Old Chillers to be scrapped to avoid any leakages (Source: India-Accelerated Chiller Replacement Program-Overviews & Issues by Martina Bosi & Klauss Opermann)
  • 17. Contents of a PDD:  General description of project activity (baseline & additional functions adopted)  Application of a baseline & monitoring methodology.  Duration of project activity/crediting period.  Environmental impacts.  Stakeholders’ comments. 4.3 CDM Project Cycle…(contd.) Chapter-4 Energy Efficiency & CDM in Buildings
  • 18. Concept of Addtionality: To be eligible to earn tradable CERs, all CDM projects must prove that a reduction in GHG emissions resulting from the project would not have occurred without the CDM project activity. Chapter-4 Energy Efficiency & CDM in Buildings 4.3 CDM Project Cycle…(contd.) Graph Source: Rasmesh Ramachandran, DNV
  • 20. Chapter-4 Energy Efficiency & CDM in Buildings 4.3 CDM Project Cycle…(contd.) TABLE: 3.1 Volume of CERs Generated annually (TCO2) Fee (US Dollars) <= 15000 (SSC Projects) 5000 >15000 and <= 50000 10000 >50000 and <= 100000 15000 >100000 and <= 200000 20000 >200000 30000 Source: UNFCCC
  • 21. Small Scale Project Activity When a project is saving energy on generation side up till 60 GWhth on annual basis. The aggregate energy savings of a single project may not exceed the equivalent of 15 GWh perYear. A proposed small-scale project activity shall be deemed to be a debundled component of a large project activity if there is a registered small-scale CDM project activity or an application to register another small-scaleCDM project activity: 1. With the same project participants; 2. In the same project category and technology/measure; and 3. Registered within the previous 2 years; and whose project boundary is within 1 km of the project boundary of the proposed small-scale activity at the closest point. Chapter-4 Energy Efficiency & CDM in Buildings
  • 22. PROJECTS CAN BE IMPLEMENTED INTHREE DIFFERENT MODELS Unilateral Model: Bilateral Model: Multilateral Model: project is implemented by non‐annex I party without an Annex I partner or financing and then the CERs are sold in the international market. Cooperation between and Annex I party with a Non‐Annex I party Acquire multi Annex I parties contributing to a centrally managed fund with a non‐ Annex I party. Chapter-4 Energy Efficiency & CDM in Buildings 4.3 CDM Project Cycle…(contd.)
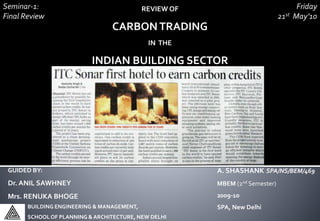
  • 23. 5.1 ITC Sonar Bangla, Kolkata Chapter-5 CaseStudy-1 Project Parties: Host Party: Govt. of India & UK Public/Private Participant: ITC Limited, India & ABN Amro Bank N.V., London Through study, areas of possible energy savings were located. Project Overview:  five-star, 238-room hotel  Designed as per NBC & ASHRAE standards in 2003, a LEED platinum building  Started preparing after one year of completion for CDM (in 2004)  Become a registered project in 2006
  • 24. 5.1 ITC Sonar Bangla, Kolkata Chapter-5 CaseStudy-1 Baseline Scenario: as it was the first of its kind project, same project had been taken as baseline. • Initially started in 2003 • After one year operation it started preparing forCDM-EB approval. • One year project run made up the baseline scenario to prove “ADDITIONALITY”. • Project Cost for implementation of technologies: Rs. 59.5 Lacs + FEES • CER sell out for oneYear: Rs. 14.71 Lacs
  • 25. a) Energy efficiency measures –generation side; • Installation of magnetizer at the fuel inlet line (for better fuel atomization) • Re-Utilization of low energy waste heat of the boiler flue gas to pre heat the boiler feed water • Utilization of condensate steam for hot water generation b) Energy efficiency measures -demand side; • installation of new frequency drives • Retrofit of Pre-cooled Air Unit (PAU) • solar thermal heater in place of electric water heater • Retrofit of sewage treatment unit • reduce, reuse and recycle of water 5.1 ITC Sonar Bangla, Kolkata Chapter-5 CaseStudy-1
  • 26. ProjectType Small Scale Project Activity (commercial energy efficiency improvement project) Location Kolkata, West Bengal Type Type-II Energy Efficiency Improvement Project Categories Project Category- II. B: Supply side energy efficiency improvements Project Category- II. E: Energy Efficiency and fuel switch measures Expected Energy Savings Under Category-II. B: up to 2.16 GWhth Under Category-II. E: up to 2.12 GWh Technologies Adopted Efficiency measures –generation side Efficiency measures –demand side 5.1 ITC Sonar Bangla, Kolkata
  • 27. Project Duration 2+10 years Starting Date 01st Jan’06 Registration with UNFCCC 01 Jan 08 - 31 Dec 08 (Fixed) CER Expected 2987 tCO2 (initially applied) 1996 t CO2 (finally approved) CER Issued 1996 tCO2 (two years) for 2008 & 2009 revenue earned Rs. 14.7 lakhs (in FirstYear)* though not sold yet Expected operational lifetime of technology/Equipments 15Years 4.1 ITC Sonar Bangla, Kolkata
  • 28. Financial Year Business Electricity Bill Bill : Business 2004-05 (before CDM) 38 crore 7 crore 1: 5.50 2007-08 (after CDM) 100 crore Rs. 5.8 crore 1: 17.25 Current Status of Savings: 5.1 Observations Chapter-5 CaseStudy-1 • First Building project to earn Carbon Credits. • By implementing efficiency improvement technologies to existing systems Sonar bangla is able to save a considerable amount of energy, & mitigatingGHG emissions. • Though they made provisions for 2987 CER, finally got approved are 1996 CER, which are almost 33% less than the projected savings. • Still project is able to get back the costs incurred in a period of approx. 4 years.
  • 29. Chapter-5 CaseStudy-2 5.2 Technopolis IT Park, Kolkata Project Overview:  14 storey ITTower situated in Kolkata  625,000 sq. ft. of workspace  Become a registered project in 2007  It is LEED-Gold rated office building. Project Partners: Host Party: Govt. of India Public/Private Participant: Phoenix Software Limited(PSL)
  • 30. 5.2 Technopolis IT Park, Kolkata ProjectType Small Scale Project Activity (energy efficiency measures inTechnopolis IT Park) Location Kolkata, West Bengal Type Type-II Energy Efficiency Improvement Project Categories Project Category- II. E: Energy Efficiency and fuel switch measures for building Expected Energy Savings Under Category-II. E: up to 8.37 GWh/annum Technologies Adopted Efficiency measures –demand side Applications  HVAC Control  Water Management  Energy Management System
  • 31. Project Duration 2+10 years Starting Date 01st Jan’08 Registration with UNFCCC 22 Apr 09 - 21 Apr 19 (Fixed) CER Expected 8724.15 tCO2 per annum (initially applied) 8,448 tCO2 equivalent per annum (Finally approved) CER Issued 8448 tCO2 (for 2009) revenue earned Not sold yet Expected operational lifetime of technology/Equipments 15Years 4.2 Technopolis IT Park, Kolkata
  • 32. 5.2 Technopolis IT Park, Kolkata Parameters affecting the HVAC Baseline Building EE measures in Technopolis Remarks MeasuresAdopted those affected Designed Heat Load inTechnopolis Exterior Wall Construction U-factor: 1.0Btu/hr.ft2.0F U-factor: 0.32Btu/hr.ft2.0F Reduction in designed heat load GlassWall Exposure  U-value of Glass:  ShadingCo- efficient of glass:  Light Transmittance:  Spandrel & Sill Insulation:  PlainGlass used  1.0Btu/hr.ft2.0F  0.656  70% on all sides  Not Provided  Low “e”-glass panes  0.27Btu/hr.ft2.0F & 0.41Btu/hr.ft2.0F  0.15 & 0.12  23% & 6%  With mineral wool Reduction in designed heat load
  • 33. Roof Insulation Baseline Building EE measures in Technopolis Remarks  Insulation:  U-Value:  Terrace Garden:  R-15 over-deck  0.63Btu/hr.ft2.0 F  Not provided  R-15 Extruded Polystyrene  0.052Btu/hr.ft2.0F  Provided Reduction in designed heat load AHU No Heat Recovery Wheel (HRW) Heat RecoveryWheels (HRW) provided Reduction in designed heat load Chillers: Air cooled Chillers 2 water-cooled centrifugal & 1 water- cooled screw chiller  Load Efficiency: 1.17kW/ton 0.576 kW/ton 5.2 Technopolis IT Park, Kolkata
  • 34. Current Status of Savings: 5.2 Observations Chapter-5 CaseStudy-2 Alternatives Baseline Building Technopolis (kWh) Electrical Plug Loads 4,120,022 4,120,022 Chiller Plant 8,084,944 2,646,941 CoolingTower 0 396,286 ChilledWater Circulation Pumps 549,125 99,942 AHUs 3,474,910 593,304 Total electricity consumption of the HVAC system per annum 16,229,001 7,856,495 Energy Saving per annum 8,372,509 Or say 51.59%
  • 35. • The project is designed taking CDM implementation in consideration & applied to LEED- Gold certification also. • Improved technologies are used to decrease the energy load on demand side of the system, which subsequently reduces the energy generation load on SEB (State Electricity Board). • A considerable energy saving more than 50% is achieved by appropriate planning & intelligent implementation of technologies, which is again a huge Economical influence. 5.2 Observations Chapter-5 CaseStudy-2
  • 36. Chapter-5 CaseStudy-3 5.3 OlympiaTech Park, Chennai Project Overview:  IT building situated in Chennai, developed by KhivrajTech Park Pvt. Ltd.  Applied for registration in 2008-09  LEED-Gold Rated Office Building ProjectTeam: Architects: RSPArchitects, Singapore Structural Consultants: M/s.Struarc - headed by Mr.T.M. Ramakrishnan, Civil Contractor: M/S. Consolidated Consortium Construction Ltd. HVAC Cosultants: AirTreatment Engineering Pvt. Ltd Energy Modeling: Environmental Design Solutions (EDS),New Delhi
  • 37. ProjectType Small Scale Project Activity (Energy Efficient Design Project – OLYMPIATECH PARK) Location Chennai,Tamilnadu Type Type-II Energy Efficiency Improvement Project Categories Project Category- II. E: Energy Efficiency and fuel switch measures for building Expected Energy Savings Under Category-II. E: up to 17.5 GWh per year Technologies Adopted Efficiency measures –demand side Applications adoption of high efficiency equipment, high efficiency materials, advanced control systems Project Duration 2+10 years Starting Date 17th Sept’07 CER Expected 15,073 tCO2 (per annum) CER Issued Under validation 5.3 Olympia Tech Park, Chennai
  • 38. Technologies Adopted: • wall construction – Materials with better insulation properties • roof construction – Over deck insulation and roof garden • Energy Efficient glass wall area - High performance glazing. Double glazed glass with low U-value, optimum light transmittance and optimum shading co-efficient • Energy Efficient design of the Heating Ventilation and Air-Conditioning (HVAC) system. This includes:  Efficient chillers – Higher Co-efficient of Performance chillers  Variable Frequency Drives (VFDs) for Air Handing Unit (AHU) fans and chilled water pumps  Heat recovery wheels Chapter-5 CaseStudy-3 5.3 OlympiaTech Park, Chennai
  • 39. Chapter-5 CaseStudy-3 5.3 Observations Emission Reductions S. No. Notation Parameter Unit Value 1 BEy Baseline Emissions tCO2 32022 2 PEy Project Emissions tCO2 16949 3 ERy (1-2) Emission Reductions tCO2 15073 The project cost was INR 400 crores, while to incorporate these efficient technologies only INR 18 crores more have to spent, which is less than 5% of the total project cost. It is observed that an additional cost of about Rs. 100/- per sq. ft. has been spent to make the building eligible to earn Carbon Credits. Project energy saving is approx. 47% to baseline building, which also promote energy saving on supply side of SEB, as well as significant reduction in fuel consumption.
  • 40. 6.1 Economic Analysis Chapter-6 Analysis CDM project cycle stages where costs are incurred Cost Estimates Pre-operational phase design PIN/PDD Preparation Rs. 50000/- Validation (to be paid to DOE) 5-12 % of CERValue Registration (to be paid to CDM EB) 2.25 to 2.50 Lakhs Operational phase Monitoring & Verification (to be paid to DOE) 5-12 % of CERValue Certification (to be paid to CDM EB) 2% of the CER value Risk mitigation 1% - 3% of CER value
  • 41. PROJECT NAME Initial Project Cost EXPECTED REVENUE THROUGH CERs (INR)* 5% CONSULTANT FEES (INR) Remarks ITC Sonar Bangla, Kolkata 59, 50, 000 14, 70, 000 73, 500 Features added later Technopolis IT Park, Kolkata N.A.** 65, 90, 000 3, 29, 500 incorporated at design stage OlympiaTech Park , Chennai N.A.** 1, 08, 50, 000 5, 42, 500 incorporated at design stage 6.1 Economic Analysis Chapter-6 Analysis * Revenues earned by selling one years CERs. **Costs incurred to incorporate more efficient technologies are not incorporated
  • 42. Project Name Extra Money Spent (INR) Revenues Earned (INR) Payback Period ITC Sonar Bangla, Kolkata 63, 23, 500 14, 71, 000 41/4Years Technopolis IT Park, Kolkata 6, 29, 500* 65, 90, 000 Less than 2 months** OlympiaTech Park , Chennai 8, 42, 500* 1, 08, 50, 000 Less than 2 months** * Only Documentation & fees charges are included **Costs incurred to incorporate more efficient technologies are not incorporated 6.1 Payback Calculation Chapter-6 Analysis
  • 43. 7.1 Energy Efficient Building: Making a Case Chapter-7 Conclusions Basic Building Information: Project taken: Airport Authority of India, Safdarjung, New Delhi Built-up Area & Floors: 20,000 Sq. ft. (G+2) HVAC System:Fully air conditioned (for 16 hrs occupancy) Project Implementation: Project Type: Small Scale Project Activity-Energy Efficiency Improvement Project Type &/Category: II/II-E Technologies to Implement (referTable 7.6): adoption of high efficiency equipment, high efficiency materials, advanced control systems Data needed: Climatic data of the city Energy Simulation through software (we considered Ecotect & Equest)
  • 44. Features Measure of Performance Existing (Baseline) Building Retrofitting Proposals Remarks Retrofitting Measures Adopted to reduce heat load in AAI Office, New Delhi Exterior Wall Construction Material Normal Mass Wall Autoclaved Aerated Concrete (AAC) blocks Reduction in designed heat load U-Value (Btu/hr.ft20F) 0.42 0.10 Table 7.6: Energy Efficient Measures Chapter-7 Energy Efficient Building: Making a Case
  • 45. Features Measure of Performance Existing (Baseline) Building Retrofitting Proposals Remarks Retrofitting Measures Adopted to reduce heat load in AAI Office, New Delhi GlassWall Exposure Material Plain Glass used Double glazed panels with Low “e”-glass panes Reduction in designed heat load U-Value (Btu/hr.ft20F) 1.30 on all sides 0.27 on all sides Shading Co-efficient 0.51 on all sides 0.15 on all sides LightTransmittance 70% on all sides 23% on north & 6% on other sides Table 7.6: Energy Efficient Measures Chapter-7 Energy Efficient Building: Making a Case
  • 46. Features Measure of Performance Existing (Baseline) Building Retrofitting Proposals Remarks Retrofitting Measures Adopted to reduce heat load in AAI Office, New Delhi Roof Insulation Material Truss Roof Making RCC roof with R-15 over-deck insulation. High reflective coating applied Reduction in designed heat load U-Value (Btu/hr.ft20F) 0.12 0.067 Terrace Garden Not provided Provided (which reduces heat island effect) Table 7.6: Energy Efficient Measures Chapter-7 Energy Efficient Building: Making a Case
  • 47. Features Measure of Performance Existing Building Retrofitting Proposals Remarks Retrofitting Measures Adopted to reduce heat load in AAI Office, New Delhi AHU No Heat Recovery Wheel (HRW) Heat Recovery Wheels (HRW) shall be provided Reduction in designed heat load Chillers Air cooled Chillers Replace them with water cooled chillers Reduction in Electricity Consumption COP 3.0 6.1 VFD in pumping System Not present Provided in both primary & secondary system Load Efficiency 1.10kW/TR 0.576 kW/TR Table 7.6: Energy Efficient Measures Chapter-7 Energy Efficient Building: Making a Case
  • 48. Alternative Electrical Plug Loads Chiller Plant Cooling Tower Chilled Water Circulation Pumps AHUs Total electricity consumption of the HVAC system per annum Existing Building 55679.70 109263.32 0.00 7421.11 46961.39 219325.51 AAI office building after project implementation 55679.70 35771.87 5355.57 1350.66 8018.16 106175.96 Net Energy Saving (KWh) 113149.55 51.58% TABLE 7.7: Electrical End-useTotals (kWh) Chapter-7 Energy Efficient Building: Making a Case
  • 49. TABLE 7.8: CER Calculations Chapter-7 Energy Efficient Building: Making a Case EHVAC,b-(in MWh/yr) in the baseline scenario 164 Top,HVAC,b – Operating hours 16 EHVAC,b,y – Electricity consumed by HVAC system (in MWh/yr) in year ‘y’(BaselineCase) 164 EHVAC, p, y – Electricity consumed after Project implementation in HVAC system (in MWh/yr) in year ‘y’ 50 Er,y – Reduction in electricity consumption compared to baseline building (MWh/Year) 113 Er,GRID,y – Reduced electricity drawal from the grid (MWh/year) 113 EFGRID,y – Emission Factor for electricity drawn from grid by Central ElectricityAuthority, Ministry of Power, Government of India 1.009 BEy – Baseline Emissions (in t CO2/annum) 114.17 Emission Reductions due to energy efficiency measures taken in the HVAC system of "AAI office" (in t CO2/annum) 114
  • 50. TABLE 7.9: Monetary Aspects of Project Implementation Chapter-7 Energy Efficient Building: Making a Case Before Project Implementation After Project Implementation Unit Rate (INR) Monetary Aspect (INR) Direct Saving (CER’s) Nil 114 CER 720 82000 Energy Consumption (KWh) 219325.51 106175.96 4.50 509000 Net Savings per year after Project implementation (INR) 591000
  • 51. 7.1.9: Observations Chapter-7 Energy Efficient Building: Making a Case  Project is able to earn 114 CER worth Rs. 82000/- after implementing the technologies.  Project implementation fees is Rs. 3.0 Lakhs (cost of retrofitting is not included), while direct savings are lower, hence it may not be feasible to apply for CDM implementation.  Either increasing the footprint of building or considering 5-10 such buildings as ONE Project activity .  Though both direct & indirect benefits are larger (Rs. 5.90 Lakhs) per year, hence;  If the fees bourne by UNFCCC for small projects can be eliminated, then the promoters may go for CDM implementation.
  • 52. 8.1.1 Conclusions (Potentials) Chapter-8 Conclusions  Building sector has a greater potential for the CDM applicability.  All the projects are also registered LEED-Certified projects.  Though there are investment barriers, technological barriers and most importantly barrier due to prevailing practices (due to lack of compulsory laws), through case studies it is observed that CDM application makes building:  More energy efficient (these savings are measurable)  Pays direct monetary benefits to the project developer.  CER value is increasing as yearly.  If the parameters are followed on an early design stage, payback period is quite small.
  • 53.  Hotel Sonar Bangla incorporated technologies only to make already available systems more efficient, which shows that retrofitting projects can also earn potential Carbon Credits in case of commercial buildings.  Though the payback period will be a little longer, but it brings additional benefits like energy savings, environmental benefits & a satisfaction towards contributing in sustainable development.  Energy consumption is reduced by approx. 50 % 8.1.1 Conclusions (Potentials….contd): Chapter-8 Conclusions
  • 54. 8.1.2 Conclusions (Barriers): Chapter-8 Conclusions  Dependency for cleaner technologies on developed nations & their high costs.  there are many buildings but as their footprint is quite low, CDM implementation is not feasible. (as we calculated aspects for AAI office building)  Many technologies & their aspects to save energy has to be taken care off in a building.  Time taken in registration is about 2 years, and possibilities of getting registration are depends upon strict monitoring processes.  Many different stakeholders involved in a building project, their coordination is a problem.
  • 55. Though there are barriers present in the building sector, the benefits are more (direct & indirect), (as we listed out through case studies). Besides all things it is more satisfactory as we can make a difference (and the difference will be huge), if we adopt the path of making world a sustainable & habitable place for us & for our future generations to come. CDM is a working & feasible solution 8.1.3 Conclusions Chapter-8 Conclusions
  • 56. 8.2 Future Scope of study Chapter-8 Conclusions As the talks are going on Execution Board (EB) level for ammendments;  Proposal of programmatic CDM  Reducing fee/ eliminating for SSC projects
  • 58. ABBREVIATIONS AAU Assigned Amount Unit BAU Business-as-Usual CDM Clean Development Mechanism CoP Conference of Parties to the UNFCCC CER Certified Emission Reductions COP Co-efficient of Performance DNA Designated National Authority DOEs Designated Operational Entities EB Executive Board EIA Environnemental Impact Assesment ERU Emission Réduction Unit ET Emissions Trading GEF Global Environmental Benefits GHG Green House Gases HCA Host Country Approval IEA International Energy Agency IPCC Intergovernmental Panel on Climate Change IETA International Emissions Trading Association KP Kyoto Protocol NGO Non-Governmental Organization PIN Project Idea Note PDD Project Design Document RMU Removal Units UNFCCC United Nation Framework Convention on Climate Change VVM Validation and Verification Manual GLOSSARY
  • 59. REFERENCES UNEP SBCI: The Kyoto Protocol, the Clean Development Mechanism, and the Building and Construction Sector Thomas Esdaile-Bouquet : Cogeneration Projects within the CDM Framework Martina Bosi, member of IEA,World Bank: (Published Papers to cut down Carbon Emission in Buildings) Executive Report, December 2007: Reducing U.S. Greenhouse Gas Emissions: How much & what cost? Websites: http://cdm.unfccc.int> UNFCCC http://cdmindia.nic.in > CDM India http://www.ipcc.ch/ > IPCC http://epaper.timesofindia.com/APD26302/PrintArt.asp > Copenhagen Summit http://www.grida.no/news/press/3350.aspx
  • 60. CONTENTS Chapter-1: Introduction 1-4 Introduction Need of Study Aims & Objectives Scope of Study Methodology Chapter-2: Literature Review 5-10 Published & Unpublished Literature Chapter-3: Carbon trading to mitigate Global warming 11-27 GlobalWarming & its impact on Environment Kyoto (mechanism) Protocol CarbonTrading UNFCCC Clean Development Mechanism Status of Registered Projects Indian Building Industry
  • 61. Chapter-4: Energy Efficiency & CDM in Buildings 28-37 CDM & Building Industry Energy Efficiency in Buildings through CDM CDM project cycle Concept of Additionality Chapter-5: Case Studies 38-55 ITC Sonar Hotel, Kolkata Technopolis, Kolkata Olympia,Chennai Chapter-6: Analysis 56-59 EconomicAnalysis Methods chose for EconomicAnalysis Costs RelatedTo CDM Application Observations FromThe Analysis CONTENTS
  • 62. Chapter-7: Energy Efficiency Report; Making a Case 60-80 AirportAuthority of India, Safdarjung, New Delhi Thermal Analysis Thermal Analysis Results Making of Case Observations Chapter-8: Conclusions 81-82 References Appendix-A: SSC PDD Form MONITORING REPORT: ITC Sonar Bangla, Kolkata CONTENTS
  • 63. CDM is an aspect (through which developing countries may participate in KP) which leads a way to control it, without compromising development. 1.1 NEED OF STUDY Chapter-1 38% 35% 27% Energy Consumption Building Industry Transportation Source: (UNEP, 2007,World BusinessCouncil for Sustainable Development (WBCSD), 2007, deT'Serclaes, 2007).
  • 65. 3.3 GREEN HOUSE GASES TABLE-2.1 Green House Gas (GHG) GlobalWarming Potential (GWP) Key Industrial Sources Carbon-di-oxide (CO2) 1 Combustion of fossil fuels; cement manufacture Methane (CH4) 21 Oil & gas extraction and processing; mining; landfills; wastewater Nitrous oxide (N2O) 310 Adipic acid and nitric acid production; wastewater treatment Per fluoro carbon (PFCs) 560-9,200 Refrigerant manufacture and use; Al and Mg smelting Hydro fluoro carbon (HFCs) 140-11,700 Refrigerant manufacture and use Sulphur hexa fluoride (SF6) Above 10,000 (Approx. 22,900) Al and Mg smelting; high voltage electrical switching equipment Source: UNFCCC Chapter-3
  • 66. Scale Registered Projects LARGE 1136 SMALL 908 Registered project activities by scale. Total: 1,899 As on 16.11.2009 As on 12.02.2010 Registered Projects: BY SCALE Source: UNFCCC Chapter-3
  • 67. As on 12.02.2010 As on 16.11.2009 Registered Projects: BY SCOPE Sector Registered Projects Energy industries 1502 Waste handling and disposal 458 Energy demand 25 Construction 0 Source: UNFCCC Chapter-3
  • 68. Registered project activities by Host Party. Total: 1,899 As on 16.11.2009 As on 12.02.2010 Country No. Of Projects China 741 India 484 Brazil 168 Registered Projects: BY HOST PARTY Source: UNFCCC Chapter-3
  • 69. Country CERs China 179,528,995 India 74,464,962 Republic of Korea 49,809,792 Brazil 38,050,351 CERs ISSUED, BY HOST PARTY As on 12.02.2010 Source: UNFCCC Chapter-3
  • 70. 1. Planning a CDM project CDM project participants plan a CDM project activity  There are several conditions in order to be registered as a CDM project activity and CDM project participants should consider those conditions form a planning stage 2. Prepare the project design document (PDD) CDM project participants prepare the project design document (PDD) for a CDM project activity  There is the standard format for the PDD and CDM project participants must fill in all the contents as necessary 4.3 CDM Project Cycle…(contd.)
  • 71. 3. Getting approval from host Party and Annex I Party CDM project participants shall get written approvals of voluntary participation form the designated national authority (DNA) of a host Party and an Annex I Party  The written approval from host Party should include confirmation by the host Party that a project activity assists it in achieving sustainable development.  The details of approval procedure is up to each Party 4.Validation and registration Process of independent evaluation of a project activity against the requirements of the CDM on the basis of the PDD.  Validation is carried out by a designed operational entity (DOE), which shall be different from first.  There is a formal procedure for validation. Registration is the formal acceptance of a validated project as a CDM project activity.  Registration is done by the CDM Executive Board.  There is a formal procedure for registration. 4.3 CDM Project Cycle …(contd.)
  • 72. 5. Monitoring a CDM project activity CDM project participants collect and archive all relevant data necessary for calculating GHG emission reductions by a CDM project activity, in accordance with the monitoring plan written in the PDD. 6.Verification and certification Verification is the periodic independent review and ex post determination of the monitored GHG emission reductions  Verification is carried out by a designated operational entity (DOE).  There is a formal procedure for verification. Certification is the written assurance by a DOE that a project activity achieved the reductions in GHG emissions as verified.  A DOE also does certification. 4.3 CDM Project Cycle …(contd.)
  • 73. 7. Issuance of CERs The EB will issue CERs equal to the verified amount of GHG emission reductions. • GHG emission reductions since 2000 may be eligible to claim CERs. Among issued CERs;  2% for “the share of proceeds” to assist developing countries that are particularly vulnerable to climate change.  X% for “the share of proceeds” to cover administrative expenses of the CDM. • The CoP upon the recommendation of the EB shall determine the value of X. 8. Distribution of CERs CERs will be distributed among CDM project participants  The decision on the distribution of CERs from a CDM project activity shall exclusively be taken by project participants. 4.3 CDM Project Cycle …(contd.)

Editor's Notes

  1. Due to industrialization world is now a small village. But as nothing comes for free, it brought its side effects in the form of global warming, which is the biggest worry of this century. We all are aware of increasing temperature of earth, melting of glaciers, increasing sea level, sudden change in climatic conditions etc., these all are byproducts of this global warming. To stop these prolonged effects on our environment an international summit took place in Kyoto, Japan in 1997. There all developed & developing countries agreed to control it through an international agreement, “Kyoto Protocol” (KP) forming “United Nations Framework Convention on Climate Change” (UNFCCC) to take care of the issue. Buildings are the largest energy consumers & thus has a great opportunity, by using available resources meaningfully & reducing emissions, to achieve certain carbon credits under “Clean Development Mechanism” (CDM). This report analyses the scope, barriers and the potential of CDM projects in construction industry in India with reference to current industry trends and developments.
  2. Building Construction sector has a greater potential towards participating in “KP”, as it consumes approx. one third of the total energy produced.* In Indian conditions it has more relevance as ours are developing country. Building construction is on boom & thus by using clean technologies not only we can save energy & our environment, but also we can make money out of it. It is estimated that by the year 2050, residential, commercial and institutional buildings will consume as much as 38 per cent of the global energy production and release about 3,800 megatons of carbon into the atmosphere.