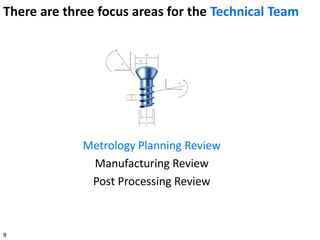
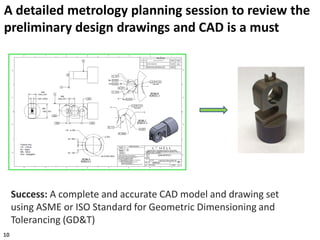
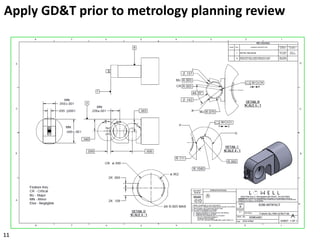
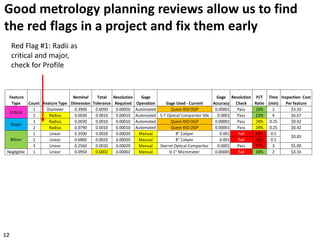
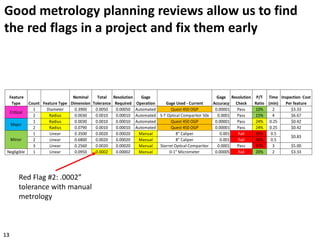
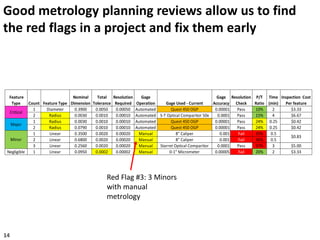
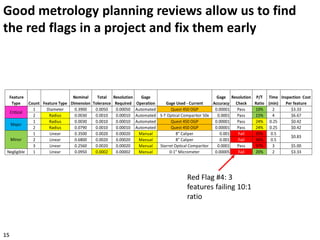
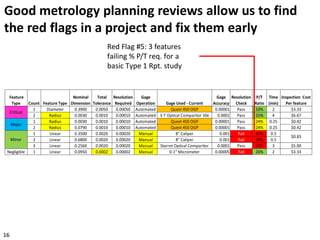
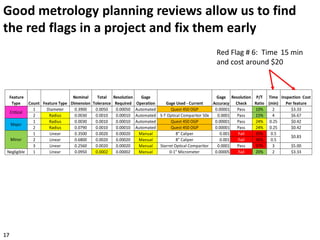
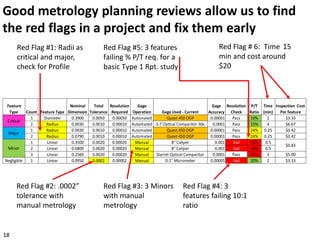
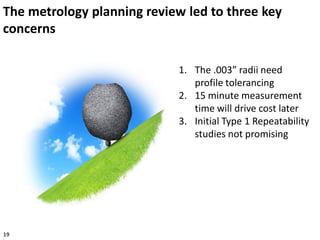
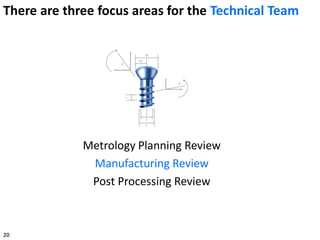
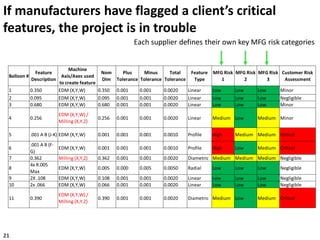
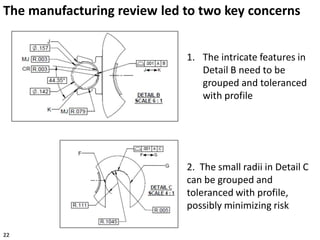
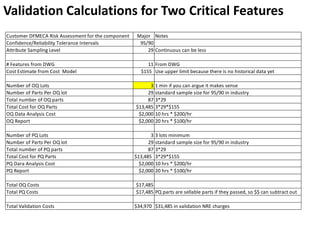
Edward Jaeck
V.P. of Operations
Lowell Inc.
Minneapolis, MN
June 14, 2017
Data Driven Design for Manufacturability –
From Validation to PPAP
3
#1 Technical
#2 Commercial
#3 Regulatory
This presentation will focus on three key aspects of
Design for Manufacturing (DFM)
Executive Business Team
Program Management Office
Regulatory Affairs
Reimbursement
Legal
Operations
Post Market Quality
4
The Regulatory Team consists of the following:
Strategic Sourcing
Technical Sourcing
Commodity Specialists
Purchasing
Buyers
Planners
5
The Commercial Team consists of the following:
R&D
Clinical
Design
Manufacturing
Quality
Supplier Quality
6
The Technical Team consists of the following:
Quick and easy napkin
sketches to show basic idea
Rev 1 Drawings to work
through functional
relationships of features
Post validation formally
released drawings
Technical Team:
There is more to design than concept sketches
7
The amount of work to go from concept sketches
to final drawings is not linear
8
Metrology Planning Review
Manufacturing Review
Post Processing Review
9
There are three focus areas for the Technical Team
10
Success: A complete and accurate CAD model and drawing set
using ASME or ISO Standard for Geometric Dimensioning and
Tolerancing (GD&T)
A detailed metrology planning session to review the
preliminary design drawings and CAD is a must
Apply GD&T prior to metrology planning review
11
Good metrology planning reviews allow us to find
the red flags in a project and fix them early
Feature
Type Count Feature Type
Nominal
Dimension
Total
Tolerance
Resolution
Required
Gage
Operation Gage Used - Current
Gage
Accuracy
Resolution
Check
P/T
Ratio
Time
(min)
Inspection Cost
Per feature
1 Diameter 0.3900 0.0050 0.00050 Automated Quest 450 OGP 0.00001 Pass 10% 2 $3.33
2 Radius 0.0030 0.0010 0.00010 Automated S-T Optical Comparitor 50x 0.0001 Pass 15% 4 $6.67
1 Radius 0.0030 0.0010 0.00010 Automated Quest 450 OGP 0.00001 Pass 24% 0.25 $0.42
2 Radius 0.0790 0.0010 0.00010 Automated Quest 450 OGP 0.00001 Pass 24% 0.25 $0.42
1 Linear 0.3500 0.0020 0.00020 Manual 8" Caliper 0.001 Fail 35% 0.5
2 Linear 0.6800 0.0020 0.00020 Manual 8" Caliper 0.001 Fail 36% 0.5
3 Linear 0.2560 0.0020 0.00020 Manual Starret Optical Comparitor 0.0001 Pass 37% 3 $5.00
Negligible 1 Linear 0.0950 0.0002 0.00002 Manual 0-1" Micrometer 0.00005 Fail 20% 2 $3.33
$0.83
Minor
Major
Critical
Red Flag #1: Radii as
critical and major,
check for Profile
12
Good metrology planning reviews allow us to find
the red flags in a project and fix them early
Feature
Type Count Feature Type
Nominal
Dimension
Total
Tolerance
Resolution
Required
Gage
Operation Gage Used - Current
Gage
Accuracy
Resolution
Check
P/T
Ratio
Time
(min)
Inspection Cost
Per feature
1 Diameter 0.3900 0.0050 0.00050 Automated Quest 450 OGP 0.00001 Pass 10% 2 $3.33
2 Radius 0.0030 0.0010 0.00010 Automated S-T Optical Comparitor 50x 0.0001 Pass 15% 4 $6.67
1 Radius 0.0030 0.0010 0.00010 Automated Quest 450 OGP 0.00001 Pass 24% 0.25 $0.42
2 Radius 0.0790 0.0010 0.00010 Automated Quest 450 OGP 0.00001 Pass 24% 0.25 $0.42
1 Linear 0.3500 0.0020 0.00020 Manual 8" Caliper 0.001 Fail 35% 0.5
2 Linear 0.6800 0.0020 0.00020 Manual 8" Caliper 0.001 Fail 36% 0.5
3 Linear 0.2560 0.0020 0.00020 Manual Starret Optical Comparitor 0.0001 Pass 37% 3 $5.00
Negligible 1 Linear 0.0950 0.0002 0.00002 Manual 0-1" Micrometer 0.00005 Fail 20% 2 $3.33
$0.83
Minor
Major
Critical
Red Flag #2: .0002”
tolerance with manual
metrology
13
Good metrology planning reviews allow us to find
the red flags in a project and fix them early
Feature
Type Count Feature Type
Nominal
Dimension
Total
Tolerance
Resolution
Required
Gage
Operation Gage Used - Current
Gage
Accuracy
Resolution
Check
P/T
Ratio
Time
(min)
Inspection Cost
Per feature
1 Diameter 0.3900 0.0050 0.00050 Automated Quest 450 OGP 0.00001 Pass 10% 2 $3.33
2 Radius 0.0030 0.0010 0.00010 Automated S-T Optical Comparitor 50x 0.0001 Pass 15% 4 $6.67
1 Radius 0.0030 0.0010 0.00010 Automated Quest 450 OGP 0.00001 Pass 24% 0.25 $0.42
2 Radius 0.0790 0.0010 0.00010 Automated Quest 450 OGP 0.00001 Pass 24% 0.25 $0.42
1 Linear 0.3500 0.0020 0.00020 Manual 8" Caliper 0.001 Fail 35% 0.5
2 Linear 0.6800 0.0020 0.00020 Manual 8" Caliper 0.001 Fail 36% 0.5
3 Linear 0.2560 0.0020 0.00020 Manual Starret Optical Comparitor 0.0001 Pass 37% 3 $5.00
Negligible 1 Linear 0.0950 0.0002 0.00002 Manual 0-1" Micrometer 0.00005 Fail 20% 2 $3.33
$0.83
Minor
Major
Critical
Red Flag #3: 3 Minors
with manual
metrology
14
Good metrology planning reviews allow us to find
the red flags in a project and fix them early
Feature
Type Count Feature Type
Nominal
Dimension
Total
Tolerance
Resolution
Required
Gage
Operation Gage Used - Current
Gage
Accuracy
Resolution
Check
P/T
Ratio
Time
(min)
Inspection Cost
Per feature
1 Diameter 0.3900 0.0050 0.00050 Automated Quest 450 OGP 0.00001 Pass 10% 2 $3.33
2 Radius 0.0030 0.0010 0.00010 Automated S-T Optical Comparitor 50x 0.0001 Pass 15% 4 $6.67
1 Radius 0.0030 0.0010 0.00010 Automated Quest 450 OGP 0.00001 Pass 24% 0.25 $0.42
2 Radius 0.0790 0.0010 0.00010 Automated Quest 450 OGP 0.00001 Pass 24% 0.25 $0.42
1 Linear 0.3500 0.0020 0.00020 Manual 8" Caliper 0.001 Fail 35% 0.5
2 Linear 0.6800 0.0020 0.00020 Manual 8" Caliper 0.001 Fail 36% 0.5
3 Linear 0.2560 0.0020 0.00020 Manual Starret Optical Comparitor 0.0001 Pass 37% 3 $5.00
Negligible 1 Linear 0.0950 0.0002 0.00002 Manual 0-1" Micrometer 0.00005 Fail 20% 2 $3.33
$0.83
Minor
Major
Critical
Red Flag #4: 3
features failing 10:1
ratio
15
Good metrology planning reviews allow us to find
the red flags in a project and fix them early
Feature
Type Count Feature Type
Nominal
Dimension
Total
Tolerance
Resolution
Required
Gage
Operation Gage Used - Current
Gage
Accuracy
Resolution
Check
P/T
Ratio
Time
(min)
Inspection Cost
Per feature
1 Diameter 0.3900 0.0050 0.00050 Automated Quest 450 OGP 0.00001 Pass 10% 2 $3.33
2 Radius 0.0030 0.0010 0.00010 Automated S-T Optical Comparitor 50x 0.0001 Pass 15% 4 $6.67
1 Radius 0.0030 0.0010 0.00010 Automated Quest 450 OGP 0.00001 Pass 24% 0.25 $0.42
2 Radius 0.0790 0.0010 0.00010 Automated Quest 450 OGP 0.00001 Pass 24% 0.25 $0.42
1 Linear 0.3500 0.0020 0.00020 Manual 8" Caliper 0.001 Fail 35% 0.5
2 Linear 0.6800 0.0020 0.00020 Manual 8" Caliper 0.001 Fail 36% 0.5
3 Linear 0.2560 0.0020 0.00020 Manual Starret Optical Comparitor 0.0001 Pass 37% 3 $5.00
Negligible 1 Linear 0.0950 0.0002 0.00002 Manual 0-1" Micrometer 0.00005 Fail 20% 2 $3.33
$0.83
Minor
Major
Critical
Red Flag #5: 3 features
failing % P/T req. for a
basic Type 1 Rpt. study
16
Good metrology planning reviews allow us to find
the red flags in a project and fix them early
Feature
Type Count Feature Type
Nominal
Dimension
Total
Tolerance
Resolution
Required
Gage
Operation Gage Used - Current
Gage
Accuracy
Resolution
Check
P/T
Ratio
Time
(min)
Inspection Cost
Per feature
1 Diameter 0.3900 0.0050 0.00050 Automated Quest 450 OGP 0.00001 Pass 10% 2 $3.33
2 Radius 0.0030 0.0010 0.00010 Automated S-T Optical Comparitor 50x 0.0001 Pass 15% 4 $6.67
1 Radius 0.0030 0.0010 0.00010 Automated Quest 450 OGP 0.00001 Pass 24% 0.25 $0.42
2 Radius 0.0790 0.0010 0.00010 Automated Quest 450 OGP 0.00001 Pass 24% 0.25 $0.42
1 Linear 0.3500 0.0020 0.00020 Manual 8" Caliper 0.001 Fail 35% 0.5
2 Linear 0.6800 0.0020 0.00020 Manual 8" Caliper 0.001 Fail 36% 0.5
3 Linear 0.2560 0.0020 0.00020 Manual Starret Optical Comparitor 0.0001 Pass 37% 3 $5.00
Negligible 1 Linear 0.0950 0.0002 0.00002 Manual 0-1" Micrometer 0.00005 Fail 20% 2 $3.33
$0.83
Minor
Major
Critical
Red Flag # 6: Time 15 min
and cost around $20
17
Good metrology planning reviews allow us to find
the red flags in a project and fix them early
Feature
Type Count Feature Type
Nominal
Dimension
Total
Tolerance
Resolution
Required
Gage
Operation Gage Used - Current
Gage
Accuracy
Resolution
Check
P/T
Ratio
Time
(min)
Inspection Cost
Per feature
1 Diameter 0.3900 0.0050 0.00050 Automated Quest 450 OGP 0.00001 Pass 10% 2 $3.33
2 Radius 0.0030 0.0010 0.00010 Automated S-T Optical Comparitor 50x 0.0001 Pass 15% 4 $6.67
1 Radius 0.0030 0.0010 0.00010 Automated Quest 450 OGP 0.00001 Pass 24% 0.25 $0.42
2 Radius 0.0790 0.0010 0.00010 Automated Quest 450 OGP 0.00001 Pass 24% 0.25 $0.42
1 Linear 0.3500 0.0020 0.00020 Manual 8" Caliper 0.001 Fail 35% 0.5
2 Linear 0.6800 0.0020 0.00020 Manual 8" Caliper 0.001 Fail 36% 0.5
3 Linear 0.2560 0.0020 0.00020 Manual Starret Optical Comparitor 0.0001 Pass 37% 3 $5.00
Negligible 1 Linear 0.0950 0.0002 0.00002 Manual 0-1" Micrometer 0.00005 Fail 20% 2 $3.33
$0.83
Minor
Major
Critical
Red Flag #1: Radii as
critical and major,
check for Profile
Red Flag #2: .0002”
tolerance with
manual metrology
Red Flag #3: 3 Minors
with manual
metrology
Red Flag #4: 3
features failing 10:1
ratio
Red Flag #5: 3 features
failing % P/T req. for a
basic Type 1 Rpt. study
Red Flag # 6: Time 15
min and cost around
$20
18
The metrology planning review led to three key
concerns
1. The .003” radii need
profile tolerancing
2. 15 minute measurement
time will drive cost later
3. Initial Type 1 Repeatability
studies not promising
19
Metrology Planning Review
Manufacturing Review
Post Processing Review
20
There are three focus areas for the Technical Team
If manufacturers have flagged a client’s critical
features, the project is in trouble
Each supplier defines their own key MFG risk categories
21
Balloon #
Feature
Description
Machine
Axis/Axes used
to create feature
Nom
Dim
Plus
Tolerance
Minus
Tolerance
Total
Tolerance
Feature
Type
MFG Risk
1
MFG Risk
2
MFG Risk
3
Customer Risk
Assessment
1 0.350 EDM (X,Y,W) 0.350 0.001 0.001 0.0020 Linear Low Low Low Minor
2 0.095 EDM (X,Y,W) 0.095 0.001 0.001 0.0020 Linear Low Low Low Negligible
3 0.680 EDM (X,Y,W) 0.680 0.001 0.001 0.0020 Linear Low Low Low Minor
4 0.256
EDM (X,Y,W) /
Milling (X,Y,Z)
0.256 0.001 0.001 0.0020 Linear Medium Low Medium Minor
5 .001 A B (J-K) EDM (X,Y,W) 0.001 0.001 0.001 0.0010 Profile High Medium Medium Critical
6
.001 A B (F-
G)
EDM (X,Y,W) 0.001 0.001 0.001 0.0010 Profile High Low Medium Critical
7 0.362 Milling (X,Y,Z) 0.362 0.001 0.001 0.0020 Diametric Medium Medium Medium Negligible
8
4x R.005
Max
EDM (X,Y,W) 0.005 0.000 0.005 0.0050 Radial Low Low Low Negligible
9 2X .108 EDM (X,Y,W) 0.108 0.001 0.001 0.0020 Linear Low Low Low Negligible
10 2x .066 EDM (X,Y,W) 0.066 0.001 0.001 0.0020 Linear Low Low Low Negligible
11 0.390
EDM (X,Y,W) /
Milling (X,Y,Z)
0.390 0.001 0.001 0.0020 Diametric Medium Low Medium Critical
The manufacturing review led to two key concerns
1. The intricate features in
Detail B need to be
grouped and toleranced
with profile
22
2. The small radii in Detail C
can be grouped and
toleranced with profile,
possibly minimizing risk
Metrology Planning Review
Manufacturing Review
Post Processing Review
(Color Anodizing)
23
There are three focus areas for the Technical Team
Some “interference” colors are challenging to make
• Color choice drives cost. Purple and Seafoam have ~ +/- 1V range and thus higher cost
• * Images used with permission from American Bright Works in Fridley, MN
• http://americanbrightworks.com
24
Surface cleanliness is important in color anodizing
Remove oils & contamination on surfaces & in deep nooks
25
Chemical deburring is helpful before color anodizing
• Run cost model with and without deburring
• Adjust tolerances for chemical deburring
26
Masking parts is manual and adds cost
Parts requiring individual masking – whether they are single color or multi-color
increases handling charges, time to process and therefore cost ~10-15% adder.
27
Color anodizing the entire component minimizes cost
Simplified design with no masking or blind holes
28
The post processing review led to two key concerns
29
1. A cleaning step needs to be added to the
process flow to ensure removal of surface oils
2. The part will remain one color to
minimize cost
Cost Modeling
30
There is one focus for the Commercial Team
31
Commercial Team:
It only takes one excitement feature to make a
commodity component a specialty component.
With specialty components, the commercial team
should focus on cost-modeling of the process
32
Build the simple should-cost model first…
33
Process Step Dist Type
Mean Time Per
Unit in Mins Lower Upper Stdev $/hour $/min Price/unit with Milling
Ti-6Al-4V ELI raw material cost Normal 5.00 5 0.5 N/A N/A 5.00$
Verify Incoming Raw Material Uniform 15.00 10 20 $ 75 1.25$ 18.75$
Saw Uniform 7.50 5 10 $ 75 1.25$ 9.38$
Mill Uniform 8.00 6 10 $ 100 1.67$ 13.33$
EDM normal 7.00 7 1 $ 100 1.67$ 11.67$
Dim Inspection Uniform 15.00 10 20 $ 100 1.67$ 25.00$
OSP Uniform 10.00 8 12 $ 75 1.25$ 12.50$
Final Inspection Uniform 14.00 8 20 $ 100 1.67$ 23.33$
118.96$
$/Hour numbers are simple placeholders
Build the simple should-cost model first…
Should-Cost model ~ Process Flow + Activity-Based Costing
Step 1: Build basic deterministic model in Excel
Step 2: Add variation to the model by replacing static point estimates with
stochastic functions. Use historical data and process knowledge to pick
distributions
Step 3: Run the Monte Carlo simulation and check the mean and range
assumptions
Step 4: Run and review the sensitivity analysis to find key cost drivers34
Process Step Dist Type
Mean Time Per
Unit in Mins Lower Upper Stdev $/hour $/min Price/unit with Milling
Ti-6Al-4V ELI raw material cost Normal 5.00 5 0.5 N/A N/A 5.00$
Verify Incoming Raw Material Uniform 15.00 10 20 $ 75 1.25$ 18.75$
Saw Uniform 7.50 5 10 $ 75 1.25$ 9.38$
Mill Uniform 8.00 6 10 $ 100 1.67$ 13.33$
EDM normal 7.00 7 1 $ 100 1.67$ 11.67$
Dim Inspection Uniform 15.00 10 20 $ 100 1.67$ 25.00$
OSP Uniform 10.00 8 12 $ 75 1.25$ 12.50$
Final Inspection Uniform 14.00 8 20 $ 100 1.67$ 23.33$
118.96$
$/Hour numbers are simple placeholders
In step 3, run the simulation and check the mean
value assumptions
Output for cost appears normal which should be assumed
based on central limit theorem, with a mean value ~$119
35
In step 3, run the simulation and check the range
assumptions
If you were the supplier, which cost would you
provide to the customer without any historical data?
36
In step 4, run the sensitivity analysis to find the key
cost drivers
Inspection costs are the key cost drivers at this point, work with the technical team
to learn more about ways to drive costs down.
37
Fix root causes of the variation in inspection steps
Start with conservative distribution assumptions and tighten them based on data
38
Seek to combine processing steps if ideal
Warning: Combining process steps is not always ideal.
Base the decision on data.
39
Review what features are created with milling
40
Balloon #
Feature
Description
Machine
Axis/Axes used
to create feature
Nom
Dim
Plus
Tolerance
Minus
Tolerance
Total
Tolerance
Feature
Type
1 0.350 EDM (X,Y,W) 0.350 0.001 0.001 0.0020 Linear
2 0.095 EDM (X,Y,W) 0.095 0.001 0.001 0.0020 Linear
3 0.680 EDM (X,Y,W) 0.680 0.001 0.001 0.0020 Linear
4 0.256
EDM (X,Y,W) /
Milling (X,Y,Z)
0.256 0.001 0.001 0.0020 Linear
5 .001 A B (J-K) EDM (X,Y,W) 0.001 0.001 0.001 0.0010 Profile
6
.001 A B (F-
G)
EDM (X,Y,W) 0.001 0.001 0.001 0.0010 Profile
7 0.362 Milling (X,Y,Z) 0.362 0.001 0.001 0.0020 Diametric
8
4x R.005
Max
EDM (X,Y,W) 0.005 0.000 0.005 0.0050 Radial
9 2X .108 EDM (X,Y,W) 0.108 0.001 0.001 0.0020 Linear
10 2x .066 EDM (X,Y,W) 0.066 0.001 0.001 0.0020 Linear
11 0.390
EDM (X,Y,W) /
Milling (X,Y,Z)
0.390 0.001 0.001 0.0020 Diametric
41
The right graph in the right software is crucial
Combining milling and EDM steps increases
mean cost by ~ $8.30
The commercial review led to two key concerns
1. Inspections costs are the
key cost drivers
42
2. Combining milling and
EDM is not cost effective
Minimize complexity
43
There is one focus for the Regulatory Team
Commercial Team
at Impasse HereTechnical Team
Lost Here
Regulatory Team driving
from the center
or
Technical, Commercial and
Regulatory Teams moving
efficiently through the
maze together
44
Regulatory Team:
The regulatory agencies give the requirements but
the complexity is controlled by the regulatory team
Always think about the validation complexity
Note: Drawings stay preliminary until post validation
45
46
When it comes to validation planning, define the
ends of the goalpost first, then work in from there
All features
are critical
No features
are critical
47
Proactively define the feature risk classifications
Minimize A/B where:
A= the number of critical features
B = the number of negligible features
48
To establish the validation cost baseline, assume no
features are critical
No features
are critical
Total OQ Costs $15,485
Total PQ Costs $15,485
Total Validation Costs $30,970
49
To see how complex the validation can get, next
assume all features are critical
All features
are critical
Total OQ Costs $17,485
Total PQ Costs $17,485
Total Validation Costs $34,970
Driving design to two critical features saves money
while balancing validation risk
50
The regulatory review led to four concerns
1. Feature risk classification
modulates sample size and
cost
2. Use of profile on feature 6
moves it from critical to
negligible
3. Using 2 critical features
balanced risk and validation
cost
4. Feature risk classification
ratio = 2/6 or 33% not ideal
51
Balloon #
Feature
Description
Feature
Risk
1 0.350 Minor
2 0.095 Negligible
3 0.680 Minor
4 0.256 Minor
5 .001 A B (J-K) Critical
6 .001 A B (F-G) Negligible
7 0.362 Negligible
8 4x R.005 Max Negligible
9 2X .108 Negligible
10 2x .066 Negligible
11 0.390 Critical
52
#1 Technical
Metrology Review
Manufacturing Review
Post Processing Review
#2 Commercial
Process Mapping
Should-Cost Modeling
Monte-Carlo Simulation
#3 Regulatory
Product/Component Strategic Planning
Product/Component Validation Planning
This presentation focused on three key aspects of
Design for Manufacturing (DFM)
53
There are three key DFM teams, all must execute to
enable project success.
Questions?
54
Acknowledgements
Assertion-Evidence Template:
• http://writing.engr.psu.edu
Graphics Support:
• Edward Britz
• www.edwardbritz.com
Presentation Support:
• Christine Haas
• http://christinehaasconsulting.com
Monte Carlo Software:
• @RISK by Palisade Corporation
• http://www.palisade.com/risk
Lowell Dimensional Lab Built by:
• Precision Environments
• http://precisionenvironmentsinc.com
Automated OQ/PQ Minitab Macro Creation:
• Mercer Quality Consulting, LLC
• http://MercerQualityConsulting.com
Appendix
Lowell’s Newly Completed Quality Lab
Temperature:
20 degrees C +/- 0.5 degrees C
Humidity:
45% RH +/- 5% RH
New Equipment:
Based on customer needs
Customer DFMECA Risk Assessment for the component Major Notes
Confidence/Reliability Tolerance Intervals 95/90
Attribute Sampling Level 29 Continuous can be less
# Features from DWG 11 From DWG
Cost Estimate from Cost Model $155 Use upper limit because there is no historical data yet
Number of OQ Lots 3 1 min if you can argue it makes sense
Number of Parts Per OQ lot 29 standard sample size for 95/90 in industry
Total number of OQ parts 87 3*29
Total Cost for OQ Parts $13,485 3*29*$155
OQ Data Analysis Cost $500 5 hrs * $100/hr
OQ Report $1,500 15 hrs * $100/hr
Number of PQ Lots 3 3 lots minimum
Number of Parts Per OQ lot 29 standard sample size for 95/90 in industry
Total number of PQ parts 87 3*29
Total Cost for PQ Parts $13,485 3*29*$155
PQ Dara Analysis Cost $500 5 hrs * $100/hr
PQ Report $1,500 15 hrs * $100/hr
Total OQ Costs $15,485
Total PQ Costs $15,485 PQ parts are sellable parts if they passed, so $$ can subtract out
Total Validation Costs $30,970 $31,485 in validation NRE charges
Validation Calculations for No Critical Features
Customer DFMECA Risk Assessment for the component Major Notes
Confidence/Reliability Tolerance Intervals 95/90
Attribute Sampling Level 29 Continuous can be less
# Features from DWG 11 From DWG
Cost Estimate from Cost Model $155 Use upper limit because there is no historical data yet
Number of OQ Lots 3 1 min if you can argue it makes sense
Number of Parts Per OQ lot 29 standard sample size for 95/90 in industry
Total number of OQ parts 87 3*29
Total Cost for OQ Parts $13,485 3*29*$155
OQ Dara Analysis Cost $6,000 30 hrs * $200/hr
OQ Report $3,000 30 hrs * $100/hr
Number of PQ Lots 3 3 lots minimum
Number of Parts Per OQ lot 29 standard sample size for 95/90 in industry
Total number of PQ parts 87 3*29
Total Cost for PQ Parts $13,485 3*29*$155
PQ Dara Analysis Cost $6,000 30 hrs * $200/hr
PQ Report $3,000 30 hrs * $100/hr
Total OQ Costs $22,485
Total PQ Costs $22,485 PQ parts are sellable parts if they passed, so $$ can subtract out
Total Validation Costs $44,970 $31,485 in validation NRE charges
Validation Calculations for All Features Critical
Validation Calculations for Two Critical Features
Customer DFMECA Risk Assessment for the component Major Notes
Confidence/Reliability Tolerance Intervals 95/90
Attribute Sampling Level 29 Continuous can be less
# Features from DWG 11 From DWG
Cost Estimate from Cost Model $155 Use upper limit because there is no historical data yet
Number of OQ Lots 3 1 min if you can argue it makes sense
Number of Parts Per OQ lot 29 standard sample size for 95/90 in industry
Total number of OQ parts 87 3*29
Total Cost for OQ Parts $13,485 3*29*$155
OQ Data Analysis Cost $2,000 10 hrs * $200/hr
OQ Report $2,000 20 hrs * $100/hr
Number of PQ Lots 3 3 lots minimum
Number of Parts Per OQ lot 29 standard sample size for 95/90 in industry
Total number of PQ parts 87 3*29
Total Cost for PQ Parts $13,485 3*29*$155
PQ Dara Analysis Cost $2,000 10 hrs * $200/hr
PQ Report $2,000 20 hrs * $100/hr
Total OQ Costs $17,485
Total PQ Costs $17,485 PQ parts are sellable parts if they passed, so $$ can subtract out
Total Validation Costs $34,970 $31,485 in validation NRE charges
Data Driven Design for Manufacturability – From Validation to PPAP - OMTEC 2017

Data Driven Design for Manufacturability – From Validation to PPAP - OMTEC 2017

  • 2.
    Edward Jaeck V.P. ofOperations Lowell Inc. Minneapolis, MN June 14, 2017 Data Driven Design for Manufacturability – From Validation to PPAP
  • 3.
    3 #1 Technical #2 Commercial #3Regulatory This presentation will focus on three key aspects of Design for Manufacturing (DFM)
  • 4.
    Executive Business Team ProgramManagement Office Regulatory Affairs Reimbursement Legal Operations Post Market Quality 4 The Regulatory Team consists of the following:
  • 5.
    Strategic Sourcing Technical Sourcing CommoditySpecialists Purchasing Buyers Planners 5 The Commercial Team consists of the following:
  • 6.
  • 7.
    Quick and easynapkin sketches to show basic idea Rev 1 Drawings to work through functional relationships of features Post validation formally released drawings Technical Team: There is more to design than concept sketches 7
  • 8.
    The amount ofwork to go from concept sketches to final drawings is not linear 8
  • 9.
    Metrology Planning Review ManufacturingReview Post Processing Review 9 There are three focus areas for the Technical Team
  • 10.
    10 Success: A completeand accurate CAD model and drawing set using ASME or ISO Standard for Geometric Dimensioning and Tolerancing (GD&T) A detailed metrology planning session to review the preliminary design drawings and CAD is a must
  • 11.
    Apply GD&T priorto metrology planning review 11
  • 12.
    Good metrology planningreviews allow us to find the red flags in a project and fix them early Feature Type Count Feature Type Nominal Dimension Total Tolerance Resolution Required Gage Operation Gage Used - Current Gage Accuracy Resolution Check P/T Ratio Time (min) Inspection Cost Per feature 1 Diameter 0.3900 0.0050 0.00050 Automated Quest 450 OGP 0.00001 Pass 10% 2 $3.33 2 Radius 0.0030 0.0010 0.00010 Automated S-T Optical Comparitor 50x 0.0001 Pass 15% 4 $6.67 1 Radius 0.0030 0.0010 0.00010 Automated Quest 450 OGP 0.00001 Pass 24% 0.25 $0.42 2 Radius 0.0790 0.0010 0.00010 Automated Quest 450 OGP 0.00001 Pass 24% 0.25 $0.42 1 Linear 0.3500 0.0020 0.00020 Manual 8" Caliper 0.001 Fail 35% 0.5 2 Linear 0.6800 0.0020 0.00020 Manual 8" Caliper 0.001 Fail 36% 0.5 3 Linear 0.2560 0.0020 0.00020 Manual Starret Optical Comparitor 0.0001 Pass 37% 3 $5.00 Negligible 1 Linear 0.0950 0.0002 0.00002 Manual 0-1" Micrometer 0.00005 Fail 20% 2 $3.33 $0.83 Minor Major Critical Red Flag #1: Radii as critical and major, check for Profile 12
  • 13.
    Good metrology planningreviews allow us to find the red flags in a project and fix them early Feature Type Count Feature Type Nominal Dimension Total Tolerance Resolution Required Gage Operation Gage Used - Current Gage Accuracy Resolution Check P/T Ratio Time (min) Inspection Cost Per feature 1 Diameter 0.3900 0.0050 0.00050 Automated Quest 450 OGP 0.00001 Pass 10% 2 $3.33 2 Radius 0.0030 0.0010 0.00010 Automated S-T Optical Comparitor 50x 0.0001 Pass 15% 4 $6.67 1 Radius 0.0030 0.0010 0.00010 Automated Quest 450 OGP 0.00001 Pass 24% 0.25 $0.42 2 Radius 0.0790 0.0010 0.00010 Automated Quest 450 OGP 0.00001 Pass 24% 0.25 $0.42 1 Linear 0.3500 0.0020 0.00020 Manual 8" Caliper 0.001 Fail 35% 0.5 2 Linear 0.6800 0.0020 0.00020 Manual 8" Caliper 0.001 Fail 36% 0.5 3 Linear 0.2560 0.0020 0.00020 Manual Starret Optical Comparitor 0.0001 Pass 37% 3 $5.00 Negligible 1 Linear 0.0950 0.0002 0.00002 Manual 0-1" Micrometer 0.00005 Fail 20% 2 $3.33 $0.83 Minor Major Critical Red Flag #2: .0002” tolerance with manual metrology 13
  • 14.
    Good metrology planningreviews allow us to find the red flags in a project and fix them early Feature Type Count Feature Type Nominal Dimension Total Tolerance Resolution Required Gage Operation Gage Used - Current Gage Accuracy Resolution Check P/T Ratio Time (min) Inspection Cost Per feature 1 Diameter 0.3900 0.0050 0.00050 Automated Quest 450 OGP 0.00001 Pass 10% 2 $3.33 2 Radius 0.0030 0.0010 0.00010 Automated S-T Optical Comparitor 50x 0.0001 Pass 15% 4 $6.67 1 Radius 0.0030 0.0010 0.00010 Automated Quest 450 OGP 0.00001 Pass 24% 0.25 $0.42 2 Radius 0.0790 0.0010 0.00010 Automated Quest 450 OGP 0.00001 Pass 24% 0.25 $0.42 1 Linear 0.3500 0.0020 0.00020 Manual 8" Caliper 0.001 Fail 35% 0.5 2 Linear 0.6800 0.0020 0.00020 Manual 8" Caliper 0.001 Fail 36% 0.5 3 Linear 0.2560 0.0020 0.00020 Manual Starret Optical Comparitor 0.0001 Pass 37% 3 $5.00 Negligible 1 Linear 0.0950 0.0002 0.00002 Manual 0-1" Micrometer 0.00005 Fail 20% 2 $3.33 $0.83 Minor Major Critical Red Flag #3: 3 Minors with manual metrology 14
  • 15.
    Good metrology planningreviews allow us to find the red flags in a project and fix them early Feature Type Count Feature Type Nominal Dimension Total Tolerance Resolution Required Gage Operation Gage Used - Current Gage Accuracy Resolution Check P/T Ratio Time (min) Inspection Cost Per feature 1 Diameter 0.3900 0.0050 0.00050 Automated Quest 450 OGP 0.00001 Pass 10% 2 $3.33 2 Radius 0.0030 0.0010 0.00010 Automated S-T Optical Comparitor 50x 0.0001 Pass 15% 4 $6.67 1 Radius 0.0030 0.0010 0.00010 Automated Quest 450 OGP 0.00001 Pass 24% 0.25 $0.42 2 Radius 0.0790 0.0010 0.00010 Automated Quest 450 OGP 0.00001 Pass 24% 0.25 $0.42 1 Linear 0.3500 0.0020 0.00020 Manual 8" Caliper 0.001 Fail 35% 0.5 2 Linear 0.6800 0.0020 0.00020 Manual 8" Caliper 0.001 Fail 36% 0.5 3 Linear 0.2560 0.0020 0.00020 Manual Starret Optical Comparitor 0.0001 Pass 37% 3 $5.00 Negligible 1 Linear 0.0950 0.0002 0.00002 Manual 0-1" Micrometer 0.00005 Fail 20% 2 $3.33 $0.83 Minor Major Critical Red Flag #4: 3 features failing 10:1 ratio 15
  • 16.
    Good metrology planningreviews allow us to find the red flags in a project and fix them early Feature Type Count Feature Type Nominal Dimension Total Tolerance Resolution Required Gage Operation Gage Used - Current Gage Accuracy Resolution Check P/T Ratio Time (min) Inspection Cost Per feature 1 Diameter 0.3900 0.0050 0.00050 Automated Quest 450 OGP 0.00001 Pass 10% 2 $3.33 2 Radius 0.0030 0.0010 0.00010 Automated S-T Optical Comparitor 50x 0.0001 Pass 15% 4 $6.67 1 Radius 0.0030 0.0010 0.00010 Automated Quest 450 OGP 0.00001 Pass 24% 0.25 $0.42 2 Radius 0.0790 0.0010 0.00010 Automated Quest 450 OGP 0.00001 Pass 24% 0.25 $0.42 1 Linear 0.3500 0.0020 0.00020 Manual 8" Caliper 0.001 Fail 35% 0.5 2 Linear 0.6800 0.0020 0.00020 Manual 8" Caliper 0.001 Fail 36% 0.5 3 Linear 0.2560 0.0020 0.00020 Manual Starret Optical Comparitor 0.0001 Pass 37% 3 $5.00 Negligible 1 Linear 0.0950 0.0002 0.00002 Manual 0-1" Micrometer 0.00005 Fail 20% 2 $3.33 $0.83 Minor Major Critical Red Flag #5: 3 features failing % P/T req. for a basic Type 1 Rpt. study 16
  • 17.
    Good metrology planningreviews allow us to find the red flags in a project and fix them early Feature Type Count Feature Type Nominal Dimension Total Tolerance Resolution Required Gage Operation Gage Used - Current Gage Accuracy Resolution Check P/T Ratio Time (min) Inspection Cost Per feature 1 Diameter 0.3900 0.0050 0.00050 Automated Quest 450 OGP 0.00001 Pass 10% 2 $3.33 2 Radius 0.0030 0.0010 0.00010 Automated S-T Optical Comparitor 50x 0.0001 Pass 15% 4 $6.67 1 Radius 0.0030 0.0010 0.00010 Automated Quest 450 OGP 0.00001 Pass 24% 0.25 $0.42 2 Radius 0.0790 0.0010 0.00010 Automated Quest 450 OGP 0.00001 Pass 24% 0.25 $0.42 1 Linear 0.3500 0.0020 0.00020 Manual 8" Caliper 0.001 Fail 35% 0.5 2 Linear 0.6800 0.0020 0.00020 Manual 8" Caliper 0.001 Fail 36% 0.5 3 Linear 0.2560 0.0020 0.00020 Manual Starret Optical Comparitor 0.0001 Pass 37% 3 $5.00 Negligible 1 Linear 0.0950 0.0002 0.00002 Manual 0-1" Micrometer 0.00005 Fail 20% 2 $3.33 $0.83 Minor Major Critical Red Flag # 6: Time 15 min and cost around $20 17
  • 18.
    Good metrology planningreviews allow us to find the red flags in a project and fix them early Feature Type Count Feature Type Nominal Dimension Total Tolerance Resolution Required Gage Operation Gage Used - Current Gage Accuracy Resolution Check P/T Ratio Time (min) Inspection Cost Per feature 1 Diameter 0.3900 0.0050 0.00050 Automated Quest 450 OGP 0.00001 Pass 10% 2 $3.33 2 Radius 0.0030 0.0010 0.00010 Automated S-T Optical Comparitor 50x 0.0001 Pass 15% 4 $6.67 1 Radius 0.0030 0.0010 0.00010 Automated Quest 450 OGP 0.00001 Pass 24% 0.25 $0.42 2 Radius 0.0790 0.0010 0.00010 Automated Quest 450 OGP 0.00001 Pass 24% 0.25 $0.42 1 Linear 0.3500 0.0020 0.00020 Manual 8" Caliper 0.001 Fail 35% 0.5 2 Linear 0.6800 0.0020 0.00020 Manual 8" Caliper 0.001 Fail 36% 0.5 3 Linear 0.2560 0.0020 0.00020 Manual Starret Optical Comparitor 0.0001 Pass 37% 3 $5.00 Negligible 1 Linear 0.0950 0.0002 0.00002 Manual 0-1" Micrometer 0.00005 Fail 20% 2 $3.33 $0.83 Minor Major Critical Red Flag #1: Radii as critical and major, check for Profile Red Flag #2: .0002” tolerance with manual metrology Red Flag #3: 3 Minors with manual metrology Red Flag #4: 3 features failing 10:1 ratio Red Flag #5: 3 features failing % P/T req. for a basic Type 1 Rpt. study Red Flag # 6: Time 15 min and cost around $20 18
  • 19.
    The metrology planningreview led to three key concerns 1. The .003” radii need profile tolerancing 2. 15 minute measurement time will drive cost later 3. Initial Type 1 Repeatability studies not promising 19
  • 20.
    Metrology Planning Review ManufacturingReview Post Processing Review 20 There are three focus areas for the Technical Team
  • 21.
    If manufacturers haveflagged a client’s critical features, the project is in trouble Each supplier defines their own key MFG risk categories 21 Balloon # Feature Description Machine Axis/Axes used to create feature Nom Dim Plus Tolerance Minus Tolerance Total Tolerance Feature Type MFG Risk 1 MFG Risk 2 MFG Risk 3 Customer Risk Assessment 1 0.350 EDM (X,Y,W) 0.350 0.001 0.001 0.0020 Linear Low Low Low Minor 2 0.095 EDM (X,Y,W) 0.095 0.001 0.001 0.0020 Linear Low Low Low Negligible 3 0.680 EDM (X,Y,W) 0.680 0.001 0.001 0.0020 Linear Low Low Low Minor 4 0.256 EDM (X,Y,W) / Milling (X,Y,Z) 0.256 0.001 0.001 0.0020 Linear Medium Low Medium Minor 5 .001 A B (J-K) EDM (X,Y,W) 0.001 0.001 0.001 0.0010 Profile High Medium Medium Critical 6 .001 A B (F- G) EDM (X,Y,W) 0.001 0.001 0.001 0.0010 Profile High Low Medium Critical 7 0.362 Milling (X,Y,Z) 0.362 0.001 0.001 0.0020 Diametric Medium Medium Medium Negligible 8 4x R.005 Max EDM (X,Y,W) 0.005 0.000 0.005 0.0050 Radial Low Low Low Negligible 9 2X .108 EDM (X,Y,W) 0.108 0.001 0.001 0.0020 Linear Low Low Low Negligible 10 2x .066 EDM (X,Y,W) 0.066 0.001 0.001 0.0020 Linear Low Low Low Negligible 11 0.390 EDM (X,Y,W) / Milling (X,Y,Z) 0.390 0.001 0.001 0.0020 Diametric Medium Low Medium Critical
  • 22.
    The manufacturing reviewled to two key concerns 1. The intricate features in Detail B need to be grouped and toleranced with profile 22 2. The small radii in Detail C can be grouped and toleranced with profile, possibly minimizing risk
  • 23.
    Metrology Planning Review ManufacturingReview Post Processing Review (Color Anodizing) 23 There are three focus areas for the Technical Team
  • 24.
    Some “interference” colorsare challenging to make • Color choice drives cost. Purple and Seafoam have ~ +/- 1V range and thus higher cost • * Images used with permission from American Bright Works in Fridley, MN • http://americanbrightworks.com 24
  • 25.
    Surface cleanliness isimportant in color anodizing Remove oils & contamination on surfaces & in deep nooks 25
  • 26.
    Chemical deburring ishelpful before color anodizing • Run cost model with and without deburring • Adjust tolerances for chemical deburring 26
  • 27.
    Masking parts ismanual and adds cost Parts requiring individual masking – whether they are single color or multi-color increases handling charges, time to process and therefore cost ~10-15% adder. 27
  • 28.
    Color anodizing theentire component minimizes cost Simplified design with no masking or blind holes 28
  • 29.
    The post processingreview led to two key concerns 29 1. A cleaning step needs to be added to the process flow to ensure removal of surface oils 2. The part will remain one color to minimize cost
  • 30.
    Cost Modeling 30 There isone focus for the Commercial Team
  • 31.
    31 Commercial Team: It onlytakes one excitement feature to make a commodity component a specialty component.
  • 32.
    With specialty components,the commercial team should focus on cost-modeling of the process 32
  • 33.
    Build the simpleshould-cost model first… 33 Process Step Dist Type Mean Time Per Unit in Mins Lower Upper Stdev $/hour $/min Price/unit with Milling Ti-6Al-4V ELI raw material cost Normal 5.00 5 0.5 N/A N/A 5.00$ Verify Incoming Raw Material Uniform 15.00 10 20 $ 75 1.25$ 18.75$ Saw Uniform 7.50 5 10 $ 75 1.25$ 9.38$ Mill Uniform 8.00 6 10 $ 100 1.67$ 13.33$ EDM normal 7.00 7 1 $ 100 1.67$ 11.67$ Dim Inspection Uniform 15.00 10 20 $ 100 1.67$ 25.00$ OSP Uniform 10.00 8 12 $ 75 1.25$ 12.50$ Final Inspection Uniform 14.00 8 20 $ 100 1.67$ 23.33$ 118.96$ $/Hour numbers are simple placeholders
  • 34.
    Build the simpleshould-cost model first… Should-Cost model ~ Process Flow + Activity-Based Costing Step 1: Build basic deterministic model in Excel Step 2: Add variation to the model by replacing static point estimates with stochastic functions. Use historical data and process knowledge to pick distributions Step 3: Run the Monte Carlo simulation and check the mean and range assumptions Step 4: Run and review the sensitivity analysis to find key cost drivers34 Process Step Dist Type Mean Time Per Unit in Mins Lower Upper Stdev $/hour $/min Price/unit with Milling Ti-6Al-4V ELI raw material cost Normal 5.00 5 0.5 N/A N/A 5.00$ Verify Incoming Raw Material Uniform 15.00 10 20 $ 75 1.25$ 18.75$ Saw Uniform 7.50 5 10 $ 75 1.25$ 9.38$ Mill Uniform 8.00 6 10 $ 100 1.67$ 13.33$ EDM normal 7.00 7 1 $ 100 1.67$ 11.67$ Dim Inspection Uniform 15.00 10 20 $ 100 1.67$ 25.00$ OSP Uniform 10.00 8 12 $ 75 1.25$ 12.50$ Final Inspection Uniform 14.00 8 20 $ 100 1.67$ 23.33$ 118.96$ $/Hour numbers are simple placeholders
  • 35.
    In step 3,run the simulation and check the mean value assumptions Output for cost appears normal which should be assumed based on central limit theorem, with a mean value ~$119 35
  • 36.
    In step 3,run the simulation and check the range assumptions If you were the supplier, which cost would you provide to the customer without any historical data? 36
  • 37.
    In step 4,run the sensitivity analysis to find the key cost drivers Inspection costs are the key cost drivers at this point, work with the technical team to learn more about ways to drive costs down. 37
  • 38.
    Fix root causesof the variation in inspection steps Start with conservative distribution assumptions and tighten them based on data 38
  • 39.
    Seek to combineprocessing steps if ideal Warning: Combining process steps is not always ideal. Base the decision on data. 39
  • 40.
    Review what featuresare created with milling 40 Balloon # Feature Description Machine Axis/Axes used to create feature Nom Dim Plus Tolerance Minus Tolerance Total Tolerance Feature Type 1 0.350 EDM (X,Y,W) 0.350 0.001 0.001 0.0020 Linear 2 0.095 EDM (X,Y,W) 0.095 0.001 0.001 0.0020 Linear 3 0.680 EDM (X,Y,W) 0.680 0.001 0.001 0.0020 Linear 4 0.256 EDM (X,Y,W) / Milling (X,Y,Z) 0.256 0.001 0.001 0.0020 Linear 5 .001 A B (J-K) EDM (X,Y,W) 0.001 0.001 0.001 0.0010 Profile 6 .001 A B (F- G) EDM (X,Y,W) 0.001 0.001 0.001 0.0010 Profile 7 0.362 Milling (X,Y,Z) 0.362 0.001 0.001 0.0020 Diametric 8 4x R.005 Max EDM (X,Y,W) 0.005 0.000 0.005 0.0050 Radial 9 2X .108 EDM (X,Y,W) 0.108 0.001 0.001 0.0020 Linear 10 2x .066 EDM (X,Y,W) 0.066 0.001 0.001 0.0020 Linear 11 0.390 EDM (X,Y,W) / Milling (X,Y,Z) 0.390 0.001 0.001 0.0020 Diametric
  • 41.
    41 The right graphin the right software is crucial Combining milling and EDM steps increases mean cost by ~ $8.30
  • 42.
    The commercial reviewled to two key concerns 1. Inspections costs are the key cost drivers 42 2. Combining milling and EDM is not cost effective
  • 43.
    Minimize complexity 43 There isone focus for the Regulatory Team
  • 44.
    Commercial Team at ImpasseHereTechnical Team Lost Here Regulatory Team driving from the center or Technical, Commercial and Regulatory Teams moving efficiently through the maze together 44 Regulatory Team: The regulatory agencies give the requirements but the complexity is controlled by the regulatory team
  • 45.
    Always think aboutthe validation complexity Note: Drawings stay preliminary until post validation 45
  • 46.
    46 When it comesto validation planning, define the ends of the goalpost first, then work in from there All features are critical No features are critical
  • 47.
    47 Proactively define thefeature risk classifications Minimize A/B where: A= the number of critical features B = the number of negligible features
  • 48.
    48 To establish thevalidation cost baseline, assume no features are critical No features are critical Total OQ Costs $15,485 Total PQ Costs $15,485 Total Validation Costs $30,970
  • 49.
    49 To see howcomplex the validation can get, next assume all features are critical All features are critical
  • 50.
    Total OQ Costs$17,485 Total PQ Costs $17,485 Total Validation Costs $34,970 Driving design to two critical features saves money while balancing validation risk 50
  • 51.
    The regulatory reviewled to four concerns 1. Feature risk classification modulates sample size and cost 2. Use of profile on feature 6 moves it from critical to negligible 3. Using 2 critical features balanced risk and validation cost 4. Feature risk classification ratio = 2/6 or 33% not ideal 51 Balloon # Feature Description Feature Risk 1 0.350 Minor 2 0.095 Negligible 3 0.680 Minor 4 0.256 Minor 5 .001 A B (J-K) Critical 6 .001 A B (F-G) Negligible 7 0.362 Negligible 8 4x R.005 Max Negligible 9 2X .108 Negligible 10 2x .066 Negligible 11 0.390 Critical
  • 52.
    52 #1 Technical Metrology Review ManufacturingReview Post Processing Review #2 Commercial Process Mapping Should-Cost Modeling Monte-Carlo Simulation #3 Regulatory Product/Component Strategic Planning Product/Component Validation Planning This presentation focused on three key aspects of Design for Manufacturing (DFM)
  • 53.
    53 There are threekey DFM teams, all must execute to enable project success. Questions?
  • 54.
    54 Acknowledgements Assertion-Evidence Template: • http://writing.engr.psu.edu GraphicsSupport: • Edward Britz • www.edwardbritz.com Presentation Support: • Christine Haas • http://christinehaasconsulting.com Monte Carlo Software: • @RISK by Palisade Corporation • http://www.palisade.com/risk Lowell Dimensional Lab Built by: • Precision Environments • http://precisionenvironmentsinc.com Automated OQ/PQ Minitab Macro Creation: • Mercer Quality Consulting, LLC • http://MercerQualityConsulting.com
  • 55.
  • 56.
    Lowell’s Newly CompletedQuality Lab Temperature: 20 degrees C +/- 0.5 degrees C Humidity: 45% RH +/- 5% RH New Equipment: Based on customer needs
  • 57.
    Customer DFMECA RiskAssessment for the component Major Notes Confidence/Reliability Tolerance Intervals 95/90 Attribute Sampling Level 29 Continuous can be less # Features from DWG 11 From DWG Cost Estimate from Cost Model $155 Use upper limit because there is no historical data yet Number of OQ Lots 3 1 min if you can argue it makes sense Number of Parts Per OQ lot 29 standard sample size for 95/90 in industry Total number of OQ parts 87 3*29 Total Cost for OQ Parts $13,485 3*29*$155 OQ Data Analysis Cost $500 5 hrs * $100/hr OQ Report $1,500 15 hrs * $100/hr Number of PQ Lots 3 3 lots minimum Number of Parts Per OQ lot 29 standard sample size for 95/90 in industry Total number of PQ parts 87 3*29 Total Cost for PQ Parts $13,485 3*29*$155 PQ Dara Analysis Cost $500 5 hrs * $100/hr PQ Report $1,500 15 hrs * $100/hr Total OQ Costs $15,485 Total PQ Costs $15,485 PQ parts are sellable parts if they passed, so $$ can subtract out Total Validation Costs $30,970 $31,485 in validation NRE charges Validation Calculations for No Critical Features
  • 58.
    Customer DFMECA RiskAssessment for the component Major Notes Confidence/Reliability Tolerance Intervals 95/90 Attribute Sampling Level 29 Continuous can be less # Features from DWG 11 From DWG Cost Estimate from Cost Model $155 Use upper limit because there is no historical data yet Number of OQ Lots 3 1 min if you can argue it makes sense Number of Parts Per OQ lot 29 standard sample size for 95/90 in industry Total number of OQ parts 87 3*29 Total Cost for OQ Parts $13,485 3*29*$155 OQ Dara Analysis Cost $6,000 30 hrs * $200/hr OQ Report $3,000 30 hrs * $100/hr Number of PQ Lots 3 3 lots minimum Number of Parts Per OQ lot 29 standard sample size for 95/90 in industry Total number of PQ parts 87 3*29 Total Cost for PQ Parts $13,485 3*29*$155 PQ Dara Analysis Cost $6,000 30 hrs * $200/hr PQ Report $3,000 30 hrs * $100/hr Total OQ Costs $22,485 Total PQ Costs $22,485 PQ parts are sellable parts if they passed, so $$ can subtract out Total Validation Costs $44,970 $31,485 in validation NRE charges Validation Calculations for All Features Critical
  • 59.
    Validation Calculations forTwo Critical Features Customer DFMECA Risk Assessment for the component Major Notes Confidence/Reliability Tolerance Intervals 95/90 Attribute Sampling Level 29 Continuous can be less # Features from DWG 11 From DWG Cost Estimate from Cost Model $155 Use upper limit because there is no historical data yet Number of OQ Lots 3 1 min if you can argue it makes sense Number of Parts Per OQ lot 29 standard sample size for 95/90 in industry Total number of OQ parts 87 3*29 Total Cost for OQ Parts $13,485 3*29*$155 OQ Data Analysis Cost $2,000 10 hrs * $200/hr OQ Report $2,000 20 hrs * $100/hr Number of PQ Lots 3 3 lots minimum Number of Parts Per OQ lot 29 standard sample size for 95/90 in industry Total number of PQ parts 87 3*29 Total Cost for PQ Parts $13,485 3*29*$155 PQ Dara Analysis Cost $2,000 10 hrs * $200/hr PQ Report $2,000 20 hrs * $100/hr Total OQ Costs $17,485 Total PQ Costs $17,485 PQ parts are sellable parts if they passed, so $$ can subtract out Total Validation Costs $34,970 $31,485 in validation NRE charges