Advisory Report_Sustainable Coastal Protection in Vietnam.compressed
1. HZ University of Applied Sciences
ADVISORY REPORT
Sustainable coastal protection in Vietnam
“Improving safety, ecology and profits in Soc
Trang by using different strategies of coastal
protection”
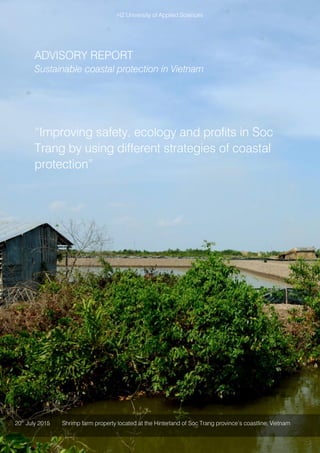
20th
July 2015 Shrimp farm property located at the Hinterland of Soc Trang province’s coastline, Vietnam
3. Message from the Authors
“With this research our intention is to
develop coastal protection solutions
for Soc Trang using sustainable soft-
engineering techniques that
contribute to enhance the overall
scenario in the region.”
We are glad to present you the summary of months of research and
design. It was a joyful time to work and collaborate with so many
different parties; in fact, the production of this document would have
never been possible without the dedicated effort of all stakeholders
and parties involved. Over the time we received valuable input coming
from different people such as our mentor in the Hz University in The
Netherlands, The Ministry of Agriculture and Rural Development of the
Soc Trang Province and our Professors in the Can Tho University. I
would like to thank you for all your effort and support.
After all the time spent in Vietnam, experiencing the different
characteristics over the different regions of the country, we concluded
that one thing is unanimous among all of them: The Mekong Delta has
a lot of importance in the lives of the Vietnamese.
With this research our intention is to develop coastal protection
solutions for Soc Trang using sustainable soft-engineering techniques
that contribute to enhance the overall scenario in the region. This
document portraits the thought process carried out during the
different phases of the research. The result is a sustainable alternative
aimed on improving safety, ecology and profits in Soc Trang by utilizing
different methods of Coastal Protection. We hope to make a positive
contribution and support the development of this fast-growing
country.
Best regards,
Anthony Meijer
Anthony Meijer
3rd year Civil Engineering Student in
HZ University of Applied Sciences
“The Mekong delta is an emerging,
dynamic area that has a lot to offer
and wants to take a venture in
development by taking the next step
in water management.”
We are proud to present to you the result of an adventure that took
five months to complete. The Mekong delta is an emerging, dynamic
area that has a lot to offer and wants to take a venture in development
by taking the next step in water management. This shows by all the
great support we have received by different stakeholders and parties
involved.
I would like to give special thanks to the following persons and parties;
their support has made this project happen.
Msc. J.N. Salvador de Paiva, your support for this project before it was
even in the current form has been an enormous boost for our interest
and enthusiasm and a push to improve continuously. Nghia Phan, for
supporting the project pro bono, handling relations with everything
from governmental procedures to smoothen the transition and contact
with Can Tho University. Dhr. Tran van Ty, for not only supporting our
projects, arranging seminars, and giving advice on the project. Also for
showing us Can Tho, local delicacies and introducing us to local people.
Without the support of the ministry of agriculture and Can Tho
University, this would not have been possible.
The result is a study aimed to improve safety, ecology and profits in Soc
Trang by using different methods of Coastal protection. We hope this
study will give you an insight in complexity of the region, as well as
providing thought for your own opinion about the best approach.
Kind Regards,
Rick Kool
Rick Kool
3rd year Civil Engineering Student in
HZ University of Applied Sciences
4. Abstract
The Mekong Delta plays an important role as ‘rice bowl’ for the whole of Vietnam. Rapid expansion of shrimp farming in the Mekong Delta
has contributed to economic growth and poverty reduction, but has been accompanied by rising concerns over environmental and social
impacts. Thousands of hectares of mangrove forest were converted into shrimp farms in the last decade. The lack of an integrated approach
to sustainable management, utilization and protection of the coastal zone and economic interests in shrimp farming have led to the
unsustainable use of natural resources, thus threatening the protection function of the mangrove forest belt and, in turn, reducing income
for local communities.
In our research, we focused on Soc Trang province, which deals with all these issues on an accelerated rate. The coastal zone is also affected
by the impacts of climate change, which is predicted to cause increased intensity and frequency of storms, floods and droughts, increased
saline intrusion, land subsidence, higher rainfall during the rainy season and rising sea levels. The aim of this research was a design of
sustainable coastal protection system that is comprehensive and inclusive. As a starting point, an inventory during an on-site analysis was
conducted to determine the status of the study area. In this way it was possible to determine the acceptability and strategy per study
location. This was led by development of designs per strategy per study location including calculations, geotechnical verification, technical
drawings and budgetary analysis. From there we conducted analytics, which resulted in the discussion and conclusion.
It is concluded that Sustainable coastal protection systems can potentially address these issues. For location A the Traditional strategy was
shown to be the most cost-effective. For study area B however, Managed Realignment was the most efficient, both in costs and in
sustainability. Therefore being able to improve safety, ecology and profits in the area.
Keywords: Coastal defence; Mekong Delta; Mangroves; Coastal Engineering; Vietnam; Sustainable coastal protection; Managed Realignment;
5. 0 | P a g e
Contents
PAGE 1 INTRODUCTION
PAGE 3 BACKGROUND
PAGE 12 PROBLEM DEFINITION
PAGE 14 STUDY AREA
PAGE 16 DISCUSSION OF THE STRATEGIES
PAGE 17 TECHNIQUES
PAGE 19 METHODOLOGY
PAGE 21 STUDY AREA A (PRE-DESIGN)
PAGE 38 STUDY AREA B (PRE-DESIGN)
PAGE 55 GEOTECHNICAL VERIFICATION
PAGE 58 BUDGETARY ANALYSIS
PAGE 63 DISCUSSION AND RECOMMENDATIONS
PAGE 67 CONCLUSION
APPENDIX 1: PARAMETERS FOR DEFINITION OF THE STUDY AREA
APPENDIX 2: 3D SURFACE GRAPH: WAVE RUNUP THROUGH MANGROVE FOREST
APPENDIX 3: BUDGETARY ANALYSIS TECHNICAL TERMS
BIBLIOGRAPHY
AKCNOWLEDGEMENTS
6. 1 | P a g e
loods affect the greatest number of people. The number of affected
people and economic damages from flooding and especially from
extreme floods is raising an alarming bell within the context of climate
change discussions (UN, 1998).
As a developing country located in Southeast Asia, Vietnam has annually
suffered natural disasters such as typhoons, tropical storms, floods,
inundation, drought, salt penetration, landslides, and earthquakes for
centuries. The Vietnamese people have recently, however, experienced an increase in their numbers. In a summary report of
natural disasters from 1995 to 2006, the number of deaths was 9.416 people. The total estimated damage due to storms,
floods and drought was VND1 61.479 billion (PDR-SEA, 2008). In view of these data, naturaldisaster reduction andriskmitigation
are currently priority problems of Vietnam’s government.
The Vietnamese Mekong Delta (MD) is an extremely vulnerable and damageable flooding region compared to other countries
in Southeast Asia. Mekong Delta people have coped with and adapted to a number of “natural disasters” and “human
disasters.” Dyke works can be considered as a potential human disaster in the flooding context of the MD because flood control
measures have caused a number of negative impacts for the ecosystem and the inhabitants (University Bonn, 2011). In this
regard, a study has been produced aimed to design coastal protection systems able to potentially address these issues.
Two study areas located along the coastline of Soc Trang Province were selected, which account for a total length of 21-Km.
These areas were chosen because they deal with two opposite scenarios: Erosion and sedimentation. Thus due to their location
facing directly the sea (near the Mekong river mouth), they deal with the problems of sea level increase, damage of existing
coastal protection structures and land damage in an accelerated rate. In this way, it is possible to design systems that take into
account a wide range of variables, making them possible to fit in any given location along Vietnam’s coast. For ensuring efficient
flow and quick response to the scenarios, the process was carried out according to Chart 1.
F
Introduction
“FLOODS HAVE THE GREATEST
DAMAGE POTENTIAL OF
ALL NATURAL DISASTERS
WORLDWIDE” (UN, 1998)
1. On-site analysis
Pp. nr.1.: Traditional
Approach
Pp. nr.2.: Managed
Realignment
Pp. nr.3.: Advancing
2. Calculate current
situation
3. Determine
acceptability and
strategy
4. Calculate new
designs
5. Finalize Proposals
Chart 1: Process Flow Summary
Author:Unknown
7. 2 | P a g e
The Research will be based on the guidelines proposed by the existing Mekong Delta Plan, produced under the cooperation
agreement signed in 2010 by the Dutch and Vietnamese governments to collaborate on climate change adaptation and water
management related matters. A consortium of Dutch water-expert companies and both governments joint forces for creating
this plan.
According to the Mekong Delta plan, the dikes at the Northwest and Eastern coastal area are located to close to the sea. This
fact in combination with the destruction of the mangroves – increasingly happening due to the aquaculture expansion - will
lead to potential risks regarding flooding and land subsidence.
It is in accordance with the Mekong Delta Plan to increase the wave reduction zone and allow the mangroves to grow naturally,
as well as create room for potential aquaculture. For this purpose, Integrated Coastal Zone Management strategies including
Managed Realignment were taken into account in the designs proposals in this document.
This Advisory Report is a systematic summary of the thought process taken place during the research. Its aims is giving
substantial information about the development of the research. After definition of the problem and the chosen study areas
(based on the program of requirements), each area was evaluated and assigned two strategies. These strategies were the
foundation for the design of the final proposals, which focus on answering the Main and Sub-questions of the research, stated
on the Project Plan and in page 12 of this document. A geotechnical verification and a budgetary analysis was done for each
design proposal. This report is finalized by a discussion and recommendations chapter followed by a conclusion (drafted for
each study area), where objective is serving as a guideline for future decisions by the stakeholders involved on the
administrative level upon the future plans on the areas. Chart 12 illustrates the organizational structure of this report.
Chart 2: Advisory Report Structure
8. 3 | P a g e
Mekong Delta
Mekong River water is everywhere and is the basis of agricultural livelihood, transportation, communication, fishing and all
kind of daily domestic uses of the deltaic people (Käkönen, 2008). As a pure agricultural region, it provides food for at least 18
million residents. The MD plays an important role in guaranteeing national food security and contributes heavily to the
economic and social development of the country. Natural conditions in terms of land, water and climate are favorable for
agricultural development – and agriculture is still a major component of Vietnam’s economy. Therefore, most of all crops,
domestic animals and aquaculture are being raised in this area. Additionally, canalization and river networks have been
developed to provide water for agricultural development. Graph 1 portraits the agriculture model present on the Mekong
Delta region.
The Mekong Delta plays an
important role as ‘rice bowl’ for
the whole of Viet Nam. Rapid
expansion of shrimp farming in
the Mekong Delta has
contributed to economic
growth and poverty reduction,
but has been accompanied by
rising concerns over
environmental and social
impacts (Phan NH, 1993) (JH,
2006). Between 1987 and
1992, for example thousands
of hectares of mangrove forest
were converted into shrimp
farms (TT, 2011). The lack of an
integrated approach to
sustainable management, utilization and protection of the coastal zone and economic interests in shrimp farming have led to
the unsustainable use of natural resources, thus threatening the protection function of the man- grove forest belt and, in turn,
reducing income for local communities. The coastal zone is also affected by the impacts of climate change (IPCC, 2013). Climate
change is predicted to cause increased intensity and frequency of storms, floods and droughts, increased saline intrusion,
higher rainfall during the rainy season and rising sea levels.
0
20
40
60
80
Crops Livestock and Fishery Agricutlrural Services
%
Graph 1: Structure of Agriculture in the
Mekong Delta
1990 1995 2000 2001 2002
Background
Source: Socio-economic Statistics of Mekong Delta.
Author:Maios
Author:Unknown
Figure 1: Rivers are an important element of the transportation chain.
9. 4 | P a g e
In the MD, rice is still the most important crop. In 2004, the total rice area of the MD was 3.8 million ha, accounting for 86
percent of total crop area. The average rice yield was 4.9 tons/ha and total paddy rice production was 18.5 million tons. In the
period of 2000-2004, rice area decreased by 0.8 percent annually whereas the yield and output increased by 3.3 and 2.4
percent per annum respectively. (Economic Development of the Mekong Delta in Vietnam, 2008)
“The MD is currently facing new challenges with the old rice farming systems. Natural
resources in the area are being exploited with three annual crops and this is creating serious
consequences for the sustainability of the rice production system” (Robert Lensink, 2008)
The first problem is the efficiency by which water resources are provided for competing crops. That is, it is impossible to fully
provide water for multicropping for the entire region. Despite the fact that rice systems have been integrated with the cropping
calendar, rice requires a great amount of water in order to develop. Additionally, multicropping in upstream areas is causing a
lack of water in downstream which increases saline intrusion and acid sulfate levels during the dry season. The second problem
is soil erosion, along with modern input uses; a three crop per year rotation system seriously degrades the soil.
Increased investment in inputs such as modern fertilizers and pesticides, in order to keep decreasing yields constant, has been
observed in many places throughout the region. These fertilizers and pesticides create environmental impacts in terms of
pollution of water sources, which in turn creates increased health risks for the community.
Aquaculture
The current decrease in rice area is due to Project 09/2000/NQ-CP, which requires the transfer of land from low yield rice areas
to aquaculture production. In 2005, of the 310,841 ha of land transferred to aquaculture production 297,187 ha was rice area.
In total, rice area accounted for 84 percent of total land transferred to aquaculture production.
Graph 2 shows the switch of rice cultivation area
to aquaculture production from 1999 to 2005.
The most rapid change has occurred since 2000.
Specifically in 2000, the rice area transferred to
aquaculture area was at a record high of 132,852
ha.
In 2005, Vietnam has 959,945 ha of aquaculture
area, of which 685.250 was located in the MD. In
this region, 1,004,257 tons of aquaculture is
produced with an export value of 1.5 billion
$USD. However, the rapid growth of aquaculture
production activities has caused many
environmental problems including degradation
and pollution. Aquaculture production is
considered the main contributor to the
destruction of ecology systems that were
previously very rich and has destroyed coastal
forests. New farming models, or so- called “rice-
shrimp systems” have led to increased salinity in
the rice fields. Consequently, a new
environmentally friendly farming system is
required for the Delta.
0
50000
100000
150000
1999
2000
2001
2002
2003
2004
2005
Area(Ha)
Year
Graph 2: The switch of rice cultivation area
to aquaculture production (1999-2005)
Vietnam
Mekong Delta
Source: Ministry of Fishery.
Economy in the Mekong Delta
Reference:
Tuoitrenews.vn
10. 5 | P a g e
The current system is highly unsustainable and although aquaculture is highly profitable, the long-term forecast is very
negative. Floods that are more impactful are to be expected - which these agricultural practices and the endangered dykes
increase the pace – as well as a decrease in availability of lands due to the damage to the soil. To some extend some measures
have been taken, however do not meet the expectations and are behind the ideal image of sustainability and profit model of
the 21st Century. (Robert Lensink, 2008) Chart 3 summarizes the main problems that take place in the actual scenario.
The next chapter of this report will go more in depth about the aspects and status of the mangrove vegetation along the
coastline and highlight its importance and usefulness to efficient coastal protection, achieved by its ability to reduce the
outflow of sediment and the wave energy. Thus, a recommendation for new techniques of mangrove restoration, which were
used in projects implemented successfully in Bangladesh and Indonesia. Countries where coastlines are very similar to Vietnam,
thus dealing with the same problems.
(1)
Rice Farming
•Fertilizers and Pesticides create
environmental impact
•Requires great amount of water
to develop
(2)
Aquaculture
•Causes Soil degradation and
Pollution
•Negative effect over ecology
systems
(1) + (2)
Environmental Damage
•Destruction of Mangroves
•Salt Water intrusion
Chart 3: Problem Summary in Mekong Delta
Author:JohannesAnders
Figure 2: The Mekong is an important Delta for the locals and place to the biggest floating market in the World.
11. 6 | P a g e
Mangroves are tidal forest ecosystems on muddy soils in
sheltered saline to brackish environments. Mangroves are a key-
ecosystem laying in the tropical and sub-tropical coastlines. The
vegetation possesses special root systems for both water and air
supply. Because of the root systems, the trees are adapted to
grow in anaerobic and unstable conditions of waterlogged
muddy soils (Augustinus, 2004). Its vegetation is composed of
trees and shrubs and copes with the harsh conditions in the
intertidal: Salinity, tidal flooding and exposure to waves. They
often play a key role in the nutrient cycle in tropical estuarine ecosystems, the sustainability of marine coastal ecological
systems, the support of aquaculture and the stabilization of the tropical coastal shoreline.
However, mangrove forests have been destroyed for land reclamation, shrimp farming, timber and charcoal production at an
alarming rate throughout the world. Overcutting of mangrove trees often led to a significant impact on the ecological system
in mangrove swamps and the nearby coastal waters; this removal of mangroves trees also resulted in coastline erosion. This
happens because mangrove forests play an important role in flood defense - by dissipating incoming wave energy and reducing
the erosion rates – thus decreasing wave-driven, wind-driven and tidal currents due to the dense network of trunks, branches
and aboveground roots of the mangroves, which also contribute to sediment stabilization. (Wave attenuation in coastal
mangroves in the Red River Delta, Vietnam, 2006)
Chart 4 highlights the benefits of Mangrove forests to coastal areas thus their potential for coastal protection as a natural
structure. During the past years, there has been an increase in interest of governments of different nations in regards to their
coastline vegetation. In a world facing evident climate change and the threat of sea level rise threatening lowland countries
and littoral areas, it is necessary to take measures that transform the social-economic model present on these areas into a
sustainable. Even some measures including change in behaviors that were accepted in the past. The mangrove forest fit well
in this scenario. Being an ecosystem that has been victim of pollution and destruction, big parts had been transformed into
ashes. The problems generated by the decrease in mangrove forest have not been exclusively in regards to the biodiversity but
also a change in flow pattern has been observed.
It was only in recent decades that researches about mangroves and their potential to wave attenuation took part. In fact,
unravelling the dissipation of wave energy in coastal mangroves by field and laboratory studies has only gained attention since
Mangrove Vegetation
“Coastal mangroves provide an
important contribution to reducing risk
from coastal hazards by attenuating
incident waves and by trapping and
stabilizing sediments.” (Augustinus, 2004)
Enhance
•Biodiversity
•Nutrient circulation
•Sediment
stabilization
Reduce
•Erosion rates
•Tidal currents
•Wave energy
Chart 4: The Benefits of Mangroves
12. 7 | P a g e
the late nineties. (Alongi, 2009) Due to the inaccessibility of (natural) mangrove forests, a limited number of field studies have
been executed in mangroves in Vietnam, Australia and Japan. These studies emphasize in unison the positive contribution of
mangroves to the dissipation of wind and swell waves of limited height and period. Nevertheless, observed wave reduction
rates show significant variation with water depth and vegetation characteristics.
Bao et al. (2011) in his study about the Effect of mangrove foreststructures on wave attenuation in coastal Vietnam, showed
that wave height reduction depends on initial wave height, cross-shore distances, and mangrove forest structures. This
relationship is used to define minimum mangrove band (or mangrove belt) width for coastal protection from waves in
Vietnam.In 2002, Vietnam had approximately 155 290 ha of mangrove forests left. More than 200 000 ha of mangrove forests
have been destroyed over the last two decades as a result of conversion to agriculture and aquaculture as well as development
for recreation (VEPA (Vietnam Environment Protection
Agency), 2005).
Mazda Y., et al., 1997a in their study in the Red River Delta,
Vietnam, showed that wave reduction due to drag forced on
the trees is significant in high density, six-year-old mangrove
forests. The hydrodynamics of mangrove swamps changes
over a wide range, depending on their species, density and the
overground roots in a mangrove forest present a much higher
drag force to incoming waves that the bare sandy surface of a
mudflat does. The wave drag force can be expressed as an
exponential function (Quartel S., Kroon A., Augustinus P.G.E.F.,
Augustinus P.G.E.F., Van Santen P., & Tri N.H., 2007).
All these research proved that Mangrove forests are an essential part of the coastlines. Via observational, mathematical and
computer modelling approaches, mangrove forest’s capacities to reduce wave energy have been quantified. In this research,
the proposed designs will make use of data provenient from mangrove studies based on obersvational and mathematical
approaches. A spreadsheet have been built up in order to select the best values for calculating the reduced wave heights in
Soc Trang province coastline. For more information over the techniques and references please refer to Discussion of
Strategies/Techniques chapter.
Mangrove Restoration Projects
Many mangrove restoration projects have taken place in the past; however, they all failed due to present insufficient rate of
mangrove development. Restoration often fails in areas that suffer from erosion because the sediment balance is disturbed.
Due to human presence, the original characteristics of the coastline were changed, resulting in a scenario where the conditions
for optimal mangrove development were absent. Besides placing mangrove seeds, it is necessary the right conditions, thus a
consistence of these.
A successful mangrove restoration technique have been implemented in Indonesia and Bangladesh, resulting in proper growth
of mangrove. The project involves the use of "building with nature," using engineering techniques in combination with natural
processes via the implementation of permeable brushwood dams. It is Dutch developed technique, very cost efficient and easy
to implement, and designed to provide the required conditions for the mangroves to growth.
Figure 3 shows an example implemented in the Demak district, Mid-Java, where its coastline share the same problems as the
Vietnamese one and coastal erosion over the last decade extends over large areas.
“In 2002, Vietnam had approximately
155 290 ha of mangrove forests left.
More than 200 000 ha of mangrove
forests have been destroyed over the
last two decades” (VEPA, 2009)
Figure 3: Coastal restoration Demak; left: erosion between 2003 and 2012; right: restoration principle.
13. 8 | P a g e
The technical design of the project is to first restore a natural coastal profile with dredged material and sufficient
accommodation space for tidal water behind it, thus creating a physiotope (muddy bed, in- and outgoing tide) that is
suitable for mangrove. Wave action is damped by permeable brushwood dams (as applied for centuries for land
reclamation in the Wadden Sea); such that conditions are favorable for fine sediments to settle. Once these conditions
have been created, mangrove is likely to colonize the area spontaneously, and if necessary initial conditions will be
enhanced by mangrove planting. (Building with Nature: Mainstreaming the Concept, 2014). The method of permeable
brushwood dams has been applied with salt marshes along the coasts of the Netherlands and Germany for centuries
and is a suitable, fast and cheap technique that can be used for restoring the Vietnamese with high satisfaction rates.
The restoration of the mangroves belts is a high priority task and must be addressed accordingly. Besides the coastal
protection aspect, they provide great socio-economic development to the communities where they are inserted.
According to studies regarding cost-benefit analysis of mangrove restoration in Vietnam, mangrove restoration
generates larger benefits than that of aquaculture: about VN$21 billion compared to VN$10 billion over 22 years. The
benefits of mangrove restoration are approximately double that of aquaculture development, from a 5 per cent per
cent to a 15 per cent per cent discount rate. (Asian Cities Climate Resilience Working Paper Series: Cost–benefit analysis
of mangrove restoration in Thi Nai Lagoon, Quy Nhon City, Vietnam, 2013)
Figure 4: Coastal area in Soc Trang Province. A big amount of the mangroves present in this particular area have been destroyed. Thus these human interventions led to a change in the sediment balance affecting the natural
characteristics of the coastline.
14. 9 | P a g e
SocTrang Province is one of 13 provinces in theMekong Delta region and is located south of the Hau River, which is the southern-
most arm of the Mekong. The province covers a total area of 331,176 ha, of which 205,748 ha are used for agriculture, 11,356
ha for forestry and 54,373 ha for aquaculture. The population of the province is 1,285,096 out of which 371,266 are Khmer
and 75,421 are ethnic Chinese (Soc Trang Statistics Office, 2009). The coastal zone has a length of 72 km.
The coastline of Soc Trang Province is characterized by a dynamic process of accretion and erosion created by the flow regime
of the Mekong River and its sediment load, the tidal regime of the South China Sea (Vietnamese East Sea) and coastal long-
shore currents driven by prevailing monsoon winds. In some areas of Soc Trang loss of land, due to erosion, of up to 30 m per
year has been recorded, while in other areas land created through accretion can reach up to 64 m per year (Pham TT, 2013;
Joffre O, 2013). About 11 km of coastline of Soc Trang are currently subject to erosion. The earth dyke along this stretch of
coast, which protects the hinterland from flooding, is in several places endangered by severe erosion, which in turn endangers
the people and farmland directly behind the dyke. In several sites, a total of around 300 m of mangrove forest in front of the
dyke has been eroded away completely.
The dynamic coastline of Soc Trang Province in the Mekong Delta of Viet Nam is in most parts protected from erosion, storms
and flooding by a narrow belt of mangroves. However, the unsustainable use of natural re- sources and development in the
coastal zone is threatening the protection function of this forest belt. This situation is exacerbated by the impacts of climate
change, particularly by the increased intensity and frequency of storms, floods and by rising sea levels. Chart 5 summarizes
the current problems encountered in the region.
Soc Trang Province
Chart 5: Problem summary in Soc Trang province
Loss of land
Land
Subsidence
Salt Water
Intrusion
Flooding
15. 10 | P a g e
The main function of a dike is to prevent flooding of low-lying coastal hinterland, which means that the height of the dyke is
the most important design parameter. However, the dyke must also be able to resist the large forces of waves during extreme
events. (Albers, 2014)
Many centuries of experience in dyke design have led to an optimized design. A sea dyke is a system consisting of different
parts, starting with the foreshore or floodplain further offshore. The seaward slope ratio was decreased to reduce the wave
energy and therefore erosion induced by the run-up and overtopping of waves. That depends on the amount of area available.
Nowadays, the seaward slope of the dyke is usually 1:6 or flatter. In some cases, a berm is installed –where possible - to reduce
the wave run-up and to simplify the maintenance of the dike after storm surges. The width of the dike crest should be 3 meters
or more. This decreases wave overtopping and allows an effective dike defense. Dike defense is defined as the sum of measures
to regularly control the condition and the quality of the dike (at least twice a year; before and after the storm season, but also
after heavy storms) and to maintain the dyke, to take action in case of smaller or severe damages during extreme events and
to eventual repairs in case of such events.
A solid dike toe on the seaward as well as on the landward side is very important for the stability of the dike. On the landward
side, a drainage system (I.e.: ditch) must be available to discharge the overtopping waves and to ensure that the dike’s negative
pressures - created by the water in its interior - are reduced and the stability is maintained. A dike defense lane is recommended
for material transport and maintenance in the case of damage during storms.
Dutch History
“The Dutch are well known for their water management skills.
Water is in their genes”
The Dutch windmills (once used to pump out excess water); dikes and levees form a powerful international image. From the
early Middle Ages onwards, Dutch people have reclaimed and defended land from the sea. A skill that goes hand in hand with
water management, spatial planning, water supply and water quality. A history that revolves around adaptation to water:
Histogram 1 illustrates the important milestones and events that happened over the Dutch history in regards to water
management.1
1 Source: Dutch Water Sector, 2015
General Aspects of Dike Design
Figure 5: Construction of dike-in-boulevard (Scheveningen), 2013
Author:DutchWaterSector
16. 11 | P a g e
1000
•First man-made dike
•The oldest dike in The
Netherlands that we know of
is about 1000 years old and
situated near the village
Peins in Friesland. It was built
by monks and made of piled
turf.
•In the North of Holland
different villages combined
their dikes. They succeeded
in creating one big living area
that was embanked by the
Westfriese Omringdijk. A real
piece of water art of about
120 kilometers long and a
couple of meters high.
1255
•First Official Water
Board
•The first official Water
Board in The Netherlands
was founded in 1255 by
Count Willem II of
Holland an named the
'Hoomheemraadschap
van Rijnland'. Nowadays
The Netherlands counts
25 Water Boards. Dutch
water boards (Dutch:
waterschappen or
hoogheemraadschappen)
are regional government
bodies charged with
managing water barriers,
waterways, water levels,
water quality and sewage
treatment in their
respective regions.
1918
•The Zuiderzee Works
•The Zuiderzee Works (Dutch:
Zuiderzeewerken) are a
manmade system of dams,
land reclamation and water
drainage works, the largest
hydraulic engineering project
undertaken by the
Netherlands during the
twentieth century. The
project involved the
damming of the Zuiderzee, a
large, shallow inlet of the
North Sea, and the
reclamation of land in the
newly enclosed water using
polders
•Its main purposes are to
improve flood protection and
create additional land for
agriculture. Together with
the Delta Works, the
American Society of Civil
Engineers declared the works
among the Seven Wonders of
the Modern World.
1953
•The flood of 1953
•The 1953 North Sea flood
(Dutch, Watersnoodramp,
literally "flood disaster") was
a major flood caused by a
heavy storm.
•The combination of wind,
high tide and low pressure
had the effect that the water
level exceeded 5.6 metres
(18.4 ft) above mean sea
level in some locations. The
flood and waves
overwhelmed sea defences
and caused extensive
flooding.
•As a result of the
widespread damage, the
Netherlands particularly, and
the United Kingdom had
major studies on means to
strengthen coastal defences.
The Netherlands developed
the Delta Works, an
extensive system of dams
and storm surge barriers.
1958
•Start building the Delta
Works
•The Delta Works is a
series of construction
projects in the southwest
of the Netherlands to
protect a large area of
land around the Rhine-
Meuse-Scheldt delta
from the sea. The works
consist of dams, sluices,
locks, dikes, levees, and
storm surge barriers. The
aim of the dams, sluices,
and storm surge barriers
was to shorten the Dutch
coastline, thus reducing
the number of dikes that
had to be raised.
•Along with the
Zuiderzee Works, Delta
Works have been
declared one of the
Seven Wonders of the
Modern World by the
American Society of Civil
Engineers.
2007-2010
•Room for the River
programme &
Preparations for the
Future
•Extremely high river
discharges will occur more
frequently in the future and
for this reason it was decided
to ensure that the rivers
could discharge the forecast
greater volumes of water
without flooding. For this
reason the Dutch
Government approved the
Room for the River
programme in 2007.
•Moreover, the new-style
Delta Plan has been
structured so that the
Netherlands can put its
current safety in order and
prepare itself for the next
100 years.
•The plan is based on the 5
Dutch D's: Delta Act, Delta
Programme, Delta Fund,
Delta Commissioner and
Delta Decisions.
Histogram 1: Important events in the Dutch Water Sector
17. 12 | P a g e
The main objective of the research is to design a new coastal protection system for Soc Trang province that protects the land
from floods and restores the water and land quality of the area. This province was chosen for being the ideal research place as
it faces directly the sea and deals with all the issues related to flooding in an accelerated rate. In order to support the research’s
objective, different locations had to be selected. This gives the possibility for the researchers to implement different strategies
at different locations creating efficient coastal protection designs with a broad workability spectrum, capable of working in any
given location.
According to the Mekong Delta Plan (2013), the dikes at the Northwest and Eastern coastal area lay too close to the sea. This
fact in combination with the destruction of the mangroves – increasingly happening due to the aquaculture expansion – will
lead to potential risks regarding flooding and land subsidence.
It is in accordance with the Mekong Delta Plan to increase the wave reduction zone and allow the mangroves to grow naturally
as well as create room for potential aquaculture. For this purpose, the designs will take into account concepts of Integrated
Coastal Zone Management including Managed Realignment.
Main question
The main question that the research aims to answer is stated as follows:
“How can the current situation in the study area comply with the Mekong Delta Plan by using Integrated Coastal Zone
Management Strategies in order to increase safety, ecology and profits in the area and create room for mangrove development?”
Sub Questions
In order to answer the main question different sub questions are stated. The sub questions read as follows:
How is the current safety situation and why is it not satisfactory?
How can this be improved with the new solution?
What is the best location for the new inland dike?
What are the dimensions of this new dike?
Which solution is the most cost efficient?
How can the dike be placed to allow for growth of mangroves?
In what way the mangroves can contribute for safety and reduction of costs?
How can this project be implemented as efficient as possible?
Sustainability and flood management measures
Given the desired development scenario and the actual vulnerability of the delta as stated in the Mekong Delta Plan, different
measures are suggested based on the climate change scenario that the region in question will deal it. Moreover, taking also
into account the uncertainties of the future development: In terms of the extremity of possible climate change, in terms of
developments to take place in the upstream Mekong and last but not least in terms of the economic development to emerge
within the delta. In view of these uncertainties and the long-term impact of infrastructural measures this Mekong Delta Plan
distinguishes between "no-regret" measures (fits all scenarios), priority measures (short-term) and more structural measures
to be deferred to the mid and long term.
The Coastal Protection Designs presented and supported in this Advisory Report take into account “no-regret “measures to be
taken in the short- to mid-term (2050) that enable: 1) the adaptation of land and water use to the short-term climate change
impacts, with emphasis on increasing the sustainable land and water use; and 2) are flexible enough in their structuring of
water management and hydrological features to permit differential socio-economic development of the delta's economy in
the mid- to long-term. As well as mid- to long-term (2100) measures that are specifically designed to prepare the delta to cope
with, and adapt to, the more extreme impacts of climate change. By necessity, these are more structural and large-scale in
nature, requiring careful valuation, planning and capital outlay. Table 1 gives more information on these measures.
Problem Definition
18. 13 | P a g e
The desired outcome is a coastal protection design that makes use of managed Realignment and integrated Coastal Zone
management strategies in order to increase safety and profits in the area.
Table 1: Coastal Zone Measures (Mekong Delta Plan, 2013)
Coastal Zone: Brackish water economy and advanced coastal protection
2050
"no-
regret"
Dual Zone Coastal Management. Brackish economy and dynamic shorelines.
Modernization and increased sustainability of aquaculture by adopting poly-culture
based systems aligned with mangrove regeneration in the outer coastline. Mangrove
regeneration and sedimentation along outer coastline as reinforcement of seashore.
Movement of hard-protective sea-dyke to inner-core zone.
Food Production
Agro-Business
Industrialization
Dual Node
Industrialization
Corridor
Industrialization
2050 -
2100
Reinforcement of coastal defense. For non-Dual Zone Coastal Management areas,
sea-defense structures (dykes) need to be revamped to keep up with sea level rise.
Especially northwest coast and Eastern Delta (Mekong Branch). The routing of the
dykes needs to be in line with Dual Zone Coastal Management.
All scenariosUnlinking road system from dyke system. Flexibility in dyke trajectories is required to
allow for natural cost effective coastal flood defense strategies. The road function
impedes the flexibility for the dyke.
Under extreme sea level rise, coastal defense system is upgraded to accommodate
rising flood risks. This includes reinforcement of inner protection dykes.
Figure 6: Dr. Tran Van Ty and Mr. Ha Tan Viet , Acting Head of Civil Engineering Department (CTU) and Head of Water
Resources Division on the Department of Agriculture and Rural Development of Soc Trang respectively, during the On-Site
analysis.
19. 14 | P a g e
The first goal of the research was to find a suitable area, where the required conditions are available, maximizing the
possibilities and spectrum in regards to the design proposals. The locations had to comply with a list of parameters in order to
be in line with the research. This guarantees that the research is feasible and fully executable. The description of the process
regarding the selection of these study areas is attached in Appendix 1. This chapter will deal with the description of the selected
study areas.
The study areas were selected in Soc Trang province’s coastline. This province was chosen for being directly facing the sea,
dealing with all previous mentioned issues in an accelerated rate. The final chosen areas account together for a length of 21-
Km and deal with two opposite scenarios. This gives the possibility for the researchers to implement different strategies at
different locations creating efficient coastal protection with a broad workability spectrum.
Most Suitable Study Areas
Based on the pre-defined criteria, stated in Appendix 1, two locations were selected. The first one lies in an area that suffers
from big outflow of sediment, shortening the foreshore and damaging the existing dike. The second location reveals a totally
opposite scenario suffering from deposition instead of erosion. The different scenarios supports the research’s objective. The
description of these locations will follow on the next subchapters.
Study Area A
Study Area A is located along a stretch of 700 meters that lies in a sedimentation area but suffers from erosion due to direct
exposure to waves. Different kinds of Revetment have been implemented; nevertheless, the Dike system struggles to keep its
original shape. Many breaches were seen - one of them completely divided the dike – and new ones were beginning to form.
Regarding the mangroves, a big chunk of this vegetation was seen being removed due to aquaculture expansion. Most of the
hinterland at this location serves as place to Shrimp Farming. Properties.
Study Area B
Study Area B is located on the border of Bac Lieu continuing near Vin Chau. It is a stretch of 19 kilometres along the shore. T
sections and Mangrove regeneration projects have improved the defence system over the past years. During the visual analysis,
it became clear that the dike was a lot better than Location A. Despite these efforts, the dike system is still not sufficient. During
an average high tide the toe construction is eroding, rapidly reducing the defensive ability and stability of the structure
.
Study Area
20. 15 | P a g e
Study Area A
•Erosion
•Sediment transport from East to West
•Hard-revetment/Soft-revetment
•Partly mangroves
•Companies [Aquaculture]
•Dike has many breaches. Due to collapse
Study Area B
•Sedimentation
•Hard-revetment/ Soft-revetment
•Presence of T-sections for control of sediment flow
•Mangroves
•Sparse-popullated/
Companies [Aquaculture]
•Dike is not sufficient thus Toe-construction is eroding reducing the
stability of the Dike
Chart 6: Overview of the Study Areas
Evaluation of the Current Situation
21. 16 | P a g e
Discussion of the Strategies
The definition of the strategy will be based on the way the current situation was evaluated
and the results from this analysis. The aim of the research is to answer the main question
of the research, stated below:
“How can the current situation in the study area comply with the Mekong Delta Plan by
using Integrated Coastal Zone Management Strategies in order to increase safety, ecology
and profits in the area and create room for mangrove development?”
For answering the questions, new coastal protection systems were proposed for each
study area, considering the aspects of the region and the adequate strategies that best
help to enhance the overall situation. Each strategy was set in accordance to the priorities
listed in the Program of Requirements. All of them determined on basis of a careful
analysis of the area and process, and were carried out according to chart 7. See Strategy
Definition chapters for specific information regarding each study area.
The course of action for each study area will be determined by the strategies pointed on
the picture on the right.
The decision to choose a strategy is site-specific; depends on pattern of relative sea-level
change, geomorphological setting, sediment availability and erosion, as well as a series of
social, economic and political factors (HEURTEFEUX., 2011). Each study area was assigned
two proposals. The brief description of some techniques implemented in these proposals
will follow in the next page.
Inaction
Managed Realignment
Protection
Advancing
Limited intervention
Figure 7: Policy options (Coastal risk management
modes: The managed realignment as a risks
conception more integrated, 2011)
1. On-site analysis
Pp. nr.1.: Traditional Approach
Pp. nr.2.: Managed
Realignment
Pp. nr.3.: Advancing
2. Calculate current situation
3. Determine acceptability and
strategy
4. Calculate new designs
5. Finalize Proposals
Chart 7: Process flow
22. 17 | P a g e
Techniques
The coastal protection design proposals in this document take into account the traditional approach as well as concepts of Integrated Coastal Zone Management such as Managed Realignment
,taking into account the implementation of a mangrove forest on the foreshore. For the optimal calculation of the wave height/energy reaching the dike through the mangrove forest, two
approaches – set after a literary study - were used:
Observational (Hashim & Catherine, 2013)
Mathematical (S. Quartel, 2006)
In order to ensure the most unfavourable reduction rate, the smallest reduction of
these two studies related to the width of the mangrove belt was chosen. The
reductions for the design have been categorized in four classes of mangrove width:
50m, 100m, 150m and 200m.
Observational
The observational approach is based on the laboratory study (Hashim & Catherine,
2013) and bases mangrove reduction on the density of the mangrove area and the
arrangement. There are two testing arrangements, tandem and staggered. The
Density of the mangrove area is divided in dense (0,22 trees/m2), Medium (0,16
trees/m2) and Sparse (0,11 trees/m2). In order to get the most unfavourable
reduction rate the sparse density was chosen in combination with a tandem
arranged mangrove belt. This is to avoid any uncertainties regarding the mangrove
development in relation to the reduction.
Table 2: Observational approach reduction rate
(Hashim & Catherine, 2013)
Mathematical
This approach is based on (Quartel S., Kroon A., Augustinus P.G.E.F., Augustinus P.G.E.F., Van
Santen P., & Tri N.H., 2007) and calculates the reduction rate per meter of cross-shore
mangrove belt. The reduction rate is calculated as following:
Wave height reduction*Mangrove classification*100%
Results are listed in Table 3.
From these two results the most unfavourable value was chosen to ensure a safe design. Over
a mangrove width of 150 meters however the reduction value of the mathematical approach
reaches more then 1,0 , causing for a negative reduction rate. In other words, a reduction of
100%. Therefore, the results of the observational approach have been used for these
mangrove belt widths. However, for the width 50-100 meters the Mathematical approach
turned out to be the most unfavourable, therefore reduction table 2 was used for these
mangrove belts widths.
Table 3: Mathematical approach reduction height (Quartel S., Kroon A., Augustinus P.G.E.F.,
Augustinus P.G.E.F., Van Santen P., & Tri N.H., 2007)
Reduction in wave energy by mangroves
23. 18 | P a g e
Maintaining a foreshore with a proper slope is one of the approaches used to
reduce the height of the wave reaching the dike. In case of Vietnam, Mangroves
are particularly important because of their ability to decrease wave energy and
trap sediment, as stated in the Mangrove Vegetation chapter.
Based on the results of the literary study stated on the previous page two tables
were built up.
Table 4 was drafted on basis of the observational approach. The reduction values
of mangrove forests of a certain width taking into account both Tandem and
Sparse arrangements were averaged.
The same process was carried out for Table 5, based on the mathematical
approach. However on this approach, factors from graphs were selected in order
to obtain the reduced wave heights generated by each width of mangrove
forest.
Table 6 portraits the final reduction percentages taking into principles the
selection of the most unfavourable value in order to increase the safety of the
design.
The methodology for calculation of the wave heights will be explained in the
following chapter.
Observational Approach
Approach: Observational
Density [M2]: 0,11 Trees/m2
Wave Reduction [%]
Mangrove Forest Width [M] Tandem Arrangement Sparse Arrangement Average
50 0,53 0,65 0,59
100 0,76 0,88 0,82
150 0,9 0,95 0,925
200 0,95 0,98 0,965
Table 4: Reduction in wave height by mangrove forest. (Observational approach) (Hashim & Catherine, 2013)
Mathematical Approach
Approach: Mathematical
Density [M2]: 0,11 Trees/m2
Factors
Mangrove Forest Width [M] Significant Wave Height [Hx1] Reduced Wave Height[Hx2] Reduction Rate
50 1,023 0,35805 0,35805
100 1,023 0,7161 0,7161
150 1,023 1,07415 0,05
200 1,023 0 1
Table 5: Reduction in wave height by mangrove forest. (Mathematical approach) (Quartel, Kroon, Augustinus, Van
Santen, & Tri, 2006)
Most Unfavorable value
Mangrove forest Width [M] Wave reduction [%]
50 0,35805
100 0,7161
150 0,925
200 0,965
Table 6: Final Reduction rates
24. 19 | P a g e
Methodology
This chapter will explain the calculation process. The first two paragraphs will be about the wave height at the dike. The other paragraphs are about the impact and design choices on the dike due to the wave run-
up.
Set-up
Because the slope is very low and there is a long foreshore the case might be that the waves already break on the foreshore. In this case a higher wave as well as set-up might occur. The Wave at the toe-construction
of the dike consists of the following components
Wave Energy from the breaking wave
Wave energy resulting from a new wave over the foreshore, H n
The total wave height at the toe-construction of the dike is given by Formula I
𝐻0 = √𝐻 𝐷
2
+ 𝐻 𝑛
2
(I)
𝐻 𝑛Will be determined using the book Toegepaste Vloeistofmechanica, Hydraulica voor waterbouwkundigen (1994)
𝐻 𝐷 Will be determined using the following Formula II
𝐻 𝐷 ≈ 0,5 ∙ ℎ (II)
This formula is of based on the slope, wave height, vegetation and soil
It is not in the interests of the research group to go further in detail into the calculation due to the difference being minimal therefore surpassing the aim of the research.
Additionally, when there is a flat slope like in the above-mentioned situation, set-up will occur. This means that the water level at the toe-construction of the dike will be higher than the actual sea level. To calculate
this Formula III is used.
𝑆 𝑢 ≈ 0,15 ∙ 𝐻 𝐵 (III)
Wave run-up
The wave run-up is calculated by the Method of Hunt, given by Formula IV:
𝑧 = √ 𝐻 ∙ 𝐿0 ∙ tan ∝ (IV)
∝=Slope
Reduction Factor
Aside from the mangroves the following reduction factor for the wave run-up will be used, this are given by Formulas V and VI
𝑧 𝑟𝑢𝑤 = 𝑧 𝑔𝑙𝑎𝑑 ∙ 𝑓𝑟 (V)
𝑓 𝑏𝑒𝑟𝑚 = (1 −
𝑏
𝐿
) (VI)
The first reduction occurs due to the revetment used. Hard revetment with uneven surface will reduce the wave run-up.
25. 20 | P a g e
Wave run-down
The wave run-down is important when using hard revetments. Due to the negative pressure under the blocks when the waves are below still water level the blocks might get pushed upwards. For the calculation
of the wave-rundown z’, formula VII will be used:
𝑧′ = 0,3 ∙ 𝐻 ∙ 𝜉 (VII)
𝜉 is the breakwater parameter and is defined by:
𝜉 =
tan 𝛼
√
𝐻
𝐿0
Revetment
The negative pressure plays an important role in the Dike Design. Due to the process of the water infiltrating and being expelled from the dike, “suction “is created. This can cause revetment to be taken out from
the dike. This translates into a force that acts in the base of the revetments against them, known as negative pressure. The aim of calculating the negative pressure is to find the minimum weight at which a certain
revetment would be safe given the target situation.
The negative pressure calculation differs by the type of construction. This can be:
Closed construction
Filter construction
Closed construction
Taking into account the current situation the revetment from the old dike can be reused and be
directly placed on the new dike together with an asphalt mortar. This leads to a watertight
construction (closed construction) that does not let the water in but thus causes the negative
pressure influence to increase.
For calculating the negative pressure on a closed construction, the formula of Hudson (VIII) is used.
𝐺 = 𝑐ℎ ∙ 𝐻3
∙ tan 𝛼 (VIII)
𝐺 = Weight of the revetment (N)
𝑐 ℎ = Hudson Coefficient
𝐻 = Wave height before toe construction
𝛼 = Slope
𝑐ℎ =
𝜌 𝑠𝑡𝑒𝑒𝑛∙𝑔
(
𝜌 𝑠𝑡𝑒𝑒𝑛−𝜌 𝑤𝑎𝑡𝑒𝑟
𝜌 𝑤𝑎𝑡𝑒𝑟
)3∙𝑘 𝐷
𝑐 ℎ = Hudson Coefficient
𝜌 𝑠𝑡𝑒𝑒𝑛 = Revetment density
𝜌 𝑤𝑎𝑡𝑒𝑟 = Water density
𝑔 = Gravitational force
𝑘 𝐷 = Stability coefficient
Filter construction
To calculate the thickness of the revetment, Formula IX.
𝑑 = (
𝜌 𝑤𝑎𝑡𝑒𝑟
𝜌 𝑠𝑡𝑒𝑒𝑛−𝜌 𝑤𝑎𝑡𝑒𝑟
) ∙ (
sin 𝛼
5 𝑐𝑜𝑠2 𝛼
) ∙ √ 𝐻 ∙ 𝐿0 (IX)
d = brick thickness
𝜌 𝑤𝑎𝑡𝑒𝑟 = Density water
𝜌 𝑠𝑡𝑒𝑒𝑛 = Density bricks
𝐻 = Wave height at the toe construction of the dike
L 0 = Wave Length in deep water (1,56 𝑇2)
26. 21 | P a g e
Analysis of the current
situation's results
Definition of the strategy Calculation of the design
Chart 8: Pre-design process
Study Area A
Pre-Design
27. 22 | P a g e
Map 1: Province of Soc Trang
Following the gather of data and evaluation of the current situation, actions
were taken for determining the right strategies for the study area.
Study Area A is located along a stretch of 700 meters that lies in the erosion
area. (See map). This region characterizes by the presence of big longshore
drift, which washes away sediment and shortens the foreshore, making the
current dike system endangered. According to the visual analysis, it is evident
that the current design is not sufficient. Many sections of the dike are
breached and others are due to collapse.
Based on the visual inspection and the evaluation of the current situation,
the existing dikes cannot withstand the reality to which they are exposed
requiring a redesign of the existing coastal protection system. These designs
will be based on the principles stated on Sustainability and Flood Measures
chapter.
Study Area A
28. 23 | P a g e
Results
The main objective of this chapter is to present concrete evidence of whether or not the actual
dike system present in this study area is able to withstand the forces to which it is exposed. For
this purpose, mathematical calculations were performed. These calculations took into account
the actual heights of the Dike system and the current water and wave heights, which the Ministry
of Agriculture and Rural Development of Soc Trang provided. The complete systematic
calculation process - in spreadsheet format – is located in Annex B - Appendix 1B. Hereby the
final output is presented in Graph 3.
Graph 3 visually portraits the results of the mathematical calculations, executed on basis of the
current values for wave, water (level) and dike heights. The calculations shown that the height of
the wave run-up overtops the existing dike, as seen in the graph. The calculations considered the
height at the crown of the dike.
When analysing both the technical drawings of the current dike system present and the reality,
the outer slope was found to be 1:2 (point 2 on the x-axis), which on the calculations - taking into
account the current wave attack - generates a Wave Run-up of 1,793 meters. This accounts for
the average slope profile of the current dike.
Because of the nonexistence of a structure for reducing wave energy, the values of the wave
run-up are very high. In fact, any small variation in the slope of the Dike led to an even bigger
change in the height of the wave run-up. This is seen by the relation of the orange curve in the
graph, representing the wave run-up, with the blue one, representing the slope of the actual
dike.
3,80
3,25
0
1
2
3
4
5
6
1/2 1/6 1/n
WaveRun-up(M)
Slope (Fraction)
Graph 3: Wave Run-up [M] - Current Situation (A)
Total Wave Run-up Height at the Crown of the Dike Wave Run-up (z)
29. 24 | P a g e
Strategy Definition
Sediment
transport
•Big longshore dritft
•Erosion of the foreshore
•Erosion of the dike's toe-construction
•Sediment transport from East to West
Existing Dike's
condition
•Usage of traditional hard-revetment
•Usage of soft-revetment (I.e.: Clay)
•Dike is due to collapse
•Current dike has many breaches
Vegetation
•Non-optimal growing conditions for the vegetation
•Destruction of mangroves for aquaculture purposes
Hinterland
•Mainly ocupied by shrimp farming properties
Wave attack
•Wave attack is classified as small
•Current slope of the foreshore leads to an increase in wave power
Chart 9: Results of the Visual Analysis (Study Area A)
The current dike is endangered. The longshore drift washes out sediment and
contributes to an increase of wave attack to the dike. Thus, the use of improper
construction techniques leads to instability of the overall construction, being an easy
target for stronger wave attacks.
The slope of the dike has a big influence on the height that the wave can reach (known
as wave run-up). As seen on Graph 3 - the current situation seen at the dike system - the
steep dike’s slope (1:2) leads to high wave run-ups causing an overtopping. It is evident
that the current protection system needs change in design and implementation.
Recommendation: It is extremely important to update the dike’s height and/or make use
of wave reduction structures in order to decrease the wave energy that reaches the dike.
A change on the construction techniques is equally important.
The following chapters will discuss the two proposed solutions for study area A.
Figure 8: Dike system’s situation at Study Area A.
31. 26 | P a g e
Strategy 1: Traditional
Location A
32. 27 | P a g e
Traditional approach
The first proposed design is drafted on basis of the traditional approach, which regards to heightening the dyke as well as
making use of proper construction techniques and materials, which have been used by the Dutch over the years. The design
generated on this approach is based on mathematical formulas that ensure that the dyke’s dimensions and design aspects are
sufficient - given the situation- as well optimized. The chapter’s structure is illustrated below:
Calculations
The calculations performed to design the dike for the traditional proposal took into account the parameters stated in table 7.
The sketch below illustrates the design of the dike and its different sections, which dimensions were determined according to
the values of the outputs, stated in table 8. In order to better optimize results, all formulas were imported into a spreadsheet,
resulting in a better workflow and flexibility. The complete calculation process, which is done in spreadsheet format, is available
in Annex B - Appendix 2B.
Input
The following parameters and their respective values were taken into account for the calculations of the traditional design
proposal.
Table 7: Input
General Parameters
Input Parameter Symbol Value
Wave height [M] H 0,55
Deep water wave height [M] H0 0,55
Wave Length [M] L 10,53
Deep water wave Length [M] L0 10,53
Wave period [s] T 2,17
Depth [M] h 1,5
Breaker depth [M] hb NONE
Berm Height
Storm water level [M] Significant wave height (Design wave) [M] Berm Height [M]
2 1,023 2,5115
According to table 7, the generated height for the Berm of the dike was set to a minimum of 2,52 meters. This value was
calculated based on the Sum of the max value registered for the high tide and the half of the design wave.
Input
Output
Optimization
Calculations
Discussion of
the final design
Conclusion
Source: THUYÉT MINH THIÉT KÉ CO SO (2010). Vietnamese Dike Design Code
Sketch 1: Traditional Profile Cross-Section. Study Area A
Chart 10: Chapter’s structure
33. 28 | P a g e
Output
The results of the calculations follow below, in table 8.
Table 8: Output
Wave Run-up
Slope H0 L0
Significant Wave
Height [H]
Slope α
(Decimals)
Wave Run-up (z)
[M]
1;3 0,55 10,53 1,023 0,33 1,136439281
Reduced Wave Run-up
Initial Wave Run-
up z [M]
Material
Revetment Fr
Reduced Wave Run-
up [M]
1,136439281 Hard revetment 0,95 1,079617317
Revetment
Filter construction
Design Wave [M]
Deep water wave
length Slope (α) ρ Revetment ρ Water
Revetment
Thickness [M]
1,023 10,53 0,33 2,4 1,025 0,14296623
Open Construction
Design Wave [M]
Hudson
Coefficient Slope (α)
Minimal Revetment
Weight (N)
1,023 46,09875068 0,33 17,08874979
Final Design Values (Dike)
Max High tide [M]
Total Wave Run-
up [M]
Dike Height
(Crown) [M] Outer Slope
2 2 4 1:3
Optimization
Some reduction factors were considered in order to optimize the design. This relates to the following parameters:
Wave run-up
Revetment
This process had the objective of determining the material that will better absorb the wave energy and their respective
dimensions in order to carry sufficiently the external factors that act on the dike. The chosen material was hard-revetment due
to the wave impact being too high, which requires a retaining structure that prevents the Dyke from being washed out. The
minimum revetment was calculated as 0,15 meters if a filter construction [geotextile/fine riprap/ hard-revetment]. In case of
an open construction [i.e.: Brabon2] the minimum weight required – based on the 1:3 slope – is 20,085 Newton, as stated in
table 8.
Conclusion
Based on this approach a strong dike and dry hinterland are ensured, assuming that the recommended values are taken into
account. The calculations and tables previously stated point to an optimal design if an outer slope of 1:3 and a dyke of 4 meters
in height (crest level) are considered.
In this design the outer slope can be made of hard revetment of a minimum of 0,15 meters in height – in case of opting for a
filter construction – and a weight of 17,1 Newton if an open construction is used. There is even the possibility of using
revetment made of asphalt and rip rap-stones, which makes it act as a closed construction type but with the possibility of fast
and cheap implementation. In this case calculation of the negative pressure are important as can assure that the revetment
remain in place and the dike is stable. Detailed design calculations regarding settlement and stability can be found in the
Geotechnical Verification chapter. The budget calculation and feasibility discussion are presented afterwards.
2 Vietnamese designed revetment made up of small riprap stones enclosed in a metal cage, usually placed on the outer slope
of a dike.
34. 29 | P a g e
Final Concept 3D View
Strategy: Traditional
Location A
37. 32 | P a g e
Advancing approach
The second proposal for the area consists on advancing into the foreshore, increasing the wave reduction zone in order to
keep the modification costs low - regarding the existing dyke - as well as creating a buffer zone for the mangroves to regenerate.
This design is composed of a bank of sand (implemented by sand nourishment techniques), a buffer zone and the existing dyke,
which may be modified according to the results of the calculations of the wave energy that reaches the Dike.
The objective of this chapter is to present substantial technical data about the design’s aspects as well as a comparison between
the two proposals. The chapter is structured according to the illustration below:
Calculations
The calculations performed for designing the dike for the advancing proposal took into account the parameters stated in table
9.The sketch below illustrates the design of the dike and its different sections, which dimensions were determined according
to the values of the outputs, stated in table 10. As this design is composed by a wave reduction zone, specifications from wave
reduction from mangroves were used in order to generate the final values of the wave height. The complete calculation process
is attached in Annex B - Appendix 2B.
Input
The same parameters used in the previous chapter were used; however, a calculation was performed to check the wave height
in case it breaks in the foreshore. This was due to the presence of the sand bank in the design, which requires a determination
of its minimum height. This value generates on basis of the summation of the wave let-through and Set-up.
Table 9: Input
General Parameters
Input Parameter Symbol Value [M]
Wave height [M] H 0,55
Deep water wave height [M] H0 0,55
Wave Length [M] L 10,53
Deep water wave Length [M] L0 10,53
Wave period [s] T 2,17
Depth [M] h 1,5
Breaker depth [M] hb NONE
Sand Nourishment Wave Height Calculation
Wave let-through HD
Foreshore developed wave
Hn
Wave at the toe-construction
Htot Set-up Total H [M]
0,75 NONE 0,75
0,112
5 0,8625
Input
Output
Calculations
Reduction in
wave energy
Comparison
Discussion of
the results
The design
considerations
Conclusion
Sketch 2: Advancing Profile Cross-Section. Study Area A
Chart 11: Chapter’s structure
38. 33 | P a g e
Output
Taking into account the calculations previously executed, the wave-reduction techniques proposed in this design suggest that
the existing dyke does not need many modifications, in fact the existing profile can be maintained with a requirement solely
of reinforcement of the key areas. These include replacing the revetment and protecting the toe-construction. The reduced
wave height was based on a decrease in wave energy based on the specifications of a mangrove forest of 100 meters in width.
Regarding the revetment asphalt didn’t show the smallest reduction in wave run-up, however it is the ideal material for the
existing dike due to its cheap and fast implementation. Table 10 summarizes the results. Dike’s Design values section portraits
the final values for the key parts of this design variant.
Table 10: Output
Wave run-up (Hunt) - Width Mangrove Forest: 100 meters
Slope H0 L0
Reduced Wave
Height
Slope α
(Decimals) Wave Run-up (z)
Reducti
on [%]
1;3 0,55 10,53 0,29 0,33 0,605520614 72%
Wave Run-up reduction
Initial Wave
Run-up (z) [M]
Material
Revetment Fr
Reduced Wave
Run-up (z) [M]
0,605520614 Asphalt 1 0,605520614
Revetment
Filter construction
Reduced Wave
height
Deep water
wave length Slope (α) ρ Revetment ρ Water
Revetment Thickness
[M]
0,29 10,53 0,33 2,4 1,025 0,076175649
Closed Construction
Reduced Wave
height
Hudson
Coefficient Slope (α)
Minimal
Revetment
Weight (N)
0,29 46,09875068 0,33 0,39102675
Dike's Design Values
Foreshore Buffer Zone Existing Dyke*
Sand
Nourishment
Crest’s height:
DTM +1 Meters
Mangrov
e Forest
Width: 100 [M]
Height at
the Crest
Actual dike's crest level
(3,5m)
Slope: 1:20 Revetment
Asphalt or Hard-
revetment (concrete
blocks)
Comparison
Reduction in wave energy
In an effort to decrease any necessary modifications to the existing dike, this design variant made use of some techniques.
Such as the implementation of structures for wave energy reduction (I.e.: wave breaker, sand bank etc.). As shown in the sketch
2 this design is composed by the following structures:
Sand bank
Buffer zone with mangrove forest
Permeable brushwood dams
The wave reaching the existing dike will be reduced by the sand-bank and the mangrove forest located on the buffer zone, thus
permeable brushwood dams will trap sediment to keep the sediment balance stable, providing the required conditions for the
mangroves to regenerate. See Mangrove vegetation chapter for more information regarding techniques and requirements
regarding implementation of mangrove forests. Graph 4 shows the effect of a mangrove forest on the height of the wave run-
up.
39. 34 | P a g e
Graph 4 was generated in order to visually portrait the effects
of mangrove forests over the height of the wave Run-up.
Each point on the x-axis was generated on basis of the
following parameters:
Wave Height (meters)
Dike’s slope (decimals)
Wave run-up (meters)
Reduction factor by width of mangrove forest
The reduced wave height is determined based on the factor
of reduction specified by the width of the mangrove forest.
Each point on the curves is a representation of the wave run-
up reaching the dike, after suffering the reduction in energy
by the mangrove belt.
It is possible to see the effect that slopes have on the height
of the wave run-up. Furthermore, it was shown that
mangroves forests up and until 100 meters in width have little
effect over the absorption of energy in steep dike slopes. In
this case, larger mangrove forests are necessary for
appropriate reduction and significant reduction in
construction costs.
0
0,4
0,8
1,2
1,6
2
2,4
2,8
3,2
3,6
4
1/2 1/6 1/n
WaveRun-upheight[M]
Dike's slope [Fraction]
Graph 4: Wave Run-up through mangrove forest
50 meters 100 meters 150 meters 200 meters
40. 35 | P a g e
Conclusion
Discussion of the Results
The aim of this subchapter is portraying visually the
differences in wave run-up height generated by the
two different proposals, which were made on basis
of the results of the wave run-up tables, available in
Annex B - Appendix 2B.
0
1
2
3
4
0
1
2
3
4
WaveRun-up(M)
Graph 6: Final Wave Run-up
Comparison between output from final designs
Existing dike's crest height
Wave Run-up Advancing Strategy
Wave Run-up Current Sit.
Wave Run-up Traditional Strategy
The current situation and the traditional proposal
generates identical primary wave run-up heights.
It is however, of high importance to take into
account that the traditional proposal dike’s design
uses some optimization techniques to reduce the
wave height as well as its guaranteed to support all
the forces to which it is exposed. In opposition of
the current encountered situation.
In case of the current situation – regarding the
total wave run-up - it was found to reach 3,8
meters, overtopping the current dike’s height of 3
meters. On the other hand, the traditional
proposal – designed with a slope of 1:3 - led to a
reduced wave run-up of 1,079 meters (against the
original 1,13 meters) and a total of 3,079 meters in
water height.
The implementation of structures that reduce the
wave energy into the design makes the advancing
proposal have the best output when it comes to
wave run-up heights.
Graph 6 shows the final wave run-up heights
generated in each proposal. It is evident that the
current scenario demands a change of action – for
instance, the height of the crest at the current dike
is smaller than the actual wave run-up.
Furthermore portraits the efficiency of the
advancing strategy: The wave run-up generated by
the final dike design proposed in this variant is 72%
smaller than the original wave run-up.
0
1
2
3
4
5
6
0 1/2 1/3 1/4 1/5 1/6 1/7 1/8 1/9 1/n
WaveRun-up(M)
Slope (Fraction)
Graph 5: Wave Run-up
A global overview at the outputs by the different
strategies
Traditional Advancing
41. 36 | P a g e
The design considerations
Graph 7 illustrates the wave run-up heights reaching a certain dike’s slope through a mangrove forest of 100 meters in width.
The best optimal level was found using the design values stated in Table 11.
Table 11: Specifications of the final design
Reduced Wave Height [M] Slope α (Decimals) Wave Run-up (z) [M]
0,29 1:3 0,66
The best reductions in wave energy happen in mangrove forests of 150 and 200 meters in width. This system however proposes
a width of 100 meters as being an optimal value. This is because most of the mangrove belts present in the area (which
measured around 100 meters in width), showed to be developing well. Thus the implementation feasibility assessment, which
assesses the difficulty ant the time span of the implementation process. This result is a system that can carry the reality
sufficiently taking into account the required safety margins, while still being easy to implement.
This variant was designed to be in first place land consistent. In other words, to be a system that aims mainly at the land besides
preventing flooding of the hinterland. The implementation of this concept into the design has been done in the form of a
mangrove forest, which reduces the wave energy that hits the existing dyke as well as acting as a filter and ecosystem stabilizer,
resulting in a better water quality as well as increasing the land value.
This system requires low maintenance and very little modifications to the existing dyke as replacement of revetment by riprap
stones covered by asphalt and the reinforcement of the toe-construction with high graded riprap stones, making it a very
balanced design with a good feasibility rate.
Taking into consideration all the mathematical thought and the respective outputs, the workability of the design – in regards
to the ability to withstand all the negative forces and its feasibility –, make it a very good fit for the area and will cause a positive
impact on all stakeholders involved.
0
0,4
0,8
1,2
1,6
2
2,4
2,8
3,2
3,6
4
1/2 1/6 1/n
WaveRun-upheight[M]
Dike's slope [Fraction]
Graph 7: Wave Run-up
Wave Run-up on Advancing's final design.
100 meters
42. 37 | P a g eFinal Concept 3D View
Strategy: Advancing
Location A
43. 38 | P a g e
Analysis of the current
situation's results
Definition of the strategy Calculation of the design
Chart 12: Pre-design process
Study Area B
Pre-Design
44. 39 | P a g e
Map 2: Province of Soc Trang
Study area B is located near Bac Lieu continuing near Vin Chau. (See
marked area in the Map) It is a stretch of 19 kilometres along the shore.
T sections and Mangrove regeneration projects have improved the
defence system over the past years. During the visual analysis, it became
clear that the dike was a lot better than Location A. Despite these efforts,
the dike system is still not sufficient. During an average high tide, the toe
construction is eroding, rapidly reducing the defensive ability and stability
of the structure. The new design waiting to be implemented will solve the
flood height issue, but not the eroding problem. This chapter will explain
the pre-design process parameters and results.
Study Area B
45. 40 | P a g e
Results
Graph 8 represents the outputs in regards to the calculations of the current situation
for study area B
According to the visual analysis the average slope of the dike was found to be 1:3 which
generates a total wave run-up of 2, 92 meters against the actual 3 meters at the crown
of the dike. The values of the wave run-up are smaller than the ones in study area A
due to the presence of mangroves, which help to decrease the wave energy reaching
the dike.
Is important to notice that the dike is not sufficient, especially due to the erosion of its
toe-construction, which compromises the stability of the whole Dike. Thus the scenario
of years to come point to an increase in sea water level, strength of storms and increase
inland subsidence. This combination of factors will surely contribute to big flooding’s in
the area and an increase on the existing problems if actions are not taken to modify the
current coastal protection system.
2,91
3,00
0
0,5
1
1,5
2
2,5
3
3,5
4
4,5
1/2 1/6 1/n
WaveRun-up(M)
Slope (Fractions)
Graph 8: Wave Run-up [M] - Current Situation (B)
Total Wave Run-up Height at the Crown of the Dike Wave Run-up (z)
46. 41 | P a g e
Strategy Definition
Sediment
transport
•Moderate outflow velocity
•Erosion of the foreshore
•Usage of T-sections to trap sediment
Existing Dike's
condition
•Usage of soft-revetment (I.e.: Clay)
•Dike is damaged
•Toe-construction is being washed out and dike's original slope has
been modified
Vegetation
•Mangrove regeneration projects. Minimum of 50 meters
Hinterland
•Mainly ocupied by shrimp farming properties
Wave attack
•Wave attack is classified as small
Chart 13: Results of the Visual Analysis (Study Area B)
Following the results from the visual analysis, shown in chart 13, and the calculations
regarding the evaluation of the current situation, supporting the statement regarding
insufficient protection, the following strategies were set in order to address the
problems in the area:
Traditional Strategy
Managed Realignment
These strategies are in accordance with the Program of Requirements, which highlights
spatial usage and valuable hinterland as two important factors in determining the
strategy. Due to the hinterland from study area B being sparsely populated, the soil being
salty and dry and mainly occupied by aquaculture properties.
Traditional Approach
Reduction of wave energy is the most important factor for these designs. Location B
already has a minimum of 50 meters of mangrove wave reduction in place, as stated in
the previous chapter. This is due to successful mangrove regeneration projects and the
implementation of T-sections. However, this reduction is not sufficient so alternative
ways to reduce the wave Energy will be implemented into the designs. For the traditional
variant, this will be hard revetment.
Managed Realignment
There are various approaches to implementing Managed Realignment. This includes:
Opening of small breaches to the existing dike in order to let sediment flow in
the buffer zone.
Keeping the existing dike as it is and placing a new dike behind.
Removal of existing dike and reuse its revetment and soil for the construction
of the new dike.
This variant will deal initially with creating a natural buffer for increasing vegetation and
an optimal design for the new dike because of wave height decrease. Moreover, the
vegetation will also increase the water quality going inland.
48. 43 | P a g e
Strategy 1: Traditional
Location B
49. 44 | P a g e
Traditional approach
The first proposed design is drafted on basis of the traditional approach, which would be to heighten the dyke as well as making
use of proper construction techniques and materials, used by the Dutch over the years. The design generated by this approach
is based on mathematical formulas that ensure that the dyke’s parameters are sufficient - given the situation- as well as that
they are optimized. This chapter is structured according to the illustration below:
Calculations
The sketch below illustrates the design of the dike and its different sections, which dimensions were determined according to
the values of the outputs, stated in table 13. All formulas for calculating the different sections and aspects of the dike were
imported in a spreadsheet, in order to have a better workflow and be able to quickly optimize results. In the following pages,
an explanation about calculations is carried out aiming on giving substantial information about the design’s reliability and
serving as a basis for comparisons between current and proposed scenario outputs. The complete set of calculations in
spreadsheet format is available in Annex B - Appendix 3B.
Input
The following parameters and their respective values were taken into account for the calculations of the traditional design
proposal.
Table 12: Input
General Parameters
Input Parameter Symbol Value
Wave height [M] H 0,55
Deep water wave height [M] H0 0,55
Wave Length [M] L 10,53
Deep water wave Length [M] L0 10,53
Wave period [s] T 2,17
Depth [M] h 1,5
Breaker depth [M] hb NONE
Berm Height
Max High tide [M] Significant wave height (Design wave) [M] Berm Height [M]
2 0,66 2,328357425
Input
Output
Optimization
Calculations
Discussion of
the results
The design
considerations
Conclusion
Source: THUYÉT MINH THIÉT KÉ CO SO (2010). Vietnamese Dike Design Code
Sketch 3: Traditional Profile Cross-Section. Study Area B
Chart 14: Chapter’s structure
50. 45 | P a g e
Output
The results of the calculations, executed on basis of the imported general parameters, are located below, in table 13.
Table 13: Output
Wave Run-up
Slope H0 L0
Significant Wave
Height [H]
Reduc
tion
Reduced Wave
Height
Slope α
(Decimals)
Wave
Run-up
(z)
1;3 0,55 10,53 1,023
0,358
05 0,66 0,33
0,910535
407
Reduced Wave Run-up
Initial Wave
Run-up z [M]
Material
Revetment Fr
Reduced Wave
Run-up [M]
0,910535407
Hard
revetment 0,95 0,865008636
Revetment
Filter construction
Design Wave
[M]
Deep water
wave length
Slope
(α) ρ Revetment
ρ
Water
Revetment
Thickness [M]
0,66 10,53 0,33 2,4 1,025 0,114547092
Open Construction
Design Wave
[M]
Hudson
Coefficient
Slope
(α)
Minimal
Revetment Weight
(N)
1,023 0 0,33 0
Final Design Values
Max High tide
[M]
Dike's Crown
Height [M]
Outer
Slope
2 3,5 01:33
Optimization
In order to optimize the design, the following reduction parameters were used:
Wave run-up
Revetment
This process has the objective of determining the material that will better absorb the wave energy and their respective
dimensions, in order to carry appropriately the external factors that act on the Dyke.
The chosen material was hard-revetment due to the wave impact being too high, which requires a retaining structure that
prevents the dike from being washed out. Based on this, the revetment thickness was determined by crossing values of reduced
wave height and the slope with some fixed parameters. The minimum revetment thickness was found to be 0,15 meters in
case of usage of a filter construction [geotextile/fine riprap/ hard-revetment]. In case of open construction type (I.e.: Brabon)
the minimum weight required – based on the 1:3 slope – is 20,085 Newton.
Conclusion
Because this design meets the standards, it will ensure a dry hinterland, allowing the area for further development. The
Calculation of the other strategies will show if this is the most suitable variant for this location. This will be determined in the
budgetary analysis chapter.
In this design the outer slope can be made of hard revetment of a minimum of 0,15 meters in height – in case of opting for a
filter construction – and a weight of 20,085 Newton if an open construction is used. There is also the possibility of using
revetment made of asphalt and rip rap-stones, which makes it act as a closed construction type but with the possibility of fast
and cost efficient implementation. Detailed design calculations regarding settlement and stability can be found in Geotechnical
Verification chapter. The budget calculation and feasibility discussion are presented afterwards.
51. 46 | P a g eFinal Concept 3D View
Strategy: Traditional
Location B
53. 48 | P a g e
Strategy 2: Managed Realignment
Location B
54. 49 | P a g e
Managed Realignment approach
The second proposal for the area will allow the sediment to flow inland, increasing the wave reduction zone. This will keep the
modification costs low while creating a buffer zone for the mangroves to regenerate. A new dike will be implemented inland
after the buffer zone. The wave attack will be significantly reduced by the buffer zone allowing the new dike to be very cost
efficient.
The objective of this chapter is to present substantial technical data about the design’s workability as well as a comparison
between the two approaches. The chapter is structured according to the illustration below:
Calculations
The calculations were carried out according to the general workflow explained before. The sketch below illustrates the design
of the dike and its different sections, which dimensions were determined according to the values of the outputs, stated in table
15. All the parameters regarding the current scenario were imported in order to generate the outputs used in the wave run-
up calculations. As this design has a wave reduction zone, specifications by wave reduction from mangroves were used in order
to generate the final values of the wave height. The complete calculation process is in Annex B - Appendix 3B.
Input
The same parameters used in the traditional approach were used; however, a calculation was performed to check the wave
height in case it breaks in the foreshore. This was due to the presence of the sand bank in the design, which requires a
determination of its minimum height. This value generates on basis of the summation of the wave let-through and Set-up.
Table 14: Input
General Parameters
Input Parameter Symbol Value [M]
Wave height [M] H 0,55
Deep water wave height
[M] H0 0,55
Wave Length [M] L 10,53
Deep water wave Length
[M[ L0 10,53
Wave period [s] T 2,17
Depth [M] h 1,5
Breaker depth [M] hb NONE
Input
Output
Calculations
Reduction in wave
energy
Land use
Comparison
Chosen design
Discussion of the
most optimal design
Conclusion
Source: THUYÉT MINH THIÉT KÉ CO SO (2010). Vietnamese Dike Design Code
Sketch 4: Managed Realignment Profile Cross-Section. Study Area B
Chart 15: Chapter’s structure
55. 50 | P a g e
Managed Realignment Wave Height Calculation
Wave let-through HD
Foreshore developed wave
Hn
Wave at the toe-construction
Htot Set-up Total H
0,75 0,5 0,901387819
0,13520817
3
1,03659599
2
Output
Taking into account the calculations previously executed, the wave-reduction techniques proposed in this design suggest that
due to the foreshore developed wave there is quite a wave run-up. However due to the mangrove belt in this strategy the
wave run-up will be significantly reduced and is in fact minimal compared to the other strategies.
The outputs in the table below give the revetment specification according to the chosen type. The reduced wave height is
based on a wave energy decrease caused by a mangrove forest of 200 meters in width.
Table 15: Output
Wave run-up (Hunt) - Width Mangrove Forest: 200 meters
Slope H0 L0
Significant Wave
Height [H]
Reduced
Wave Height Wave Run-up (z)
Reducti
on [%]
1;4 0,55 10,53 1,036595992 0,04 0,157824743 97%
Wave Run-up reduction
Initial Wave
Run-up z [M]
Material
Revetment Fr
Reduced Wave
Runup [M]
0,609531113 Grass 0,9 0,548578002
Revetment
Filter construction
Reduced Wave
height
Deep water
wave length Slope (α) ρ Revetment ρ Water
Revetment
Thickness [M]
0,04 10,53 0,25 2,4 1,025 0,021403255
Closed Construction
Reduced Wave
height
Hudson
Coefficient Slope (α)
Minimal Revetment
Weight (N)
0,04 46,09875068 0,25 0,000562139
MR Variant Design Values
Foreshore Buffer Zone Existing Dyke*
Permeable brushwood dams
Mangrove
Forest
Width: 200 [M]
Height at the
Crest
Actual dike's crest
level (3,0m)
Revetment Maintained
Toe-
construction Rip-rap Stones
Comparison
Reduction in wave energy
In an effort to decrease any necessary modifications to the existing dike, this design variant made use of some techniques.
Such as the implementation of structures for wave energy reduction (I.e.: wave breaker, sand bank etc.). As shown in the sketch
4 this design is composed by the following sections:
Existing Dike
Intertidal Buffer zone with mangrove forest
New dike
Permeable brushwood dams
The wave reaching the new dike will be greatly reduced by the existing dike and the mangrove forest located on the buffer
zone, thus the permeable brushwood dams will trap sediment to keep the sediment balance stable while providing the required
conditions for the mangroves to regenerate. See Mangrove vegetation chapter for more information regarding techniques and
requirements regarding implementation of mangrove forests.
56. 51 | P a g e
Land use
This coastal protection design makes use of concepts of
Integrated Coastal Zone Management that shift from the
traditional ‘hold-the-line’ approach of coastal protection
towards more flexible soft engineering options.
Managed realignment is a relatively new soft engineering
alternative aiming to provide sustainable flood risk
management with added environmental and socio-economic
benefits by creating space for coastal habitats to develop more
dynamically (Esteves, 2014). Managed realignment is able to
reduce both coastal flooding and erosion. It is the deliberate
process of altering flood defenses to allow flooding of a
presently defended area. Managing this process helps to avoid
uncertain outcomes and negative impacts.
There are various approaches to implementing Managed
Realignment. This includes:
Opening of small breaches to the existing dike in
order to let sediment flow in the buffer zone.
Keeping the existing dike as it is and placing a new
dike behind.
Removal of existing dike and reuse its revetment
and soil for the construction of the new dike.
In this deign it involves setting back the line of the actively
maintained defense to a new line, inwards. Doing so should
promote the creation of intertidal habitat between the old and
new defenses. (See Map 3)
Intertidal habitats attenuate incoming wave energy, meaning
that waves reaching the shore are smaller in height and less
powerful. This is advantageous, as it require hard structures of
reduced height and strength. Reduced incident wave energy is
also likely to result in reduced defense maintenance costs. This
beneficial for restoring the natural ecosystem and habitats in
the area thus improving the water quality.
Map 3: Location Coastal protection System – Managed Realignment approach (B)
1 KM
North
57. 52 | P a g e
Conclusion
This coastal protection system takes into account many variables, incorporating principles of modern coastal protection in its
design. By using strategies of Integrated Coastal Zone management, it is possible to minimize the use of hard construction
techniques, which are necessary for implementing the dike. Therefore, the costs of implementation are drastically reduced.
Besides the budget factor, the creation of an intertidal buffer zone – between the existing and new dikes – is highly beneficial
to the area as it is a proven concept for creation of a sustainable model where costal protection, biodiversity and farmlands
are part of the same cycle.
However, according to the Mekong Delta Plan (2013), in the dry season, the flow of fresh water in the coastal areas is limited.
This to the extent that increasingly groundwater is being used from deep phreatic aquifers (ca. 110 m) as an additional source
of fresh water. Both to control salinity levels in shrimp farming, enable the diversification of production into vegetables, and
homestead production (both in rice and shrimp areas). Already today, water pressures drop by 2-5 m in the dry season, forcing
farmers to lower their centrifugal pumps into the wells to enable continued pumping as water levels drop to 15-20 m below
the surface. There are strong indications that ancient (Pleistocene) deep-water layers are being depleted that are not (or very
limited) replenished from Mekong floodwaters. As shown in chart 16, this method is highly unsustainable.
The preservation of coastal mangrove forests, and its gradual regeneration and expansion is of extreme importance as it forms
a critical ecological function for the delta – not only in terms of ecology and biodiversity, but also in terms of enabling a natural
wastewater treatment capacity for the aquaculture sector and coastal defense capacity. By creation of “waste-water” disposal
areas along the intertidal buffer zone, mangroves can be actively planted and regenerated (feeding on nutrient rich brackish
water). These new, and regenerated, mangrove areas can be used to actively settle coastal sedimentation and contribute to
costal expansion and fortification system. This is possible because the intertidal buffer zone gives room for shorelines to settle
while remains open to tidal inundation.
This proven method has the capacity to sustainably improve the brackish water quality, reduce disease occurrences and yield
losses, and diversify income. In addition, it meets international certification standards of sustainability and quality, which
enables producers to enter higher value markets. The result is illustrated chart 17.
Destruction
of
mangroves
Aquaculture
farmlands
Salt water
intrusion
Wastewater
pollution
Groundwater
extraction
Depleet of
aquifers
Erosion and
land
subsidence
Chart 16: In the current scenario, the cycle is highly unsustainable.
Filter process
Use of water
by agrictulrure
and
aquaculture
Waste water
run-off
Mangrove
regeneration
Chart 17: This coastal protection design addresses all the problems in the area by creation of a sustainable cycle.
58. 53 | P a g eFinal Concept 3D View
Strategy: Managed Realignment
Location B
59. 54 | P a g e
Soil parameters
Geotechnical Verification
A Geotechnical verification was performed for each dike design in order to determine sections of the dike that are more
suitable to pressures, to check the slope stability and the amount of settlement to be expected. For these purposes soil data
obtained from Soc Trang province was used. In an effort to optimize the process and accuracy, Plaxis® software was utilized
for all calculations. Hereby will follow the tables of parameters used for all calculations and a discussion of the results
outputted from the software for each study area. The complete output is available in Annex B - Appendix 4B. This chapter is
structured in accordance to chart 18.
Table 16: Soil Properties
Property Layer
Material Clay_1 Clay_2 Clay_3 Clay_4
Material model Mohr-Coulomb Mohr-Coulomb Mohr-Coulomb Mohr-Coulomb
Material type Undrained Undrained Undrained Undrained
ϒunsat 15 Kn/m3 15 Kn/m3 16 Kn/m3 16 Kn/m3
ϒsat 18 Kn/m3 18 Kn/m3 18 Kn/m3 18,5 Kn/m3
κx 1,00E-04 1,00E-03 1,00E-02 1,00E-02
κy 1,00E-04 1,00E-03 1,00E-02 1,00E-02
Εref 1000 1000 2000 1,00E+04
ν 0,33 0,33 0,35 0,33
σref 375,94 375,94 740,741 3759,398
Εoed 1482 1482 3210 1,48E+04
Ϲref 2 5,5 2 4
Φ 24 3,6 24 25
Ψ 0 0 0 0
Strength Rigid Rigid Rigid Rigid
Soil Properties
table
Soil Parameters
Model Geometry
Output
Study Area A
Model Geometry
Output
Study Area B
Source: BÁO CÁO DIA CHÁT. Soc Trang Soil Book
The geotechnical verification was done on basis of the soil data obtained from previous surveying on soil properties of Soc
Trang province. According to BÁO CÁO DIA CHÁT (Soc Trang Soil Data Book), the soil in Soc Trang coastline is mostly composed
by clay layers that differ mostly by their permeability factors and rigidity, varying from muddy to hard plastic.
For modelling the different dike designs, different soil clusters were built and assigned to their respective soil type. The
different soil types used for the geotechnical verification are described in the following table.
Chart 18: Chapter’s structure
60. 55 | P a g e
Study Area A
Output
For the geotechnical verification the following strategies have been verified:
Traditional Strategy (Location A+B)
Advancing Strategy (Location A)
Managed Realignment Strategy (Location B)
Input and mesh parameters are constant for both locations. The following input
parameters have been maintained during the calculation:
Plain strain
Finite elements mesh
Medium Coarseness
Stability around point 1
Design steps taken:
1. Initial phase
2. Maximum High tide
3. Storm Surge with Maximum wave run-up
The variant has been verified for the following failure mechanisms:
Horizontal Settlement
Vertical Settlement
Stability
Bearing Capacity
Figure 9: Geometry models for Study Area A. Traditional and Advancing dike design variants respectively.
The calculations consisted of two phases. First the initial stress was calculated via the
input of the initial conditions by means of Gravity loading. Secondly the calculations
of the stresses resulting from the increase in water level - originated from the Wave
Run-up - were calculated.
The output views are shown in figure 10. Is possible to see the deformations of the
embankment due to the change in water level. The plot clearly shows the uplift of
the soil layers behind the embankment and the movement of the embankment itself
to the left direction as initially predicted.
Thus is evident that the undrained behaviour in the clay layers causes excess pore
pressures to develop.
Location A Traditional
Maximum Extreme displacement 17,51*10 -3m (Capacity)
Maximum Vertical displacement U y = 13,05*10-3m (Settlement)
Total incremental displacements dUtot = 6,26*10 -3m (Stability)
Location A Managed Advancing
Maximum Extreme displacement 19,45*10 -3m (Capacity)
Maximum Vertical displacement U x =10,42*10-3m (Settlement)
Total incremental displacements dUtot = 1,52*10 -3m (Stability)
The complete output is attached in Annex B - Appendix 4B.
Figure 10: Results of the geotechnical calculation for Study Area A. Visualization of the parameters has been modified by a factor of*200
Clay_1
Clay_2
Clay_2
Clay_3
Clay_4
Clay_4
Clay_1
Clay_2
Clay_3
Clay_2
Clay_4
Clay_4