Inventory (-42.2%) + Months Supply (3.6) = Seller's Market
•
0 likes•92 views

Lehigh Valley Housing Market Snapshot - November 2016: Where We Are Now vs. Where We've Been.

Recommended
More Related Content
What's hot
What's hot (20)
Viewers also liked
Viewers also liked (7)
Similar to Inventory (-42.2%) + Months Supply (3.6) = Seller's Market
Similar to Inventory (-42.2%) + Months Supply (3.6) = Seller's Market (20)
Recently uploaded
Recently uploaded (20)
Inventory (-42.2%) + Months Supply (3.6) = Seller's Market
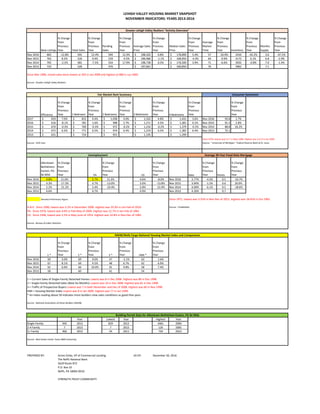
- 1. LEHIGH VALLEY HOUSING MARKET SNAPSHOT NOVEMBER INDICATORS: YEARS 2013-2016 New Listings % Change from Previous Year Total Sales % Change from Previous Year Pending Sales % Change from Previous Year Average Sales Price % Change from Previous Year Median Sales Price % Change from Previous Year Average Market Time % Change from Previous Year Inventory % Change from Previous Year Months Supply % Change from Previous Year Nov 2016 665 -12.8% 591 12.4% 594 12.3% 198,102$ 0.8% 178,000$ 5.4% 57 -10.9% 2410 -42.2% 3.6 -47.1% Nov 2015 763 8.2% 526 9.4% 529 -4.5% 196,486$ -1.1% 168,950$ -4.3% 64 -9.9% 4172 6.1% 6.8 -2.9% Nov 2014 705 -2.5% 481 -7.5% 554 17.9% 198,738$ 0.5% 176,500$ 3.9% 71 -6.6% 3932 -0.8% 7.0 -1.4% Nov 2013 723 520 470 197,661$ 169,850$ 76 3962 7.1 Since Mar 1996, closed sales were lowest at 203 in Jan 2009 and highest at 980 in Jun 2005. Source: Greater Lehigh Valley Realtors . Efficiency % Change from Previous Year 1 Bedroom % Change from Previous Year 2 Bedrooms % Change from Previous Year 3 Bedrooms % Change from Previous Year 4 Bedrooms % Change from Previous Year % Change from Previous Year 2017 659$ 7.0% 815$ 4.4% 1,038$ 4.0% 1,332$ 4.8% 1,431$ 3.6% Nov 2016 93.8 2.7% 2016 616$ -8.1% 781$ 1.6% 998$ 2.7% 1,271$ 4.5% 1,381$ 0.1% Nov 2015 91.3 2.8% 2015 670$ -0.3% 769$ -0.3% 972$ -0.2% 1,216$ -0.2% 1,379$ -0.2% Nov 2014 88.8 18.2% 2014 672$ 6.5% 771$ 6.5% 974$ 6.4% 1,219$ 6.5% 1,382$ 6.4% Nov 2013 75.1 2013 631$ 724$ 915$ 1,145$ 1,299$ Since 1978, lowest was 51.7 in May 1980. Highest was 112.0 in Jan 2000. Source: HUD User. Source: "University of Michigan." Federal Reserve Bank of St. Louis. Allentown- Bethlehem- Easton, PA- NJ MSA % Change from Previous Year PA % Change from Previous Year US % Change from Previous Year Rate % Change from Previous Year Points % Change from Previous Year Nov 2016 4.8% 11.6% 5.7% 21.3% 4.6% -8.0% Nov 2016 3.77% -4.3% 0.5 -16.7% Nov 2015 4.3% -17.3% 4.7% -13.0% 5.0% -13.8% Nov 2015 3.94% -1.5% 0.6 20.0% Nov 2014 5.2% -21.2% 5.4% -19.4% 5.8% -15.9% Nov 2014 4.00% -6.1% 0.5 -28.6% Nov 2013 6.6% 6.7% 6.9% Nov 2013 4.26% 0.7 Denotes Preliminary Figure Since 1971, lowest was 3.35% in Nov-Dec of 2012. Highest was 18.45% in Oct 1981. Source: FreddieMac. 1 * % Change from Previous Year 2 * % Change from Previous Year 3 * % Change from Previous Year HMI * % Change from Previous Year Nov 2016 69 3.0% 69 0.0% 47 -2.1% 63 1.6% Nov 2015 67 8.1% 69 4.5% 48 6.7% 62 6.9% Nov 2014 62 6.9% 66 10.0% 45 9.8% 58 7.4% Nov 2013 58 60 41 54 1 = Current Sales of Single-Family Detached Homes Lowest was 8 in Dec 2008. Highest was 86 in Dec 1998. 2 = Single-Family Detached Sales (Next Six Months) Lowest was 16 in Dec 2008. Highest was 81 in Dec 1998. 3 = Traffic of Prospective Buyers Lowest was 7 in both November and Dec of 2008. Highest was 60 in Nov 1998. HMI = Housing Market Index Lowest was 8 in Jan 2009. Highest was 77 in Jun 1999. * An index reading above 50 indicates more builders view sales conditions as good than poor. Source: National Association of Home Builders (NAHB). Year Lowest Year Highest Year Single-Family 943 2015 829 2012 4461 2004 2-4 Family 7 2015 7 2015 126 2005 5+ Family 406 2015 54 2011 734 2014 Source: Real Estate Center Texas A&M University. PREPARED BY: Annie Osika, VP of Commercial Lending AS OF: December 30, 2016 The Neffs National Bank 5629 Route 873 P.O. Box 10 Neffs, PA 18065-0010 STRENGTH.TRUST.COMMUNITY. NAHB/Wells Fargo National Housing Market Index and Components Building Permit Data for Allentown-Bethlehem-Easton, PA-NJ MSA Average 30-Year Fixed-Rate Mortgage Consumer Sentiment Unemployment US: Since 1948, lowest was 2.5% in May-June of 1953. Highest was 10.8% in Nov-Dec of 1982. Fair Market Rent Summary A-B-E: Since 1990, lowest was 3.2% in December 2000. Highest was 10.3% in Jan-Feb of 2010. PA: Since 1976, lowest was 4.0% in Feb-May of 2000. Highest was 12.7% in Jan-Feb of 1983. Greater Lehigh Valley Realtors "Activity Overview" Source: Bureau of Labor Statistics.