Study the manufacturing of Liquid insulators or Dielectric Fluids along with a discussion on their application, demand and Supply. We will also investigate Material Balance and Energy Balance during manufacturing based on which we will try to design a process flow Schema for the same.
1. Contents
ACKNOWLEDGEMENT......................................................................................................................................5
CHAPTER: 1 INTRODUCTION.........................................................................................................................6
CHAPTER: 2 DEMAND AND SUPPLY..............................................................................................................8
2.1 GLOBAL SCENARIO: ...........................................................................................................................................8
2.2 INDIAN SCENARIO
6
:...........................................................................................................................................9
2.3 RECENT TRENDS VERSUS DEMAND GROWTH:..........................................................................................................9
2.4: CASE STUDY FOR SAVING IF LIQUID DIELECTRIC IS USED INSTEAD OF NORMAL INSULATOR IN TRANSFORMERS: ..................10
CHAPTER: 3 METHODS OF PRODUCTION....................................................................................................11
3.1 PETRO-CANADA EMPLOYEES ONE OF THEIR
ǂ8
PATENTED TECHNOLOGY FOR OBTAINING ULTRA – PURITY..........................11
Two-Stage Severe Hydrocracking: .............................................................................................................11
Two-Stage Severe Hydrocracking/Hydrolsomerization: ...........................................................................12
WHAT IS LUMINOL – TR ™ ..................................................................................................................................13
3.2: ALTERNATIVE METHOD OF PRODUCTION............................................................................................................13
3.3: PROCESS DESCRIPTION (FOR TWO-STAGE SEVERE HYDROCRACKING) ............15
3.3.A: Atmospheric Distillation / Crude Distillation Unit: .......................................................................15
3.3.B: Vacuum Distillation Unit:...............................................................................................................16
3.3.C: Hydro-treating :...............................................................................................................................16
3.4: COMPARISON OF VARIOUS DIELECTRIC FLUIDS.................................................................................17
3.5: WHY? DID WE GO FOR PETRO-CANADA PROCESS??..........................................................................18
3.6: MATERIAL SAFETY DATA SHEET FOR LUMINOL TR (TYPE I TRACE – INHIBITED)........................................................19
3.7: MATERIAL SAFETY DATA SHEET FOR HYDROGEN...........................................................................................22
3.8: MATERIAL SAFETY DATA SHEET FOR HYDROGEN SULPHIDE.............................................................................25
CHAPTER: 4 MATERIAL BALANCE................................................................................................................28
4.1 CRUDE ASSAY:................................................................................................................................................28
4.2.A: MID – SULPHUR CONTENT AND MID- API VALUE CALCULATION
(FROM GRAPH.4.1.B)
.......................................................32
4.3: IMPORTANT CORRELATIONS AND CURVES USED...................................................................................................33
4.4: PRODUCT STREAM PROPERTIES.........................................................................................................................35
4.4.A: TBP for Naphtha:............................................................................................................................35
4.4.B: TBP for Kerosene:...........................................................................................................................36
4.4.C: TBP for LGO:..................................................................................................................................37
4.4.D: TBP for HGO:.................................................................................................................................38
4.2 MASS BALANCE ACROSS CRUDE DISTILLATION UNIT:..............................................................................................39
4.5: MASS BALANCE ACROSS VACUUM DISTILLATION UNIT: .........................................................................................40
CHAPTER: 5 ENERGY BALANCE ...................................................................................................................41
CHAPTER: 6 THERMODYNAMICS & KINETICS..............................................................................................42
CHAPTER: 7 EQUIPMENT DESIGN ...............................................................................................................43
7.1 DISTILLATION COLUMN DESIGN: (45 THEORETICAL STAGES) ....................................................................................43
7.1.A: Shell Design.....................................................................................................................................43
7.1.B: Head Design ....................................................................................................................................43
7.1.C: Compressive stress due Dead Loads ...............................................................................................44
7.1.D: Tensile stress due to wind load in self-supporting vessels .............................................................45
7.1.E: Stresses due to Seismic load....................................................................................................46
7.1.F: Design of Support............................................................................................................................48
2. 2 | P a g e
CHAPTER: 8 PROCESS & INSTRUMENTATION DIAGRAM.............................................................................50
8.1: PROCESS FLOW SCHEME ..........................................................................................................................50
8.2: PIPING AND INSTRUMENTATION........................................................................................................................51
CHAPTER: 9 PLANT LOCATION....................................................................................................................53
CHAPTER: 10 PLANT LAYOUT ..................................................................................................................56
CHAPTER: 11 COST ESTIMATION.............................................................................................................59
11.1 CALCULATION OF FIXED CAPITAL COST: ..............................................................................................................59
11.2 ESTIMATION OF TOTAL PRODUCT COST...................................................................................................60
11.3 GROSS INCOME.............................................................................................................................................62
11.4 DEPRECIATION [BY STRAIGHT LINE METHOD]: ....................................................................................................62
11.5 RATE OF RETURN:..........................................................................................................................................62
11.6 BREAK-EVEN POINT ANALYSIS:.........................................................................................................................63
CHAPTER: 12 SAFETY ISSUES & ETP.........................................................................................................64
REFERENCES...................................................................................................................................................65
5. 5 | P a g e
Acknowledgement
It gives me great pleasure to present my Project report on “Manufacturing of Liquid
Insulators” No work, big or small, has ever been done without the contributions of others. We
would like to express our deepest gratitude towards Mr Chetan Patel (Assistant Professor at
Chemical Engineering Department, SVNIT) who gave us his valuable suggestions,
motivation and the direction to proceed at every stage. And we also offer our sincere gratitude
all those who extended their kind and valuable guidance, indispensable help and inspiration at
times in appreciation. Lastly we would like to thank Dept. of Chemical Engineering,
SVNIT.
Thanks
6. 6 | P a g e
Chapter: 1 Introduction
Main Intent of this Project is to Study the manufacturing of Liquid
insulators or Dielectric Fluids along with a discussion on their
application, demand and Supply. We will also investigate Material
Balance and Energy Balance during manufacturing based on which
we will try to design a process flow Schema for the same.
Before we begin, it would first seem appropriate to discuss the purpose of dielectric fluids in
transformers as a baseline for discussion after all they are all most exclusively used in them.
In Transformers these dielectric fluid are used to cool the windings and provide optimal
performance and prevent fire due to short-circuit. ǂ1ǂ
Liquid Dielectric also have the advantage
of self-healing due to temporary failure during voltage surge due to flow of liquid to attacked
area but they may lead to solid deposition arising from surface breakdown. Highly purified
liquids have dielectric strengths of as high as 1MV/cm. It is important to note that natural
products have breakdown similar to gases whilst synthetic ones have drastically altered
mechanismǂ1ǂ
. Different transformers demand different properties for the fluid so, they must
be fine-tuned according to it.
From a historical perspective of Dielectric fluid development is listed as under:
Year Company Properties Examples Chemical Name
Until
1977
Most of
Companies in US
Non- Flammable, Stable
but non-biodegradable
Askarel® and
Pyranol®
Mix of
polychlorinated
biphenyls
1978 General Electric Non-Flammable, Green
House Gas Emitter
Vaportran® R-113 (Freon)
1980’s Westinghouse Non-flammable and low
cost, but had
environmental issues
Wecosol® Tetrachloroethylene,
Perchloroethylene,
(PCE)
1980 Cooper Power
Systems
Less-Flammable R-Temp®, FR3™ Blend of Petroleum
oils
Present Major Companies Non-toxic, Bio-
degradable
LUMINOL®,
Marcol 82,
Envirotemp ®
Base fluid can be
either: Mineral Oils,
Silicones, Organic
Esters, Fluorocarbons
Table 1.A : History of Fluid Dielectrics *2
7. 7 | P a g e
As of Present scenario various categories of Dielectric are:
a) Mineral Oil has now been used in generations of transformers as dielectric fluid and
is generally considered as a top choice in outdoor installations where its low first cost
prime concern.
b) Silicone has been there for several decades now; they are less-flammable dielectrics
with relatively high fire point and is generally considered to self-extinguish but are
potential cancer hazard and observe limited bio-degradability.
c) ǂ3ǂ
Organic Esters
a. Synthetic Esters :
Synthetic esters are made of acid and alcohol. The products differ in their base
materials, so the characteristics of the insulation fluids can be modified.
b. Natural Esters :
Natural ester can be saturated or unsaturated fatty acids. They are chemically
stable but have high viscosity. But in order to achieve better stability it is
necessary to add suitable antioxidants.
d) Fluorocarbons least used
ǂ1ǂ http://www.sayedsaad.com/High_voltge/files/introduction_3.htm
2* http://www.nttworldwide.com/docs/001_Dielectric_Fluids_for_Transformer_Cooling.pdf
ǂ3ǂ https://online.tugraz.at/tug_online/voe_main2.getvolltext?pCurrPk=44976
8. 8 | P a g e
Chapter: 2 DEMAND AND SUPPLY
Feed stock for production of liquid dielectric (fluid insulators) is obtained from distillation of
crude petroleum and is known as base oil in industries. This base oil is used in the production
of not only dielectrics but also for lubricants which are one and the same. So in market
research for demand and supply we will concentrate mainly on Base Oil.
2.1 Global Scenario:
Global demand per annum is estimated to be around 41 Million Kilo Litre (257.89 million
barrel) out of which 54% is used for industrial purposes from which 25% is consumed by
Asia Pacific region alone.
Globally, this industry has been growing at 2-2.5 % per annum in the past five years. In
developed countries this industry is growing at a slower rate of 1 % per annum on account of
the saturation of improved technology and better quality of oil. Asia is the 3rd
largest
market in the world and is expected in future to grow at a faster rate as compared to other
developed markets.
Globally more than 1700 players (less than 2%) control around 70% of worldwide sales.
Exxon-Mobil is the world’s largest producer of base oil; while other includes BP, Amoco and
Mobil.
Country
Per Capita Consumption
(Kg)
America 31.0
Europe 14.0
China 2.0
India 1.0
Fig. 2.1: Region wise Demand4 Table. 2. A: Per capita consumption5
9. 9 | P a g e
If we setup a plant with 10 %
production capacity of the present
demand we need a total production
of 1.26 Million Barrel/ years).
For production of 1 barrel of Base
Oil (Product) we require 84 barrels
of Crude (Feed), thus according to
our plant capacity we need 105.84
Million barrel/Years of crude or
289973 Barrel/day.
2.2 Indian Scenario6
:
We are 6th
largest producer in the market with
consumption around 1.4 million Kilolitres/year
(8.8 million barrels/ year) that is about 3.4 % of
world consumption and have a production
capacity of around 2 million kilolitres (12.6
million barrels/year) with a growth of 4% and
an effective market size of ₹ 55-60 billion.
2.3 Recent Trends versus Demand
growth:
Increasing Industrial competition due to
liberalised government policies had a
severe impact on the structure of the
Indian market. Base oil have highest
margin among refined petroleum
product and Companies earn between 20-30 times more from selling them than other
petroleum products. Such a lucrative business encouraged foreign majors like SHELL,
Exxon, Mobil, Caltex etc. to venture in Indian market.
A critical feature of such fluids is the time required before it needs to be changed called the
drain life is a function of the quality of the lubricant, the amount of contact between the two
surfaces and the length of use. Recent developments have progressively increased the drain
life as well as additional developments in electrical as well as mechanical machines have also
contributed to the same.
Presently the three main refineries: IOCL’s Haldia refinery, MRl’s Manali refinery and
HPCL’s Mumbai refinery are major suppliers but the quality of indigenous refineries is not
up to global market norms so most of the MNC’s in India imports it.
Recent usages of base oil in consumer driven sectors like pharmaceutical, cosmetics and
others can or will lead to increase in demands in near future as they will help it in moving
from commodity to a fast moving consumer good (FMCG).
Fig. 2.2: Company wise production in
India7
10. 10 | P a g e
2.4: Case Study for saving if Liquid Dielectric is used instead of normal
insulator in transformers:
Liquid Cast Dry
Purchase Price $ 35000 $ 60000 $ 38000
In INR ($1 = ₹ 54) ₹ 18,90,000 ₹ 32,40,000 ₹ 20,52,000
Operating Life (years) 35 30 25
Annual Maintenance None 6 hrs. 6 hrs.
Annual Maintenance None $360 $360
In INR ($1 = ₹ 54) None ₹ 19,440 ₹ 19,440
Outage Required for
Maintenance
N/A Y Y
Fire Hazard if not
Maintained
N Y Y
Repairable Y N N
Annual Cost of
Maintenance
$ 902 $ 1693 $ 1376
In INR ($1 = ₹ 54) ₹ 48708 Rs. 91422 ₹ 74304
Table 2.B : Cost effectiveness of Liquid Filled Transformers above others*
Fluid Relative Cost
Table 2.C : Relative
Cost according to
Fluid type
*
Mineral Oils 1
Synthetic esters 1.2
Silicones 1.3
Natural ester 1.3
Product Price Quantity Source
LUMINOL
TR
$ 832.60
₹ 44982
55 Gallons
http://www.gis-store.net/Luminol-TR-
Electrical-Insulating-Fluids-55-gal-
drum-1514-gal-LUM-TR.htm
Total
Revenue
(includes other
related products
also)
14 % of
Operating
Revenue
13000
(m3
/day)
Suncor Annual fiscal report - 2012
Table 2.D: Typical Prices and Revenue generated via Liquid Insulators and other
related Products for Petro-Canada
11. 11 | P a g e
Chapter: 3 Methods of Production
The method of production explored by us in this project is the one that Petro-Canada
Employs to Produce its Proprietary Dielectric fluid “LUMINOL-TR” by further purification
of base oils obtained for a Petroleum Refinery. Depending on the source of the base oils
process may vary but more or less it is always same. Most of the base oils are end product of
a petroleum refinery distillation process for Crude oil.
The base oil obtained from the above mentioned process is for most purposes used directly in
production of petroleum products but for the production of Dielectrics they must be severely
refined so as to minimise impurities and remove metal concentrations if any. These base oils
then act as feed stock for the production of such dielectrics.
3.1 Petro-Canada employees one of their ǂ8
patented technology for
obtaining Ultra – Purity
Two-Stage Severe Hydrocracking:
In the first stage the elimination of aromatics and impurities is achieved by
chemically reacting the feed stock with hydrogen in the presence of a catalyst, at
high temperature (400ºC) and high pressure (3000 psig). Several different
reactions occur in this hydrocracking process, the principle ones being:
i. Removal of polar compounds, containing sulphur, nitrogen and
oxygen
ii. Conversion of aromatic hydrocarbons to saturated cyclic hydrocarbons
iii. Breaking up of heavy molecules to lighter saturated hydrocarbons
The Oils are separated by distillation and chill de-waxed to improve low
temperature fluidity, and then passed through a second severe hydro-treater (290ºC
and 3000 psig) for additional saturation.
This final step maximizes base oil stability, by removing the last traces of aromatic
and polar molecules resulting in water-white stocks which are 99.9% pure. The
12. 12 | P a g e
hydrocarbon molecules that are formed are saturated and are very stable which
makes them ideal for specialty process applications.
Fig. 3.1.A: Petro – Canada Two Stage Severe Hydrocracking Process
Two-Stage Severe Hydrocracking/Hydrolsomerization:
This is similar to HT Severe Hydrocracking process but replaces he chill de-
waxing step with Hydrolsomerization wax conversion.
The Hydrolsomerization process employs a special catalyst ᵎ8
(not disclosed by company)
which selectively isomerizes wax molecules to isoparaffinic oils. The process
produces base stocks with higher Viscosity Index and improved low temperature
fluidity, compared to stocks produced with conventional de-waxing.
Fig. 3.1.B: Petro – Canada Two Stage Severe Hydrocracking/Hydrolsomerization
Process
ǂ Patent Numbers
5374348 Paul L. Sears, Theo J. W. de Bruijn, William H. Dawson, Barry B. Pruden, Anil K. Jain
5755955 N. Kelly Benham, Barry B. Pruden, Michel Roy
5972202 , 6517706 , 6004453 N. Kelly Benham, Barry B. Pruden
ᵎ company replied that they won’t disclose the catalyst when asked via a contact us section of the site : www.petro-canada.ca
13. 13 | P a g e
Both of the processes mentioned in the previous page obtain ultra-purity of 99.9% for Base
Oils as product. Now the purified Base Oil is added with various additives to impart better
stability and performance enhancements and the end product is then called LUMINOL - TRᴻ.
Main Additives are:
3.2: Alternative Method of
Production
Conventional Solvent Refining With
conventional technology, the lube distillate
fractions are separated and then treated
individually in a solvent extraction tower to
remove from 70 to 85% of impurities and
aromatics. This is followed by chill de-waxing
to improve the low temperature properties.
The result is an amber-coloured base-stock
often referred to as conventional base oil. In
some cases these stocks are further treated in a
mild hydro-finishing step to improve colour,
odour, stability and demulsibility. This hydro-
finishing step should not be confused with the
Hydrocracking or Hydro-Treating process
employed by Petro-Canada. Hydro-finishing is
done at much lower pressure (typically 800
psi) and temperature.
1 Anti-Oxidants 0.006 - 0.05 wt. %
Standard Range as Obtained from
US Patent number :
US 2007/0060484 AI
2 Dispersant 0.05 - 0.15 wt. %
3 Anti-Foaming agents 0.01 - 1.0 wt. %
4 Pour Point Dispersant 0.01 - 1.0 wt. %
5 Corrosion Inhibitors 0.1 - 0.03 wt. %
Table 3.A : Main Additives in Base Oils
What is LUMINOL – TR ™
It is an fluids
insulator proprietary of
Petro-Canada which
inherently biodegradable in
natural m free of
carcinogenic polynuclear
aromatics (PNAs) and tually
non-toxic. As well, its negative
gassing tendency d high flash
point help reduce the risk of fire
and It is ideal for use
in large power and distribution
transformers operating at peak
capacity well as free-
breathing units, pad mount, and
pole mount transformers; for
commercial, industrial and
14. 14 | P a g e
Fig. 3.2: Convectional Solvent Refining/Extraction Process
Finished Products obtained after Petro-Canada’s processes are superior to ones
obtained from Conventional Solvent Refined in several key areas like the ones
mentioned in the table below
• Viscosity Stability
Lubricants tend to thicken in service due to
Oxidation and the development of solids.
HT oils, when combined with inhibitors,
resist this thickening far longer than
conventional solvent refined oils. Thus
contributing to greater efficiency.
• Thermal Stability
Their excellent thermal stability due to the
higher level of molecular saturation. Leads
to reduced deposits and cleaner equipment.
• Oxidation Resistance
They provide superior resistance to
oxidation which allows them to be used for
extended service life in some cases up to
three times.
• Reduced Environmental Impact
These have low toxicity and biodegrade
faster due to a virtual absence of
impurities.
15. 15 | P a g e
3.3: Process Description
(for Two-Stage Severe Hydrocracking)
Select appropriate crude with low slat concentration (less than 10 lb. salt/1000 barrel) and
low sulphur content. It is than passed through the following units to product the final product
3.3.A: Atmospheric Distillation / Crude Distillation Unit:
Crude is pumped through a series of heat exchangers to rise its temperature to about 288°C
by heat exchange with product and reflux streams then again heated to about 399°C in a
furnace and charged to the flash zone of the atmospheric fractionators.
Reflux is provided by condensing the tower overhead vapours and returning a portion of the
liquid to the top of the tower, and by pump-around and pump back streams lower in the
tower. By using pump-around reflux higher fraction of the heat energy can be recovered by
preheating the feed. Several trays below the flash zone steam is introduced to strip any
remaining gas oil from the liquid in the flash zone and to produce a high-flash-point bottoms.
This fractionator normally contains 30 to 50 fractionation trays. Separation of the complex
mixtures in crude oils is relatively easy and generally five to eight trays are needed for each
side stream product plus the same number above and below the feed plate.
The liquid side stream withdrawn from the tower will contain low-boiling Components.
These light ends are stripped from each side stream in a separate small stripping tower
containing four to ten trays with steam introduced under the bottom tray. The steam and
stripped light ends are vented back into the vapour zone of the atmospheric fractionator
above their corresponding side-draw tray.
The overhead condenser on the atmospheric tower condenses the pentane and heavier
fraction of the vapours that passes out of the top of the tower. Some of this condensate is
returned to the top of the tower as reflux, and the remainder is sent to the stabilization section
of the refinery gas plant.
Here light ends + AGO are removed and sent for further processing while the atmospheric
distillation residues is sent to the Vacuum distillation unit.
16. 16 | P a g e
3.3.B: Vacuum Distillation Unit:
The furnace temperatures required for atmospheric distillation of the heavier fractions is so
high that thermal cracking occurs; therefore these heavier fractions (Atmospheric
Distillation Residue) are distilled under vacuum (25 to 40 mmHg). To improve vaporization,
the effective pressure further lowered to 10 mmHg or less by the addition of steam to the
furnace inlet and at the bottom of the vacuum tower. The amount of stripping steam used is a
function of the boiling range of the feed and the fraction vaporized, but generally ranges from
10 to 50 lb/bbl feed.
The lower operating pressures cause significant increases in the volume of vapour per barrel
vaporized as a result; the vacuum distillation columns are much larger in diameter than
atmospheric towers.
The end products of this stage are LVGO, HVGO and Vacuum Residue. While Vacuum
Residue is sent for coaking; LVGO and HVGO are blended with AGO (from CDU) to
produce the Base Oil which is sent to hydro-treating units.
3.3.C: Hydro-treating :
The base oil is feed into the unit where in the first stage elimination of aromatics and
impurities is achieved by chemically reacting the it with hydrogen in the presence of a
catalysts, at high temperature (400ºC) and high pressure (3000 psig) causing several different
reactions to occur, the principle one are:
i. Removal of polar compounds, containing sulphur, nitrogen and oxygen
ii. Conversion of aromatic hydrocarbons to saturated cyclic hydrocarbons
iii. Breaking up of heavy molecules to lighter saturated hydrocarbons
Oils further separated by distillation and chill de-waxing to improve low temperature fluidity,
and then passed through a second severe hydro-treater (290ºC and 3000 psig) for additional
saturation. This final step maximizes base oil stability, by removing the last traces of
aromatic and polar molecules resulting in water-white stocks which are 99.9% pure.
The end product of this unit is then treated with various additives to further enhance its
performance.
17. 17 | P a g e
3.4: COMPARISON OF VARIOUS DIELECTRIC FLUIDS
Fig. 3.3: Specification of Dielectric Fluids
18. 18 | P a g e
3.5: WHY? DID WE GO FOR PETRO-CANADA PROCESS??
The above question will we satisfactorily answered by a Comparison of solvent refining and
Petro-Canada’s HT purity process.
The main difference is in the virtual elimination of aromatic molecules (often less than 0.5%)
in the HT oils. By comparison, the aromatics content of Solvent Refined base oils is between
10 and 35%. Some grades of Petro-Canada base oils also utilize Hydrolsomerization if
viscosity index is a performance requirement.
CHARACTERISTIC
HT SEVERELY HYDROCRACKED ADVANTAGES
VERSUS SOLVENT REFINED
Colour HT base oils are clear and colourless
Viscosity Index
HT base oils usually have higher VI’s than Solvent
Refined base oils. Particularly in those produced via
Hydrolsomerization process.
Oxidation Resistance
HT base oils are saturated hydrocarbons and
respond well to antioxidants.
Thermal Stability
Saturated HT base oils have better resistance to heat than
Solvent Refined oils.
Carbon Residue
HT base oils have a lower carbon-forming tendency and
thus produce fewer residues.
Demulsibility
Extremely low polarity helps HT oils separate
quicker and easier from water than conventional oils.
Volatility
Higher VI and improved distillation allows
opportunity for improved volatility which produces
lower oil consumption and reduced emissions.
Low Toxicity
HT base oils have low toxicity due to the absence of
impurities. Some are so pure that they are even
used in cosmetics and pharmaceuticals.
Biodegradability
HT base oils biodegrade faster than Solvent Refined oils -
60% vs. 30%
Low Temperature
Fluidity
HT base oils (Hydrolsomerized) have virtually no wax so
their low temperature fluidity, even below the pour point,
is far superior to conventional oil.
Table 3.B : Typical Performance Data
*9
*Patented HT Purity Process Technical Data Sheet.pdf obtained from www.petro-canada.ca
19. 19 | P a g e
3.6: Material Safety Data Sheet for LUMINOL TR (Type I Trace – Inhibited)
Hazards Identification:
Oder No odour or slight petroleum oil like.
OSHA/HCS status This material is not considered hazardous by the OSHA
Hazard Communication Standard (29 CFR 1910.1200)
Emergency overview No specific hazard.
Routes of entry Dermal contact. Eye contact. Inhalation. Ingestion.
Potential acute health effects:
Eyes Slightly irritating to the eyes.
Skin Practically non-toxic in contact with skin. Slightly irritating to
the skin.
Inhalation No known significant effects or critical hazards.
Ingestion No known significant effects or critical hazards.
Medical conditions
aggravated by
overexposure
Repeated skin exposure can produce local skin destruction or
dermatitis. Repeated or prolonged contact with spray or mist
may produce chronic eye irritation and severe skin irritation.
First Aid Measures:
Eye contact In case of contact, immediately flush eyes with plenty of water
for at least 15 minutes. Get medical attention if irritation
occurs.
Skin contact Wash skin thoroughly with soap and water or use recognized
skin cleanser. Get medical attention if irritation occurs.
Remove contaminated clothing and shoes. Wash clothing
before reuse. Clean shoes thoroughly before reuse.
Inhalation If inhaled, remove to fresh air. If breathing is difficult, give
oxygen. If not breathing, give artificial respiration. Get
medical attention.
Ingestion Do not induce vomiting unless directed to do so by medical
personnel. Never give anything by mouth to an unconscious
person. If potentially dangerous quantities of this material
have been swallowed, call a physician immediately.
Protection of first-
aiders
No action shall be taken involving any personal risk or
without suitable training.
Fire fighting measures:
Flammability of the
product
May be combustible at high temperature.
Products of combustion Carbon oxides (CO, CO2), nitrogen oxides (NOx),
hydrocarbons, smoke and irritating vapours as products of
incomplete combustion.
Extinguishing media Use an extinguishing agent suitable for the surrounding
fire.
Special exposure hazards No specific hazard.
20. 20 | P a g e
Special protective
equipment for fire-fighters
Fire-fighters should wear appropriate protective equipment
and self-contained breathing apparatus (SCBA) with a full
face-piece operated in positive pressure mode.
Special remarks on fire
Hazards
Low fire hazard. This material must be heated before
ignition will occur.
Special remarks on
explosion hazards
Do not pressurize, cut, weld, braze, solder, drill, grind or
expose containers to heat or sources of ignition.
Accidental release measures:
Personal precautions Immediately contact emergency personnel. Keep unnecessary
personnel away. Use suitable protective equipment.
Environmental
precautions
Avoid dispersal of spilled material and runoff and contact with
soil, waterways, drains and sewers.
Methods for cleaning
up
If emergency personnel are unavailable, contain spilled
material. For small spills, add absorbent (soil may be used in
the absence of other suitable materials), scoop up material and
place in a sealable, liquid-proof container for disposal. For
large spills, dike
Spilled material or otherwise contain material to ensure runoff
does not reach a waterway. Place spilled material in an
appropriate container for disposal.
Handling and storage:
Handling Keep away from heat. Keep away from sources of ignition.
Empty containers pose a fire risk. Evaporate the residue under
a fume hood. Ground all equipment containing material. Do
not ingest. Do not breathe gas/fumes/ vapor/spray. Wear
suitable protective clothing. In case of insufficient ventilation,
wear suitable respiratory equipment. If ingested, seek medical
advice immediately and show the container or the label. Keep
away from incompatibles such as oxidizing agents.
Storage Keep container tightly closed. Store away from incompatible
materials. Keep container in a cool, well-ventilated area.
Exposure controls/ personal protection: Consult local authorities for acceptable
exposure limits.
Engineering measures No special ventilation requirements. Good general ventilation
should be sufficient to control airborne levels. If this product
contains ingredients with exposure limits, use process
enclosures, local exhaust ventilation or other engineering
controls to keep worker exposure below any recommended or
statutory limits.
Personal eyes
protection
Safety eyewear complying with an approved standard should
be used when a risk assessment indicates this is necessary to
avoid exposure to liquid splashes, mists, gases or dusts.
Personal skin Personal protective equipment for the body should be selected
21. 21 | P a g e
protection based on the task being performed and the risks involved and
should be approved by a specialist before handling this
product.
Respiratory Use a properly fitted, air-purifying or air-fed respirator
complying with an approved standard if a risk assessment
indicates this is necessary. Respirator selection must be based
on known or anticipated exposure levels, the hazards of the
product and the safe working limits of the selected respirator.
Recommended: organic vapour filter
Hands Chemical-resistant, impervious gloves complying with an
approved standard should be worn at all times when handling
chemical products if a risk assessment indicates this is
necessary.
Recommended: nitrile, neoprene, polyvinyl alcohol (PVA),
Viton.
Hygiene measures Wash hands, forearms and face thoroughly after handling
chemical products, before eating, smoking and using the
lavatory and at the end of the working period. Appropriate
techniques should be used to remove potentially contaminated
clothing. Wash contaminated clothing before reusing. Ensure
that eyewash stations and safety showers are close to the
workstation location.
*10
Data obtained from www.petro-canada.ca
22. 22 | P a g e
3.7: Material Safety Data Sheet for Hydrogen
Chemical Properties:
Appearance Colourless gas at normal temp. and pressure
Odour None
Molecular Weight 2.016
Boiling Point -423.0 F (-252.8 C)
Specific Gravity 0.06960
Freezing Point -434.5 F ( -259.2 C)
Vapour Pressure Not Applicable
Gas Density (@ 70 F/ 21.1
C)
0.00521 lb./ft3
(0.08342 kg/m3
)
Solubility(v/v @ 60F/ 15.6
C)
0.019
Specific Volume (@ 70F
21.1 C at 1 atm)
192 ft3
/lb. ( 11.99 m3
/kg)
Stability Stable
Hazards Identification:
Oder Odourless
OSHA/HCS status None/Hazard when conc. > 4%
Emergency overview Flammable and burns with invisible flame
Routes of entry Inhalation
Potential acute health effects:
Eyes None
Skin None
Inhalation Asphyxiate
Ingestion No known significant effects or critical hazards.
Medical conditions
aggravated by
overexposure
Exposer to an oxygen-deficient atmosphere (<19.5%) may
cause dizziness, drowsiness, nausea, vomiting, excess
salivation, diminished mental alertness, loss of consciousness
and death
First Aid Measures:
Eye contact None
Skin contact None
Inhalation Persons suffering from lack of oxygen should be removed to
fresh air. If victim is not breathing, administer artificial
respiration. If breathing is difficult, administer oxygen.
Obtain prompt medical attention.
Ingestion None
Protection of first-
aiders
None
23. 23 | P a g e
Fire fighting measures:
Flammability of the
product
Flammable at 565.5 C (1050 F)
Products of
combustion
Water
Extinguishing media CO2, dry chemical, water spray or fog for surrounding area. Do
not extinguish until hydrogen source is shut off.
Special exposure
hazards
No specific hazard.
Special remarks for
fire-fighters
Evacuate all personnel from danger area. Immediately cool
container with water spray from maximum distance, taking
care not to extinguish flames. If flames are accidentally
extinguished, explosive re-ignition may occur. Stop flow of gas
if without risk while continuing cooling water spray.
Special remarks on
explosion hazards
Burns with a pale blue, nearly invisible flame.
Hydrogen is easily ignited with low-ignition energy, including
static electricity. Hydrogen is lighter than air and can
accumulate in the upper sections of enclosed spaces. Pressure
in a container can build up due to heat, and it may rupture if
pressure relief devices should fail to function
Accidental release measures:
Methods for cleaning
up
Evacuate immediate area. Eliminate any possible sources of
ignition, and provide maximum explosion- proof ventilation.
Shut off source of hydrogen, if possible. If leaking from
cylinder, or valve, call the
Air Products' emergency phone number. The presence of a
hydrogen flame can be detected by approaching cautiously
with an outstretched straw broom to make the flame visible.
Handling and storage:
Handling Do not "open" hydrogen cylinder valve before connecting it,
since self-ignition may occur. Hydrogen is the lightest gas
known and may collect in the top of buildings without proper
ventilation. It may leak out of a system which is gas-tight for
air or other gases. Leak check system with leak detection
solution, never with flame. If user experiences difficulty
operating cylinder valve, discontinue use and contact supplier.
Use only approved CGA connections. DO NOT USE
ADAPTERS. Never insert an object (e.g., wrench,
screwdriver, pry bar, etc.) into valve cap openings. Doing so
may damage valve, causing a leak to occur. Use an adjustable
strap wrench to remove over-tight or rusted caps. Never strike
an arc on a compressed gas cylinder or make a cylinder a part
of an electrical circuit.
24. 24 | P a g e
Storage Specific requirements are listed in NFPA 50A. Cylinder
storage locations should be well- protected, well-ventilated,
dry, and separated from combustible materials. Cylinders
should never knowingly be allowed to reach a temperature
exceeding 125 F (52 C). Cylinders of hydrogen should be
separated from oxygen cylinders or other oxidizers by a
minimum distance of 20 ft., or by a barrier of non-combustible
material at least 5 ft. high having a fire resistance rating of at
least _ hour.
Cylinders should be stored upright with valve protection cap in
place and firmly secured to prevent falling or being knocked
over. Protect cylinders from physical damage; do not drag,
roll, slide or drop. Use a suitable hand truck for cylinder
movement. Post "No Smoking or Open Flames" signs in the
storage areas. There should be no sources of ignition. All
electrical equipment should be explosion proof in the storage
and use areas. Storage areas must meet national electric codes
for class 1 hazardous areas.
Exposure controls/ personal protection:
Engineering measures Provide natural or explosion-proof ventilation adequate to
ensure hydrogen does not reach its lower explosive limit of
4%.
Personal eyes
protection
Safety glasses are recommended when handling cylinders
Personal skin
protection
None
Respiratory Air supplied respirators are required in oxygen-deficient
atmospheres. Before entering area you must check for
flammable or oxygen-deficient atmospheres but for general
usage : None
Hands Work gloves are recommended when handling cylinders
*11
Data obtained from www.airliquide.ca
25. 25 | P a g e
3.8: Material Safety Data Sheet for Hydrogen Sulphide
Chemical Properties:
Appearance Colourless gas at normal temp. and pressure
Odour Stench of Rotten Eggs
Molecular Weight 34.08 g/mole ( Formula : H2S)
Boiling Point -59.99 C (-76 F)
Specific Gravity 0.06960
Freezing Point -117 F ( -82.77 C)
Vapour Pressure Not Applicable
pH <7 (conc. (%w/w): 10%)
Solubility(v/v @ 60F/ 15.6
C)
Partially soluble in the following materials: cold water.
Odour threshold 0.13 ppm
Stability Stable
Hazards Identification:
Oder Stench of Rotten Eggs
OSHA/HCS status Hazardous/ Highly Toxic when inhaled
Routes of entry Dermal contact. Eye contact. Inhalation
Potential acute health effects:
Eyes Irritating to eyes
Skin Irritating to skin.
Inhalation Very toxic by inhalation. Irritating to respiratory system.
Ingestion Since the product is a gas, it will probably be inhaled rather
than ingested. Consider first the preventive measures in case
of inhalation. May cause burns to mouth, throat and stomach
Medical conditions
aggravated by
overexposure
Pre-existing disorders involving any target organs mentioned
in this MSDS as being at risk may be aggravated by over-
exposure to this product.
First Aid Measures:
Eye contact Individual in contact with a gas should not wear contact
lenses. Check for and remove any contact lenses. In case of
contact, immediately flush eyes with plenty of water for at
least 20 minutes. Get medical attention immediately.
Skin contact In case of contact, immediately flush skin with plenty of
water. Get medical attention if symptoms occur.
Inhalation In case of inhalation, all persons, still conscious, must be
brought far from the contaminated area and allowed to breath
fresh air. The short time taken for this operation is essential.
All unconscious persons must be carried outside from the
Contaminated area and given cardiopulmonary resuscitation
26. 26 | P a g e
(CPR) with a supplementary of oxygen. Others should be
treated according to their symptoms and needs. Get medical
attention immediately.
Ingestion Since the product is a gas, it will probably be inhaled rather
than ingested. Consider first the preventive measures in case
of inhalation.
Protection of first-
aiders
Effects of contact or inhalation may be delayed. Provide
general supportive measures.
Oxygen may be beneficial. The medical doctor must be
warned that the person inhaled a very toxic gas
Fire fighting measures:
Flammability of the
product
Flammable at 259.85 C (499.7 F)
Products of combustion Decomposition products may include the following
materials: sulfur oxides
Extinguishing media Use an extinguishing agent suitable for the surrounding
fire.
Special exposure hazards Container explosion may occur under fire conditions or
when heated.
Special remarks for fire-
fighters
Promptly isolate the scene by removing all persons from
the vicinity of the incident if there is a fire. No action shall
be taken involving any personal risk or without suitable
training. Contact supplier immediately for specialist advice.
Move containers from fire area if this can be done without
risk. Use water spray to keep fire-exposed containers cool.
If involved in fire, shut off flow immediately if it can be
done without risk. If this is impossible, withdraw from area
and allow fire to burn. Fight fire from protected location or
maximum possible distance.
Special remarks on
explosion hazards
Contains gas under pressure. Flammable gas. In a fire or if
heated, a pressure increase will occur and the container
may burst, with the risk of a subsequent explosion.
Accidental release measures:
Methods for cleaning
up
Immediately contact emergency personnel. Stop leak if
without risk. Use spark-proof tools and explosion-proof
equipment. Note: see section 1 for emergency contact
information and section 13 for waste disposal.
27. 27 | P a g e
Handling and storage:
Handling Keep away from heat, sparks and flame. To avoid fire,
eliminate ignition sources. Use explosion-proof electrical
equipment (ventilating, lighting and material handling). Valve
protection caps must remain in place unless cylinder is secured
with valve outlet piped to usage point. Do not drag, slide or
roll cylinders. Use a suitable hand truck for cylinder
movement. Use a pressure regulator when connecting cylinder
to lower pressure piping or systems. Do not heat cylinder by
any means to increase the discharge rate of product from the
cylinder. Use a check valve or trap in the discharge line to
prevent hazardous back flow to the cylinder. Do not tamper
with (valve) safety device. Close valve after each use and
when empty.
Storage Protect cylinders from physical damage. Store in cool, dry,
well-ventilated area of noncombustible construction away
from heavily trafficked areas and emergency exits. Do not
allow the temperature where cylinders are stored to exceed
52°C/125°F. Cylinders must be stored upright and firmly
secured to prevent falling or being knocked over. Full and
empty cylinders should be segregated. Use a "first in - first
out" inventory system to prevent full cylinders being stored for
excessive periods of time. Post "No Smoking or Open Flames"
signs in the storage or use area. There should be no source of
ignition in the storage or use area. Segregate from oxidizing
materials.
Exposure controls/ personal protection:
Engineering measures Use only in well-ventilated areas. Gas may accumulate in
confined areas. Ensure that eyewash stations and safety
showers are close to the workstation location.
Personal eyes
protection
Splash goggles.
Personal skin
protection
Wear appropriate personal protective suit. Fire retardant
clothing may be required when handling or using flammable
products: Metal cap, safety shoes are recommended when
handling cylinders
Respiratory Respirator selection must be based on known or anticipated
exposure levels, the hazards of the product and the safe
working limits of the selected respirator.
Hands Wear suitable gloves for the application.
*12
Data obtained from www.airliquide.ca
30. 30 | P a g e
Before we proceed any further, it is well known that a refinery process stream could not be
represented by using a set of 50 – 100 components, as crude oil constitutes about a million
compounds or even more. Therefore, to aid refinery calculations, the pseudo-component
concept is being used.
According to the conception of the pseudo-component representation of the crude stream, a
crude oil is characterized to be a constituent of a maximum of 20 – 30 pseudo-component
whose average properties can be used to represent the TBP, o
API and % sulphur content of
the streams.
A pseudo‐component in a typical TBP curve is defined as a component that can represent the
average mid volume boiling point (and its average properties such as o
API and % sulphur
content).
-100
0
100
200
300
400
500
600
700
800
0 20 40 60 80 100 120
TBP
Volume %
Graph: 4.1.C: TBP vs. Volume %
32. 32 | P a g e
4.2.A: Mid – Sulphur content and Mid- API value calculation (from Graph.4.1.B)
Psuedocomponent
Number
Mid vol. API Mid Vol. SG
Mid Vol. Sulphur
(wt. %)
1 95 0.624724 0
2 85 0.65358 0.005
3 64 0.723785 0.008
4 57 0.750663 0.0095
5 52 0.771117 0.0105
6 49 0.783934 0.015
7 45 0.8017 0.02
8 41 0.82029 0.03
9 39 0.829912 0.045
10 37 0.839763 0.065
11 35 0.84985 0.095
12 31 0.870769 0.145
13 30 0.876161 0.015
14 29 0.88162 0.155
15 27 0.892744 0.169
16 25 0.904153 0.195
17 23 0.915858 0.23
18 22 0.921824 0.27
19 19 0.940199 0.33
20 18 0.946488 0.36
21 16 0.959322 0.41
Table 4.D : Calculated from Standard graphs available for Crude Assay (via
interpolation)
33. 33 | P a g e
4.3: Important Correlations and Curves Used
Fig. 4.1: Correlation curves for estimation of ASTM from TBP at end
points 15
34. 34 | P a g e
Fig. 4.2: Edminister Correlation for ASTM to TBP conversion 16
35. 35 | P a g e
4.4: Product Stream Properties
4.4.A: TBP for Naphtha:
TBP Cut-Range = -47 - 375 0
F
From, TBP vs. % distillate curve ():
Yield % = 24.78 %
From, End pt. Correlation curve (Fig. 4.1):
ASTM end pt. = 375 – 11 = 364 0
F
At 90 % Cut Distillate = 0.9 x 24.74 = 22.266 %
Now,
This 22.266 % corresponds to TBP @ 347 0
F (Data Point: 1)
Again, from 90% cut correlation:
ASTM 90% = 347 – 18 = 329 0
F (Data Point: 2)
Plotting ASTM distillation probability curve using the above obtained two data points,
We get;
A curve for ASTM vs. % Vol.
Via
Help of ASTM - TBP correlation by Edmister Method
Then using that we will get;
TBP from ASTM data.
Vol. % ASTM TBP
0
F ⌂F 0
F ⌂F
IBP 256 205
10 277 21 41.03 246.02
30 290 13 25.61 271.63
50 303 13 22.93 294.56
70 317 14 22.67 317.23
90 347 30 38.52 355.75
100 364 17 19.25 375
Table 4.E : ASTM to TBP conversion for Naphtha
36. 36 | P a g e
4.4.B: TBP for Kerosene:
TBP Cut - Range = 375 - 480 0
F
From, TBP vs. % distillate curve:
Yield % = 11.87 %
From, End pt. Correlation curve (Fig. 4.1):
ASTM end pt. = 480 – 18 = 492 0
F
At 90 % Cut distillate = 0.9 x 11.87 = 10.683 %
Now,
This 10.683 % corresponds to TBP @ 473 0
F (Data Point: 1)
Again, from 90% cut correlation:
ASTM 90% = 473 – 23 = 450 0
F (Data Point: 2)
Plotting ASTM distillation probability curve using the above obtained two data points,
We get;
A curve for ASTM vs. % Vol.
Via
Help of ASTM - TBP correlation by Edmister Method
Then using that we will get;
TBP from ASTM data.
Vol. % ASTM TBP
0
F ⌂F 0
F ⌂F
IBP 410 387.67
10 420 10 22.66 410.33
30 430 10 20.48 430.81
50 435 5 11.4 442.21
70 440 5 9.05 451.26
90 450 10 14.94 466.2
100 462 12 13.8 480
Table 4.F : ASTM to TBP conversion for Kerosene
37. 37 | P a g e
4.4.C: TBP for LGO:
TBP Cut – Range = 480 – 610 0
F
From, TBP vs. % distillate curve:
Yield % = 15.85 %
From, End pt. Correlation curve (Fig. 4.1):
ASTM end pt. = 610 - 38 = 572 0
F
At 90 % Cut distillate = 0.9 x 15.85 = 14.265 %
Now,
This 14.265 % corresponds to TBP @ 600 0
F (Data Point: 1)
Again, from 90% cut correlation:
ASTM 90% = 600 – 38 = 562 0
F (Data Point: 2)
Plotting ASTM distillation probability curve using the above obtained two data points,
We get;
A curve for ASTM vs. % Vol.
Via
Help of ASTM - TBP correlation by Edmister Method
Then using that we will get;
TBP from ASTM data.
Vol. % ASTM TBP
0
F ⌂F 0
F ⌂F
IBP 530 543.37
10 540 10 11.97 555.74
30 545 5 11.14 566.88
50 550 5 11.4 578.28
70 555 10 9.05 587.33
90 562 7 11.05 598.38
100 572 10 11.62 610
Table 4.G : ASTM to TBP conversion for LGO
38. 38 | P a g e
4.4.D: TBP for HGO:
TBP Cut - Range = 610 – 680 0
F
From, TBP vs. % distillate curve:
Yield % = 8.42 %
From, End pt. Correlation curve (Fig. 4.1):
ASTM end pt. = 680 – 37 = 643 0
F
At 90 % Cut distillate = 0.9 x 8.42 = 7.578 %
Now,
This 7.578 % corresponds to TBP @ 671 0
F (Data Point: 1)
Again, from 90% cut correlation:
ASTM 90% = 671 – 42 = 629 0
F (Data Point: 2)
Plotting ASTM distillation probability curve using the above obtained two data points,
We get;
A curve for ASTM vs. % Vol.
Via
Help of ASTM - TBP correlation by Edmister Method
Then using that we will get;
TBP from ASTM data.
Vol. % ASTM TBP
0
F ⌂F 0
F ⌂F
IBP 595 593.13
10 605 10 22.66 615.79
30 615 10 20.48 636.27
50 620 5 11.4 647.67
70 624 4 7.88 655.55
90 629 5 8.47 664.02
100 643 14 15.98 680
Table 4.H : ASTM to TBP conversion for HGO
39. 39 | P a g e
4.2 Mass Balance across Crude Distillation Unit:
A CDU produces five different products namely gas + naphtha (GN), Kerosene (K), Light
Gas Oil (L), Heavy Gas Oil (H) and Residue (R).
The steady volumetric balance for the CDU is defined as
Fcrude = FGN + FK + FL + FH + FR
Where F refers to the volumetric flow rates of various streams (crude, GN, K, L, H and R)
Stream Vol
%
Flows
(Barrels/day)
S.G. Mass Flow
Rate
(mmlbs/day)
Sulphur
content
(wt. %)
Sulphur
flow
(mmlbs/day)
Gas +
Naphtha
24.78 71855.3 0.758 19.1 0.016 0.003
Kerosene 11.87 34419.8 0.802 9.7 0.013 0.001
LGO 15.85 45960.7 0.836 13.4 0.057 0.008
HGO 8.42 24415.7 0.848 7.2 0.082 0.006
Atmospheric
Residue
39 113321.5 0.965 36.1 0.275 0.1
Crude(Total) 100 289973 0.843 85.5 0.137 0.117
Table 4.J : Mass Balance Across CDU
Component
no.
Naphtha Kerosine LGO HGO Mid B.P Mid Vol. API
Sulfur
content
(wt. %)
S.G.
1 0.00 6.50 1.84 95.00 0.00 0.62
2 0.00 75.50 5.43 85.00 0.01 0.65
3 10.78 105.50 10.02 64.00 0.01 0.72
4 45.78 135.50 15.58 57.00 0.01 0.75
5 33.57 165.50 20.80 52.00 0.01 0.77
6 9.87 9.59 195.50 25.80 49.00 0.02 0.78
7 77.20 225.50 31.39 45.00 0.02 0.80
8 13.21 255.50 37.76 41.00 0.03 0.82
9 38.98 285.50 44.39 39.00 0.05 0.83
10 61.02 19.97 315.50 51.21 37.00 0.07 0.84
11 80.03 345.50 57.80 35.00 0.10 0.85
Table 4.I: Component balance of individual pseudo-components
40. 40 | P a g e
4.5: Mass Balance across Vacuum Distillation Unit:
With atmospheric residue as feed, the VDU produces three products namely LVGO, HVGO
and Vacuum Residue.
Mass Balance expressions for the VDU are presented as follows:
FR = FLVGO + FHVGO + FVR
FRSGR = FLVGOSGLVGO + FHVGOSGHVGO + FVRSGVR
FRSGRSUR = FLVGOSGLVGOSUR + FHVGOSGHVGOSUHVGO + FVRSGVRSUVR
In these expressions, having known the volumetric flow rate of LVGO, HVGO and their
properties (SG and SU), the volumetric flow rate of the vacuum residue and the properties of
the vacuum residue (SG & SU) can be estimated.
The volumetric flow rate of the LVGO and HVGO can be obtained from their respective
yield that is evaluated using the range of the cut temperatures on the crude TBP assay.
The cut temperatures corresponding to these products are taken as follows:
a) LVGO: 680 – 780 o
F
b) HVGO: 780 – 930 o
F
c) Vacuum Residue: >930 o
F
The specific gravity and sulphur content of LVGO and HVGO are evaluated with the TBP
curve data of these products and crude S.G and Sulphur assay curves. The TBP curves of
these products is estimated by assuming that their 50% and 70 % TBP data points match with
the corresponding crude TBP cuts. This is because the end point correlation was not
providing good predictions for 100 % cut temperatures.
Eventually,
ASTM temperature evaluation is carried out using probability chart
&
The ASTM to TBP conversion is carried out using Edmister correlation.
Stream Vol %
Flows
(Barrels/day)
S.G.
Mass Flow
Rate
(mmlbs/day)
Sulphur
content
(wt. %)
Sulphur flow
(mmlbs/day)
LGO 10.12 11468.1 0.836 3.4 0.0573 0.002
HGO 12.84 14550.5 0.848 4.3 0.0891 0.004
Residue 77.04 87302.8 0.965 29.5 0.136 0.040
Crude 100 113321.4 0.843 33.4 0.137 0.046
Table 4.K : Mass Balance Across VDU
41. 41 | P a g e
Chapter: 5 Energy Balance
Number of theoretical: 45 Stage.
Feed is heated to 200 0
C in Heat Exchanger then 370 0
C in Furnace
Heat Duty of pre-flash unit Q = ⌂Hf - ⌂Hi = 91.98 – 16.9 = 75.08 Btu/lbs.
Feed input temp. = 200 0
F (into CDU at 4th
stage from bottom)
Product Output temp. = Gas + Naphtha @ 375 0
F
Kerosene @ 480 0
F
LGO @ 610 0
F
HGO @ 680 0
F
Residue @ 700 0
F
Component
Initial Enthalpy
(BTU)
Final Enthalpy
(BTU)
Mass flow
Total
enthalpy
change
(MW)
Naphtha 100 211.51 54466.3 1.7
Kerosene 94.37 267.17 27604.7 1.4
LGO 90 341.189 38423.1 2.5
HGO 90.41 395.201 20704.5 1.8
Residue 91.90 418.81 109131.4 10.5
Total 17.9
Table 5.A : Enthalpy in CDU
42. 42 | P a g e
Chapter: 6 Thermodynamics &
Kinetics
Property Component
Naphtha Kerosene LGO HGO
VABP 293.04 439.4183 577.7483 643.9683
MEABP 293.89 439.4183 577.7483 643.9683
API Gravity 55.19635 44.83423 37.77403 35.3956
Specific Gravity 0.757915 0.802453 0.835923 0.847835
Characterization
factor
11.9755 12.03 11.71 12.1472
Molecular Wt. 126.87 178.5 239.61 278
Volume % 24.78 11.87 15.85 8.42
Enthalpy 158.6871 239.82 320.206 364.3456
µrel 0.541323 1.134386 2.462195 3.660802
µcor 1.87902 5.319601 0.40272 0.021061
µ100 2.420343 6.453987 2.864915 3.681862
µ210 0.841397 1.649507 1.264734 1.539304
Flash 91.63 198.66 300.3 350.35
Weight Factor 18.78114 9.525121 13.24937 7.138774
Pour point 371.3825 444.5384 468.8942 491.1395
Mole factor 0.148035 0.053362 0.055296 0.025679
VABP Volume Average Boiling Point
MEABP Mean Average Boiling Point
Table: 6.A : Basic Kinetic Data
43. 43 | P a g e
Chapter: 7 Equipment Design
7.1 Distillation Column design: (45 theoretical Stages)
7.1.A: Shell Design
Diameter ( Di ) 2 mts.
Working/Operating Pressure 22 psia
Working temperature 370 0
C
Design temperature 407 0
C
MOC IS:200-1962, Grade I Plain Carbon Steel
Permissible tensile stress (ft) 950 kg/cm2
= 93.1 N/mm2
Elastic Modulus (E) 1.88 x 10 5
MN/m2
J=0.85 Corrosion Allowance (C.A) = 3mm
Design pressure = 1.1×Operating Pressure = 1.1×22
= 24.2 psia = 166.85 kPa
0.16685 N/mm2
Minimum thickness = ts = ((P × Di) / ((2×ft×J)- P)) + C.A
Ts = 2.108 + 3 = 5.108 mm ≈ 6 mm
7.1.B: Head Design
Shape of Head Tori-spherical
MOC IS:200-1962, Grade I Plain Carbon Steel
Permissible tensile stress (ft) 950 kg/cm2
= 93.1 N/mm2
Elastic Modulus (E) 1.88 x 10 5
MN/m2
J=0.85 Corrosion Allowance (C.A) = 3mm
MOC Density = 8500 kg/m3
Thickness of head = th = {(P × Rc × W)/ (2 × f × J)} + C.A
Rc= 2000mm
Rk = 0.06*Rc = 120mm
W= ¼ × (3 + (Rc/Rk)0.5
) = 1.0727mm
Therefore,
th = (1.77 + 3) mm ≈ 6 mm
44. 44 | P a g e
Elastic pressure = 0.366 x (1.88 x 105
) x (6/2000)2
= 0.61927 N/mm2
Elastic pressure > Working pressure [so, head is feasible]
Weight of Head:
Diameter = O.D + (O.D/24) + (2×Sf) + (2× Icr/3) [from: Brownell and Young Eq.)
Where,
O.D. = Outer diameter of the dish, inch
icr = inside cover radius, inch
sf = straight flange length, inch
From, Correlation Table of Brownell and Young
sf =1” (inch)
icr = 1¼” (inch)
This gives,
O.D = 2000 mm = 78.7402” (inch)
So,
Diameter = 78.7402 + (78.7402/24) + (2×1) + {(2×1¼)/3}
= 85.85” = 2180.59 mm
This gives
Weight of head = 211.77 kg
Axial Tensile Stress due to Pressure (fap) = P × Di/ 4(ts -c)
= 27.8 N/m2
This is the same throughout the column height.
7.1.C: Compressive stress due Dead Loads
a) Compressive stress due to Weight of shell up to a distance ‘X’ meter from top
fds = weight of shell/cross-section of shell
fds × x = (0.0085×X) N/mm2
b) Compressive stress due to weight of insulation at a height X meter (fd(ins))
Dm = (Dc+ (Dc+2ts))/2
Dm = (2000+ (2000+ (2×6)))/2 = 2006mm.
Dins =Dc+2ts+2tins = 2022.16mm
Where,
45. 45 | P a g e
Dm = Mean Dia.; Dc = Inner Dia.; Dins = Insulator Dia.
fd(ins) = 0.0098155× X kg/mm2
c) Stress due to the weight of the liquid and tray in the column up to a height X meter.
The top chamber height is 0.3 m and it does not contain any liquid or tray.
Tray spacing is 500 mm.
Average liquid density = 842.764 kg/m3
fliq-tray = [2X + 0.4] × 2660.19 kg
fd (liq) = Fliq-tray ×10/ (π× Dm× (ts - c))
= [2X + 0.4] × 2660.19 ×10/ (π ×2006× (6 - 3))
= 3.26X + 0.56 kg/mm2
e) Compressive stress due to attachments such as internals, top head, platforms and
Ladder up to height X meter.
Now,
Total weight up to height X meter = weight of top head + pipes +ladder
Taking the weight of pipes, ladder and platforms as 25 kg/m
fd (attch.) = (211.77 +25X) × 10/ π ×2000× (6 - 3)
= 0.11234 + 0.0133X Kg/mm2
SO,
total compressive dead weight stress is
fdx = fds + fins +fd (liq) + fd (attch)
0.67234 + 3.292xX kg/cm2
7.1.D: Tensile stress due to wind load in self-supporting vessels
fwx = Mw /Z
Where,
Mw = bending moment due to wind load = (wind load× distance)/2
= 0.7×Pw×D× X
2
/2
Z = modulus for the section for the area of shell
46. 46 | P a g e
fwx =1.4×Pw×X2
/ π ×Dm× (ts-c)
Pw = 25 lb/ft2
= 122.06 kg/m2
[from: Brownell and Young correlations]
Mwx = 170.884 kg-m
fwx= 1.4×122.06× X
2
/ π x 1.99× (6-3) = 3.075X
2
kg/cm2
7.1.E: Stresses due to Seismic load
fsx = Msx/ π ×Dm
2
× (ts-c)/4
Where,
Bending moment Msx at a distance X meter is given by
Msx = [C×W×X2/3] × [(3H-X)/H2]
Where,
C = seismic coefficient
W= total weight of column, kg
H = height of column
Total weight of column (W) = Cv× π ×ρm×Dm×g× (Hv+ (0.8×Dm))×ts×10
-3
Where,
W = total weight of column, excluding the internal fittings like plates, N
Cv = 1.5;a factor to account for the weight of nozzles, manways, internal supports
Hv = height or length between tangent lines (length of cylindrical section)
g = gravitational acceleration = 9.81 m/s2
t = wall thickness
ρm = density of vessel material, kg/m3
Dm = mean diameter of vessel
W = 1.5×.×8500×2.006×9.81× (4+ (0.8×2.006))×6×10⁻³
W = 26341.28 N or 2685.15 kg
Weight of plates:
Plate Area = Pi×1.992
/4 – 0.331 = 2.18 m2
Weight of each plate = 1.2×2.18 =3.336 kN
Weight of 45 plates = 45×3.336 = 1500.02 kN = 153063.26 kg
Total weight of column = 153063+2685.15 kg = 155748.41kg
Msx = [0.08×155748.41×X2/3] × [((3×24)-X)/242
]
= 4153.29X2
× [0.125-0.001736X] kg-m
47. 47 | P a g e
So,
fsx = Msx×103/π ×Dm
2
× (ts-c)/4
= [519.16X2- 0.3042X3], kg/cm2
Total stress acting on the up wind side:
ft,max = (fwx or fsx) + fap –fdx
Since, the chances of, stresses due to wind load and seismic load, to occur together is rare;
Hence, it is assumed that the stresses due to wind load and earthquake load will not occur
simultaneously. So, the maximum value of either is therefore accepted and considered for
evaluation of combined stresses.
Thus,
ft,max =3.075X2
+ 27.8 - [0.67234 + 3.292xX]
=3.075X2
- 3.292X – 27.12766 =0
Therefore X = 28.28 m
Total stress on the downwind side:
fc,max = (fwx or fsx) - fap +fdx
ft,max =0.908X2 - 188.38 + [5.225X + 1.559]
The column height is 4.5 m, for which the maximum value is
ft,max =0.908(4.5)2 - 188.38+ [5.225(4.5) + 1.559] = -144.92 kg/cm2
Hence the stress on the downwind side is tensile.
So,Hence further calculation is done by taking ft,max as allowable stress to find the height up
to that column can resist the maximum stress acting on it. If the height calculated is more
than the actual height of the column, then selected material and hence the design will be
acceptable.
ft,max =0.908X2 - 188.38 + [8.852X + 1.559]
Let,
ft,max = 0.85 × 950 =807.5 kg/cm2
Hence,
0.908X2
- 188.38 + [5.225X + 1.559] – 807.5=0
We get,
48. 48 | P a g e
X=30.34 m
Actual height of the column is 24 m
Therefore the design is acceptable
because
the height up to that it can resist
maximum permissible stress is more
than the actual height of the column.
7.1.F: Design of Support
The cylindrical shell of the skirt is designed for the combination of stresses due to vessel dead
weight, wind load and seismic load. The thickness of skirt is uniform and is designed to
withstand maximum values of tensile or compressive stresses.
Diameter 2000 mm
Height 24 mts
Weight of vessel, attachments 155748.41 Kg
Diameter of skirt (straight) 2000 mm
Height of skirt 1.0 m
Wind pressure 122.06 kg/m2
1. Stresses due to dead Weight:
fd = W(π×Dok× tsk)
where,
fd = stress
W = total weight of vessel
Dok = outside diameter of skirt,
tsk = thickness of skirt,
fd =155748.41 ×2006× tsk) = 247.88/ tsk kg/cm2
2. Stress due to wind load:
Pw = k×p1×h1×Do
Where,
p1 = wind pressure for the lower part of vessel,
k = coefficient depending on the shape factor
= 0.7 for cylindrical vessel.
Do = outside diameter of vessel,
49. 49 | P a g e
The bending moment due to wind at the base of the vessel is given by
Mw = pw ×H/2
fwb = Mw/Z = 4 ×Mw/Pi×(Dok)2
×tsk
Z- Modulus of section of skirt cross-section
pw = 0.7×122.06×1.0×2 = 765.13 kg
Mw = pw ×H/2 = 765.13×12.272/2 = 4694.84 kg-m
Substituting the values we get,
fwb = 29.88/tsk kg/cm2
3. Stress due to seismic load
Load = C×W
Where,
C = seismic coefficient,
W= total weight of column.
Stress at base,
fsb = (2/3) × (C×H×W)/ (π ×(Rok)2 × tsk
C=0.08
fsb = (2/3) × (0.08×1227.2×155748.41)/(Pi ×(200/2)2
× tsk
= 324.48/ tsk kg/cm2
Maximum tensile stress:
ft, max = (247.88/ tsk) – (29.88/ tsk) = (218/tsk) kg/cm2
Permissible tensile stress = 925 kg/cm2
Thus,
925 = (218/ tsk) => tsk = 0.23567 cm = 2.3567 mm
Maximum compressive stress:
fc, max = (247.88/ tsk) + (29.88/ tsk) = (277.76/ tsk) kg/cm2
Now,
fc, (permissible) <= (1/3) of yield point = 1500/ 3 = 500 kg/cm2
Thus, tsk = 277.76/500 = 0.55552 cm = 5.552 mm
As per IS 2825-1969, minimum corroded skirt thickness = 7 mm. Thus, use a thickness of 12
mm for the skirt.
50. 50 | P a g e
Chapter: 8 Process &
Instrumentation Diagram
8.1: Process Flow Scheme
Fig. 8.1: A typical oil refinery configuration17
51. 51 | P a g e
8.2: Piping and Instrumentation
Fig.8.2.A: Plant layout overview with controllers 18.a
Fig.8.2.B: Typical Distillation column (a) Elevation Scheme
(b) Plan 18.b
52. 52 | P a g e
Fig.8.2.C: Basic Piping and Equipment Relationship 18.d
53. 53 | P a g e
Chapter: 9 Plant Location
The location of any plant is determined by the primary (according to the region) and
secondary factors (according to the site within the region).
For the manufacturing of our end product we take crude oil as the feed stock for production.
So, the plant should be located in such a region which either has oil well nearby or is located
in such geographical region where it can be imported easily. As we know refining of crude is
the most energy hungry process hence the proposed site must have relative low power cost as
well as abundant raw material for generation of power. Water supply as always plays a major
role too.
Beside afore mentioned factors topological as well as metrological factors also contribute to a
lager extent on the plant location.
So, we propose
SURAT – (HAZIRA Special Economic Zone by Gujarat Government)
As our plant location
Reasons for the present location selection are as explained in the following table:
Surat is located on the banks of river Tapti approximately midway between Ahmedabad
and Mumbai. This city is among the fastest growing city in Asia. It is also known as the
Diamond City or the Silk City.
A) Raw Material
Availability
Due to sea port this location is best for Crude imports from various
regions of the world especially Arabian Peninsula, Mediterranean
and East – African region as well as from Mumbai, Ankleshwar
and other oil well in India.
B) Trade
Analysis
The Hazira SEZ is well connected via Air, Rail and Roads
networks and the major clientele can be provided by L&T, Essar
and ABG. As the SEZ have some big players like ONGC and
Reliance it does attract foreign traders as well. Gujarat being the
largest producer of chemical product in India provides best market
for the selling of the finished product.
C) Competition
Analysis 19
Major competition will be provided by ONGC (at Hazira), IOCL
(at Koyali), Reliance (at Jamnagar – world’s largest)
D) Energy NTPC (Kawas) : 645 MW 20.a
Ukai Hydro Power : 850 MW20.b
Kakarapara Nuclear Power Plant : 440 MW20.c
Expected to increase to a total of 1840MW by 2016
54. 54 | P a g e
E) Labour The presence of many industries has generated a large pool of
skilled labour as well as educational institute of National
Importance also enriches the technical pool.
F) Transportation The city is well connected via Rail, Road, Air and Water
Rail: Western Railway fright services
Road: National Highway 8 connects it with Mumbai (Major Port)
from south and to Ahmedabad in the north.
Air: Surat Airport connecting Delhi and Mumbai via daily flights
Water: Magadalla Port (15 Kms) , Suwali Port ( 20 Kms)
So, cheap and easy transportation.
G) Government
Policies
Special Economic zones setup by Government of Gujarat
A) DGDC SEZ, Surat
B) Essar Hazira SEZ Limited Village Hazira
Where government give exemptions from:
1) Central Sales Tax
2) Customs/excise duties
3) Income Tax (in 10 to 15 years Block)
4) Min. Alternate Tax
5) Dividend Distribution tax
6) Service Tax
Stats : Gujarat has 13 SEZ’s21
H) Finances22
The city contributes about $ 14 billion (₹ 75600 Corers) to the GDP
of the nation with a GDP/capita of $8000 (₹ 4,32,000) [2010] thus
there is no problem of long term loans from various nationalized as
well as private banks.
I) Demographic
Analysis23
Total Population : 6 Million (Rural + Urban) = 1376 person/km2
Average Literacy : 86.65 %
Ethnic Groups : Guajarati, Marathi, Marwari, Muslims, Sindhi
J) Climate
Conditions24
Tropical savannah climate, moderated strongly by the Arabian Sea.
Summer (March-June): April & May hottest months (avg Max
temp. 40 °C)
Monsoon (June- September): 39 in of rain by the end of September;
October and November see the retreat of the monsoon
Winter (December – February) :with average temperatures of
around 23 °C
55. 55 | P a g e
K) Topography Average elevation is 17 metres for Mean sea level.
L) Earthquakes
and Flood
The city is not directly situated on any fault line hence is not prone
to Major earthquakes but it does have a history of floods (occurring
in a cycle of 4years)
M) Fire and
Explosion
Safety
The city has got a good disaster response team and a well-
functioning fire – fighting service. The city has also got two civil
medical hospitals within 25 km radius.
N) War time
Venerability
It’s located away from international border. Even if war arises the
city will still be well connected via roads from the east coast of the
country.
56. 56 | P a g e
Chapter: 10 Plant Layout
Plant is the physical arrangement of equipment and facilities within a plant in order to have
optimum space utilization. An optimized plant layout help to avoid unnecessary material
handling thus also contributes in a way to reduce energy requirements
Some basic considerations for Plant Layout:
1) Maximize Safety
2) Prevent Spread of Fire
3) Facilitate easy operation and maintenance
4) Consider future expansion
5) Economize Project
Blocking: The plant site should be blocked in consideration of hazards. All blocked areas
shall be formed as square as possible by divided access roads and/or boundary lines.
Prevailing Wind: The plant layout we laid in consideration of prevailing wind direction.
25
For our proposed site location the avg. wind direction is South west (2300
) with an
average wind speed of 4knts [7.408 Km/hr]
Indication: All equipment, instruments, valving, underground drains, electrical system
should be indicated properly.
Pipes: Max. Pipe rack width shall be 10 m. If widths exceeds then make them of two stages
also allow ample space for routing of instruments and electrical conduit also provide space
for maintenance and Min. overhead clearance of 5ft. Provide 25% additional spaces for future
expansion.
Control Room: Should be located as close as possible to the plant equipment but maintaining
a min. distance mandated by safety requirements.
Fire Fighting: Each individual process units should have sufficient open space (6m min.).
Hazardous materials storage tanks should be located desirably in outer area of the site.
Safety Requirements: All process equipment should we kept at least 15 mts away from
heaters except when the heater is used for heating the process fluid. Emergency showers if
required should be located near the hazardous area if possible.
57. 57 | P a g e
So, in the light of above discussion we propose the following plant layout.
Fig: 10.1 Plant Layouts26
58. 58 | P a g e
Fig: 10.2 Rough Layout Sketch27
Nomenclature:
(1) Fired Heaters F-1 separated
from the other equipment with
a sub-pipe-way connecting the
process area to the heater area;
(2) Reboilers E-2, E-4 are
located adjacent to columns, T-
1 and T - 2
(3) The elevated overhead
condenser E-3, E-5 is located
next to the overhead
accumulator (V-1 – V-2) &
(V-3 – V-4).
(4) FF – 1 to 4 air coolers.
(5) All pumps (P-1 – P-8) are
located in a row under the pipe
- rack, and each pump and its
spare are located close to the
respective upstream suction
source.
59. 59 | P a g e
Chapter: 11 Cost Estimation
11.1 Calculation of fixed capital cost:
Price of establishing a refinery in OECD country28
is $17500 if plant capacity is 1 BSD
Let us assume that the plant is running for 325 days a year.
So,
Fixed Capital Investment = $17500 x 25498
= $ 451 million
Let average Exchange rate be,
$1 = ₹ 54
Then,
Fixed Capital Investment = ₹ 2430 crore (estimated)
ESTIMATION OF DIRECT COST
Purchased equipment cost
30% of Fixed Capital investment
₹ 730 crore
Installation including insulation and
painting
35% of purchased equipment cost
₹ 256 crore
Instrumentation and controls, installed
15 % of purchased equipment cost
₹ 110 crore
Piping installed
35 % of purchased equipment cost
₹ 256 crore
Electrical, installed
25 % of purchased equipment cost
₹ 183 crore
Buildings, process and auxiliary
30 % of purchased equipment cost
₹ 219 crore
Service facilities and yard improvements
100 % of purchased equipment cost
₹ 730 crore
Land29
₹ 5560 crore
Total Direct Costs ₹ 8040 crore
60. 60 | P a g e
ESTIMATION OF INDIRECT COSTS
Engineering and supervision
10 % of direct costs
₹ 804 crore
Construction expense and
contractor’s fees
10 % of direct costs
₹ 804 crore
Contingency
10 % of direct costs
₹ 243 crore
Total Indirect costs ₹ 1085 crore
Fixed cost = direct cost + indirect cost = ₹ 9890 crores
Total Capital investment = Fixed cost + working cost
Working cost = 20 % of total cost
Therefore,
𝑇𝑜𝑡𝑎𝑙 𝑐𝑎𝑝𝑖𝑡𝑎𝑙 𝑖𝑛𝑣𝑒𝑠𝑡𝑚𝑒𝑛𝑡 = ₹ 11900 𝑐𝑟𝑜𝑟𝑒𝑠
11.2 ESTIMATION OF TOTAL PRODUCT COST
Manufacturing cost=direct production cost + fixed charges + Plant overhead cost
A. Estimation of Fixed Charges
Depreciation cost
12 % of fixed capital investment for
machinery and equipment
and 4 % for building
₹ 96.4 crore
Local Taxes
3 % of fixed capital investment ₹ 297 crore
Insurance
0.6% of fixed capital investment
₹ 259.4 crore
Rent 10% of land and building cost ₹ 578 crore
Total Fixed charges ₹ 453 crore
61. 61 | P a g e
Fixed Charges = 10 % of Total Product Cost
Therefore,
Total Product Cost = ₹ 4530 crore
B. Direct Production Cost
Raw Material 22 % of Total product charge
(based on crude price from http://www.azernews.az/oil_and_gas/50447.html)
₹ 996 crore
Operating labour
15 % of Total product charge
₹ 679 crore
Direct supervisory and clerical labour
12 % of operating labour
₹ 81.5 crore
Utilities
12 % of Total product charge
₹ 543 crore
Maintenance and repair
5 % of fixed capital investment
₹ 495 crore
Operating supplies
15 % of Maintenance and repair
₹ 70.2 crore
Laboratory charges
15 % of operating labour
₹ 102 crore
Patent and royalties
4 % of Total product charge
₹ 272 crore
Direct Production cost ₹ 3240 crore
C. Plant overhead cost
𝑃𝑙𝑎𝑛𝑡 𝑜𝑣𝑒𝑟ℎ𝑒𝑎𝑑 𝑐𝑜𝑠𝑡 = 10 % 𝑜𝑓 𝑡𝑜𝑡𝑎𝑙 𝑝𝑟𝑜𝑑𝑢𝑐𝑡𝑖𝑜𝑛 𝑐ℎ𝑎𝑟𝑔𝑒 = 𝑅𝑠 453 𝑐𝑟𝑜𝑟𝑒𝑠
Therefore,
Total Manufacturing cost = Direct Production Cost +Total Fixed Charges +Plant Over Head Cost
= 𝑅𝑠 4150 𝑐𝑟𝑜𝑟𝑒𝑠
(i.e 72% of Total Product Cost)
D. General expenses
Administrative costs
6% of total product charge
₹ 272 crore
Distribution and selling
15% of total product charge
₹ 679 crore
Research and development costs ₹ 226 crore
62. 62 | P a g e
5 % of total product charge
Financing
10 % of total product charge
₹ 453 crore
Total general expenses ₹ 1630 crore
Now, Total production cost is estimated as:
𝑇𝑜𝑡𝑎𝑙 𝑝𝑟𝑜𝑑𝑢𝑐𝑡𝑖𝑜𝑛 𝑐𝑜𝑠𝑡 = 𝑀𝑎𝑛𝑢𝑓𝑎𝑐𝑡𝑢𝑟𝑒 𝐶𝑜𝑠𝑡 + 𝐺𝑒𝑛𝑒𝑟𝑎𝑙 𝐸𝑥𝑝𝑒𝑛𝑠𝑒𝑠 = 𝑅𝑠 5780 𝑐𝑟𝑜𝑟𝑒𝑠
11.3 Gross income
Selling price of Finished Product in India = ₹ 34584.92 / barrel
If company levy 20% extra on selling Price then,
Selling Price would be ₹ 27667.94 / barrel
Total income = Selling price × quantity of product manufactured
= 27667.94 𝑋 8371484.55 = ₹ 23162 𝑐𝑟𝑜𝑟𝑒𝑠
𝐺𝑟𝑜𝑠𝑠 𝑖𝑛𝑐𝑜𝑚𝑒 = 𝑡𝑜𝑡𝑎𝑙 𝑖𝑛𝑐𝑜𝑚𝑒 − 𝑡𝑜𝑡𝑎𝑙 𝑝𝑟𝑜𝑑𝑢𝑐𝑡𝑖𝑜𝑛 𝑐𝑜𝑠𝑡 = ₹ 17400 𝑐𝑟𝑜𝑟𝑒𝑠
11.4 Depreciation [by Straight Line Method]:
𝑉 = ₹ 730 𝑐𝑟𝑜𝑟𝑒𝑠
𝑉𝑠 = ₹ 0
We assume life of project to be 15 years.
depreciation (d) =
V
n
=
730
15
= ₹ 48.7 crores
Net income with depreciation = gross income − depreciation = ₹ 17351.3 crores
Taxation:
According to 2013 income tax slab, income tax 34 % tax is deducted from corporates
Therefore,
𝑇𝑜𝑡𝑎𝑙 𝑇𝑎𝑥 𝐴𝑚𝑜𝑢𝑛𝑡 = ₹ 589 𝑐𝑟𝑜𝑟𝑒
𝑁𝑒𝑡 𝐼𝑛𝑐𝑜𝑚𝑒 𝑤𝑖𝑡ℎ 𝑡𝑎𝑥 = G𝑟𝑜𝑠𝑠 I𝑛𝑐𝑜𝑚𝑒 – D𝑒𝑝𝑟𝑒𝑐𝑖𝑎𝑡𝑖𝑜𝑛 – T𝑎𝑥 = ₹ 11400 𝑐𝑟𝑜𝑟𝑒
11.5 Rate of return:
𝐑𝐚𝐭𝐞 𝐨𝐟 𝐫𝐞𝐭𝐮𝐫𝐧 =
𝐧𝐞𝐭 𝐩𝐫𝐨𝐟𝐢𝐭 × 𝟏𝟎𝟎
𝐭𝐨𝐭𝐚𝐥 𝐜𝐚𝐩𝐢𝐭𝐚𝐥 𝐢𝐧𝐯𝐞𝐬𝐭𝐦𝐞𝐧𝐭
=
𝟏𝟏𝟒𝟎𝟎 × 𝟏𝟎𝟎
𝟏𝟏𝟗𝟎𝟎
= 𝟗𝟔. 𝟑𝟕%
63. 63 | P a g e
11.6 Break-Even point analysis:
Direct Production Cost = ₹ 8040 crore
Total Annual sale = ₹ 23162.2 crore
Total Fixed Charges = ₹ 453 crore
Direct Production Cost / barrel = ₹ 540.65
N = Break Even Point = ₹
𝟒𝟓𝟑
(𝟐𝟕𝟔𝟔𝟕.𝟗𝟒−𝟓𝟒𝟎.𝟔𝟓)
= 𝟏𝟔𝟔𝟖𝟒𝟓. 𝟖𝟒
𝐛𝐚𝐫𝐫𝐞𝐥𝐬
𝐲𝐞𝐚𝐫
Or,
Min production of 1.99 % of Plant capacity is required to reach the Break Even Point.
Pay-out Time = ₹
𝟏𝟏𝟗𝟎𝟎
(𝟏𝟏𝟒𝟎𝟎−𝟒𝟖.𝟕)
= 1.03 years
64. 64 | P a g e
Chapter: 12 Safety Issues & ETP
The refining process releases a number of different chemicals into the atmosphere and a
notable odour normally accompanies the presence of a refinery. Aside from air pollution
impacts there are also wastewater concerns risks of industrial accidents such as fire and
explosion, and noise health effects due to industrial noise.
Many governments worldwide have mandated restrictions on contaminants that refineries
release, and most refineries have installed the equipment needed to comply with the
requirements of environmental protection regulatory agencies.
Environmental and safety concerns mean that oil refineries are sometimes located some
distance away from major urban areas. Nevertheless, there are many instances where refinery
operations are close to populated areas and pose health risks.
Fire Prevention and Protection:
a) Control of both hydrocarbon leaks and hydrogen releases is important to prevent fires.
b) Low boiling point components of crude may also be released if a leak occurs.
c) In some processes, care is needed to ensure that explosive concentrations of catalytic
dust do not form during recharging.
d) Relief systems should be provided for overpressure and operations monitored to
prevent crude from entering the reformer charge.
Safety:
a) High operating temperatures and Corrosion, which occurs due to the presence of
hydrogen sulphide, hydrogen chloride, naphthenic (organic) acids, and other
contaminants in the crude oil, can causes equipment failure.
b) Inspection and testing of safety relief devices are important.
c) Proper process control is needed to protect against plugging reactor beds.
Health:
a) Because this is a closed process, exposures are expected to be minimal under normal
operating conditions.
b) There is a potential for exposure to hydrocarbon gas and vapour emissions, hydrogen
and hydrogen sulphide gas due to high-pressure leaks.
c) Large quantities of carbon monoxide may be released during catalyst regeneration and
changeover.
d) The wastewater will contain varying amounts of chlorides, sulphides, bicarbonates,
ammonia, hydrocarbons, phenol, and suspended solids.
e) Diatomaceous earth if used in filtration, then its exposures should be minimized or
controlled. Diatomaceous earth can contain silica in very fine particle size, making
this a potential respiratory hazard
f) Safe work practices and/or the use of appropriate personal protective equipment may
be needed for exposure to chemicals and other hazards such as noise and heat, during
process sampling, inspection, maintenance, and turnaround activities, and when
handling spent catalyst.
65. 65 | P a g e
References
Sr.
No.
Link/ Name
Date
Accessed
1 http://www.sayedsaad.com/High_voltge/files/introduction_3.ht
ml
Revisited (6th
May 2013)
2 http://www.nttworldwide.com/docs/001_Dielectric_Fluids_for_
Transformer_Cooling.pdf
3
https://online.tugraz.at/tug_online/voe_main2.getvolltext?pCurr
Pk=44976
12th
Dec
2012
4,5,6,
7
http://crisil.com/Ratings/Commentary/CommentaryDocs/lubart.
pdf
6th
May
2013
8
Patent Numbers : 5374348 ,5755955, 5972202 , 6517706 ,
6004453
9 Petro Canada, Patented HT Purity Process Technical Data Sheet
10 MSDS Data Sheet, www.petro-canada.ca
Revisited (6th
May 2013)
11,12 MSDS Data Sheet, www.airliquide.ca
Revisited (6th
May 2013)
13,14 Crude Assays , http://petroleum.nic.in/refi.htm
6th
May
2013
15,16
Maxwell, J.B, Data Book on Hydrocarbon, 9th Ed. 1968, Van
Nostrand
17
Chevron Petroleum’s Website , Article on Hydrocracking 20th
Dec
2012
18.a,
18.b,
18.d,
26,27
Kirk-Othmer Encyclopaedia of Chemical Technology, John
Wiley & Son
19 Ministry of Petroleum, website
6th
May
2013
20.a,,
NTPC website
http://www.ntpc.co.in/index.php?option=com_content&view=ar
8th
May
66. 66 | P a g e
20.c ticle&id=311&Itemid=83 2013
20.b
Gujarat State Electricity Board (website),
http://www.gsecl.in/ukai.html
8th
May
2013
21,22
,24
Wikipedia, The Free Web – Encyclopaedia
7th
May
2013
23
Census Data 2011,
http://www.census2011.co.in/census/district/206-surat.html
8th
May
2013
25
Metrological Data from wind-finder’s website :
http://www.windfinder.com/report/surat_gujarat
11th
May
2013
28 Article on Reliance Refineries, Wikipedia
9th
May
2013
29
Petroleum Refining Technology and Economics, 4th Ed, Marcel
Dekker, Inc. 2001
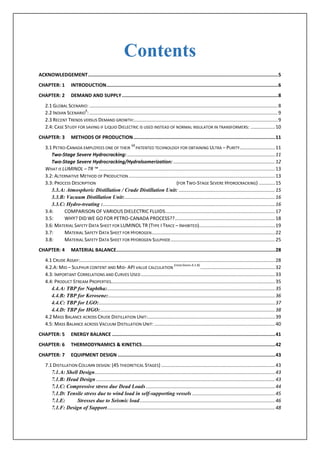
![2 | P a g e
CHAPTER: 8 PROCESS & INSTRUMENTATION DIAGRAM.............................................................................50
8.1: PROCESS FLOW SCHEME ..........................................................................................................................50
8.2: PIPING AND INSTRUMENTATION........................................................................................................................51
CHAPTER: 9 PLANT LOCATION....................................................................................................................53
CHAPTER: 10 PLANT LAYOUT ..................................................................................................................56
CHAPTER: 11 COST ESTIMATION.............................................................................................................59
11.1 CALCULATION OF FIXED CAPITAL COST: ..............................................................................................................59
11.2 ESTIMATION OF TOTAL PRODUCT COST...................................................................................................60
11.3 GROSS INCOME.............................................................................................................................................62
11.4 DEPRECIATION [BY STRAIGHT LINE METHOD]: ....................................................................................................62
11.5 RATE OF RETURN:..........................................................................................................................................62
11.6 BREAK-EVEN POINT ANALYSIS:.........................................................................................................................63
CHAPTER: 12 SAFETY ISSUES & ETP.........................................................................................................64
REFERENCES...................................................................................................................................................65](data:image/gif;base64,R0lGODlhAQABAIAAAAAAAP///yH5BAEAAAAALAAAAAABAAEAAAIBRAA7)