
Recommended
Recommended
More Related Content
What's hot
What's hot (20)
Similar to Municipal Market Data & U.S. Treasury Data Comparison
Similar to Municipal Market Data & U.S. Treasury Data Comparison (12)
Recently uploaded
Recently uploaded (20)
Municipal Market Data & U.S. Treasury Data Comparison
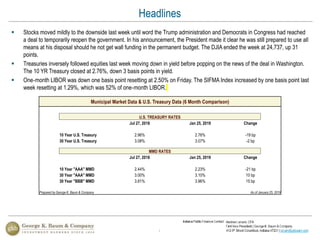
- 1. 1 Municipal Market Data & U.S. Treasury Data (6 Month Comparison) U.S. TREASURY RATES Jul 27, 2018 Jan 25, 2019 Change 10 Year U.S. Treasury 2.96% 2.76% -19 bp 30 Year U.S. Treasury 3.08% 3.07% -2 bp MMD RATES Jul 27, 2018 Jan 25, 2019 Change 10 Year "AAA" MMD 2.44% 2.23% -21 bp 30 Year "AAA" MMD 3.00% 3.10% 10 bp 30 Year "BBB" MMD 3.81% 3.96% 15 bp Prepared by George K. Baum & Company As of January 25, 2019 Stocks moved mildly to the downside last week until word the Trump administration and Democrats in Congress had reached a deal to temporarily reopen the government. In his announcement, the President made it clear he was still prepared to use all means at his disposal should he not get wall funding in the permanent budget. The DJIA ended the week at 24,737, up 31 points. Treasuries inversely followed equities last week moving down in yield before popping on the news of the deal in Washington. The 10 YR Treasury closed at 2.76%, down 3 basis points in yield. One‐month LIBOR was down one basis point resetting at 2.50% on Friday. The SIFMA Index increased by one basis point last week resetting at 1.29%, which was 52% of one‐month LIBOR. Headlines
- 2. 2 Current Municipal Market Data Maturity "AAA" "AA" "A" "BBB" 5-year 1.82% 1.88% 2.23% 2.58% 10-year 2.23% 2.39% 2.71% 3.08% 20-year 2.94% 3.14% 3.44% 3.80% 30-year 3.10% 3.30% 3.61% 3.96% Prepared by George K. Baum & Company As of January 25, 2019 Rates continue to be lower than historical averages. To date, 30 Year ‘AAA’ MMD is 103 basis points below the 20 year historical average. Historical Fixed Rate Analysis UST Rates 'AAA' MMD Bond Buyer Indices Data 10-Year 30-Year 10-Year % UST 30-Year % UST 20 GO 25 Rev Spot Rate 2.76 3.07 2.23 80.8 3.10 101.1 4.23 4.70 1-Mo Prior 2.72 3.02 2.27 83.5 2.99 98.9 4.10 4.58 1-Yr Prior 2.66 2.91 2.23 83.8 2.81 96.5 3.59 4.08 5 Yr Avg 2.34 2.94 2.11 90.2 2.95 100.1 3.75 4.19 10 Yr Avg 2.51 3.34 2.30 91.8 3.41 102.3 4.02 4.59 Historical Data Since January 1999 (20 Years) Min 1.36 2.10 1.31 96.4 1.95 92.9 2.80 2.98 Max 6.77 6.70 5.37 79.4 6.04 90.2 6.09 6.48 Avg 3.59 4.21 3.15 87.8 4.13 98.1 4.45 4.93 Prepared by George K. Baum & Company As of January 25, 2019 Today’s Capital Markets
- 3. 3 0.00 1.00 2.00 3.00 4.00 5.00 6.00 7.00 1 5 10 15 20 25 30 % Maturity As of January 25, 2019 'AAA' MMD 'AA' MMD 'A' MMD 'BBB' MMD Current Market "MMD" Yield CurveCurrent MMD Yield Curve The Current MMD yield curve continues to remain positively sloped. Long Term Fixed Interest Rates
- 4. 4 0.00 0.50 1.00 1.50 2.00 2.50 3.00 3.50 1 5 10 15 20 25 30 % Maturity January 2018 to Present Jan 25, 2019 Dec 28, 2018 Jul 27, 2018 Jan 26, 2018 Historical 'AAA' MMD Yield Curve Long Term Fixed Interest Rates Since January 12, 2018, 30 Year ‘AAA’ MMD rates have increased 39 basis points.
- 5. 5 0.00 1.00 2.00 3.00 4.00 5.00 6.00 7.00 8.00 1999 2000 2001 2002 2003 2004 2005 2006 2007 2008 2009 2010 2011 2012 2013 2014 2015 2016 2017 2018 2019 % January 1999 to Present UST 2 Yr UST 5 Yr UST 10 Yr UST 30 Yr 20 Year Historical U.S. Treasury Data Long Term Fixed Interest Rates
- 6. 6 0.00 1.00 2.00 3.00 4.00 5.00 6.00 7.00 8.00 1999 2000 2001 2002 2003 2004 2005 2006 2007 2008 2009 2010 2011 2012 2013 2014 2015 2016 2017 2018 2019 % January 1999 to Present 10 Yr 'AAA' MMD 10 Yr 'AAA' MMD Avg 10 Yr UST 10 Yr UST Avg 10 Yr UST to MMD % Current Market "MMD" Yield Curve20 Year Historical 'AAA' MMD & U.S. Treasury Data 10 Year U.S. Treasuries and 10 Year ‘AAA’ MMD remain highly correlated at 97%. Long Term Fixed Interest Rates
- 7. 7 0.00 2.00 4.00 6.00 8.00 10.00 12.00 1986 1988 1990 1992 1994 1996 1998 2000 2002 2004 2006 2008 2010 2012 2014 2016 2018 % May 1986 to Present BB 25 Rev Bond Index Average (5.63%) Current (4.70%) Current Market "MMD" Yield CurveHistorical Bond Buyer 25 Revenue Bond Index The Bond Buyer 25 Revenue Bond Index is currently at 4.70% compared to the average of 5.63%. Long Term Fixed Interest Rates
- 8. 8 0.00 0.50 1.00 1.50 2.00 2.50 3.00 3.50 4.00 4.50 2009 2010 2011 2012 2013 2014 2015 2016 2017 2018 2019 % January 2009 to Present SIFMA Swap 30 Yr SIFMA Swap 20 Yr SIFMA Swap 10 Yr 67% 1M LIBOR Swap 30 Yr 67% 1M LIBOR Swap 20 Yr 67% 1M LIBOR Swap 10 Yr Current Market "MMD" Yield Curve10 Year Hist Swap Rates: 10, 20, 30 Yr SIFMA & 67% of 1M LIBOR The 30 Year SIFMA swap rate decreased 2 basis points, while the 30 Year 67% of 1M LIBOR swap rate decreased 2 basis points from the prior week. Long Term Swap Rates
- 9. 9 0.00 1.00 2.00 3.00 4.00 5.00 6.00 7.00 8.00 9.00 1999 2000 2001 2002 2003 2004 2005 2006 2007 2008 2009 2010 2011 2012 2013 2014 2015 2016 2017 2018 2019 % January 1999 to Present SIFMA Index 67% of 1M LIBOR Current Market "MMD" Yield Curve20 Year Variable Rate History: 67% of 1M LIBOR & SIFMA Data The SIFMA Index reset at 1.29, up 1 basis point from the prior week. Short Term Variable Interest Rates
- 10. 10 0.00 1.00 2.00 3.00 4.00 5.00 6.00 7.00 1 5 10 15 20 25 30 % Maturity As of January 25, 2019 BBB SIFMA Swap Rate 67% of 1M LIBOR Swap Rate Current Market "MMD" Yield CurveCurrent Market 'BBB' MMD Yield Curve & Swap Rates Current 30 Year 67% of 1M LIBOR swap rates and 30 Year SIFMA swap rates are showing much lower rates than Current ‘BBB’ rates in the market. Current ‘BBB’ MMD & Variable Interest Rates
- 11. 11 0.00 1.00 2.00 3.00 4.00 5.00 6.00 7.00 8.00 9.00 1999 2000 2001 2002 2003 2004 2005 2006 2007 2008 2009 2010 2011 2012 2013 2014 2015 2016 2017 2018 2019 % January 1999 to Present SIFMA Index 1M LIBOR BB 25 Rev Index UST 10 Yr 20 Year Historical Benchmark Rates The following data shows the divergence between current variable and fixed rate indices. Historical Benchmark Rates
- 12. 12 0 50 100 150 200 250 300 0.00 1.00 2.00 3.00 4.00 5.00 6.00 7.00 8.00 9.00 10.00 1999 2001 2003 2005 2007 2009 2011 2013 2015 2017 2019 Spread (bps)% January 1999 to Present 30 Yr 'BBB' MMD Spread 30 Yr 'A' MMD Spread 30 Yr 'AA' MMD Spread 30 Yr 'AAA' MMD Current Market "MMD" Yield Curve20 Year Historical 'AAA' MMD Tax -Exempt Credit Spread Data Current Tax Exempt Credit Spreads are 20, 51, and 86, basis points for ‘AA’, ‘A’, and ‘BBB’ respectively ‘AAA’ MMD Tax-Exempt Credit Spreads
- 13. 13 ($4,000) ($2,000) $0 $2,000 $4,000 $6,000 $8,000 2014 2015 2016 2017 2018 2019 $000's January 2014 to Present 5 Year Historical Municipal Bond Fund Flow Changes Municipal Bond Funds increased by $952 Million from the prior week Municipal Bond Fund Flow Changes
- 14. 14 Money Market Fund Flow Changes Money Market Funds increased by $838 Million from the prior week. Tax Exempt Money Market Funds decreased by $1.43 Billion from the prior week. $(70,000) $(50,000) $(30,000) $(10,000) $10,000 $30,000 $50,000 2014 2015 2016 2017 2018 2019 $000's January 2014 to Present 5 Year Historical Money Market Fund Flow Changes $(10,000) $(5,000) $- $5,000 $10,000 $15,000 2014 2015 2016 2017 2018 2019 $000's January 2014 to Present 5 Year Historical Tax-Exempt Money Market Fund Flow Changes
- 15. 15 $- $5,000 $10,000 $15,000 $20,000 $25,000 Sep 2015 Mar 2016 Sep 2016 Mar 2017 Sep 2017 Mar 2018 Sep 2018 $ Millions September 2015 to Present Historical Tax-Exempt Bond Issuance Tax Exempt Bond Issuance increased $5.38 Billion from the prior week. Tax Exempt Bond Issuance
- 16. 16 George K. Baum & Company does not endorse, guaranty or approve, and assumes no responsibility for, the content, accuracy, reliability, or completeness of the information contained in the following presentation. The information in the following presentation was compiled from sources believed to be reliable for informational purposes only. Presentations are intended for educational purposes only and do not replace independent, professional judgment. You should not take, or refrain from taking action based on its content. The opinions expressed by each presenter are theirs alone and may not necessarily represent those of employers, institutions or other entity affiliated with each presenter. Any and all information contained therein is not intended to constitute legal advice and accordingly, you should consult with your own attorneys regarding the application or impact of any of the information for your specific situation, needs or use. Disclaimer