Recommended

Recommended
More Related Content
What's hot
What's hot (17)
Similar to ISSX International conference ANDRE MAZZARI poster
Similar to ISSX International conference ANDRE MAZZARI poster (20)
Recently uploaded
Recently uploaded (20)
ISSX International conference ANDRE MAZZARI poster
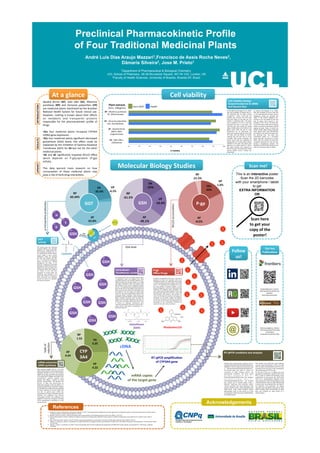
- 1. Preclinical Pharmacokinetic Profile of Four Traditional Medicinal Plants André Luís Dias Araujo Mazzari1,Francisco de Assis Rocha Neves2, Dâmaris Silveira2, Jose M. Prieto1 1. Houghton P, Fang R, Techatanawat I, Steventon G, Hylands PJ, Lee CC. The sulphorhodamine (SRB) assay and other approaches to tes9ng plant extracts and derived compounds for ac9vi9es related to reputed an9cancer ac9vity. Methods 2007;42: 377-‐387 2. RepeAo G, del Peso A, Zurita JL. Neutral red uptake assay for the es9ma9on of cell viability/cytotoxicity. Nat Protoc 2008; 3: 1125-‐1131 3. Chieli E, Santoni Rugiu E, Cervelli F, Paolicchi A, Tongiani R. Assessment of P-‐glycoprotein-‐dependent drug transport in isolated rat hepatocytes using rhodamine 123. Cell Biol Toxicol. 1993; 9: 235-‐241 4. Allen S, Shea JM, Felmet T, Gadra J, Dehn PF. A kine9c microassay for glutathione in cells plated on 96-‐well micro9ter plates. Methods Cell Sci 2000;22: 305-‐312 5. Rebbeor, J.F., Wang, W., CliXon, D., and Ballatori, N. (1998). Glutathione S-‐conjugate forma9on and metabolism in HepG2 cells: a cell model of mercapturic acid biosynthesis. J Toxicol Environ Health A 53, 651-‐663. 6. Rahman, I., Kode, A., and Biswas, S.K. (2006). "Assay for quan9ta9ve determina9on of glutathione and glutathione disulfide levels using enzyma9c recycling method," in Nat Protoc. (England), 3159-‐3165. Cell viability At a glance Acknowledgements P-‐gp Rhodamine123 GSH CYP 3A4 P-gp Efflux Drugs Intracellular Glutathione Levels mRNA extraction cDNA synthesis GGT Molecular Biology Studies References The method used in the intracellular determina9on of glutathione levels was adapted from those described by Rahman and coworkers (Rahman et al., 2006) and Allen and coworkers (Allen et al., 2000) with slight modifica9ons. AXer 24h incuba9on with BSO (10μM) or plant extracts (100μg/mL), HepG2 cells (4 × 10⁴ cells/well) were washed with PBS and 60µL of 0.1% Triton-‐X was added to each well of the plates to lyse the cells. 25µL of 5% sulfosalicylic acid was added to the cell lysates and plates were shaken for 2min. 25µL of glutathione reac9on buffer containing NADPH (2.39mM), DTNB (0.01M) and glutathione reductase (500UI) in sodium phosphate buffer (143mM) containing EDTA (6.3mM) was added to the cell lysates. Absorbance was read in a kine9c cycle in the plate reader every 30s for 5min at 405nm (11 readings). Absorbances were converted into absolute amounts by means of the i-‐ slopes method using known concentra9ons of L-‐ glutathione reduced. Rhodamine uptake/efflux assays were conducted as described by Chieli and coworkers with minor modifica9ons (Chieli et al., 1993). AXer five passages in media containing vincris9ne (50µM), Caco-‐2 VCR cells (1 × 10⁴ cells/well) were incubated for 2h with the P-‐gp inhibitor verapamil (20µM) or plant extracts (100µg/mL) in serum-‐free media containing rhodamine 123 (5µg/mL). AXer incuba9on, cells were washed with verapamil (20µM) in PBS. Cells were lysed with 100µL of 0.1% Triton X-‐100 in PBS and the plates were placed in the incubator for 15min. The fluorescence intensity of cell lysates was measured in the plate reader (Exc-‐485nm, Em-‐525nm). The cellular accumula9on of rhodamine 123 for each of the extracts was expressed as the percentage of the accumula9on measured for rhodamine 123 under control condi9ons. GGT ac9vity assay was conducted according Rebbeor and coworkers (Rebbeor et al., 1998). Briefly, aXer 24h incuba9on of HepG2 cells (1 × 10⁶ cells/well) with the GGT inhibitor acivicin (5µM) or plant extracts (100µg/mL), media was aspirated and cells were washed with PBS. 4mL of pre-‐warmed glycylglicine buffer (115mM Tris, 138mM glycylglycine) and 400µL of the substrate γ-‐Glutamyl-‐p-‐nitroanilide (29.6mg/mL of HCl 0.5mmol/L) were added to the wells and plates were incubated for 10min. Then, 500µL of the content of each well were transferred to 24-‐well plates and absorbance was measured in the plate reader (405nm). Absorbances were converted into absolute amounts by means of a calibra9on line using 4-‐nitroaniline. GGT activity Rh123 accumula9on GSH level folds of induc9on p-‐nitroaniline produc9on 1Department of Pharmaceutical & Biological Chemistry, UCL School of Pharmacy 29-39 Brunswick Square, WC1N 1AX, London, UK 2Faculty of Health Sciences, University of Brasília, Brasília-DF, Brazil Scan here to get your copy of the poster! This is an interactive poster Scan the 2D barcodes with your smartphone / tablet to get EXTRA INFORMATION OR Scan me! Follow us! Our key PublicaLons GSH G S H H2N CH C CH2 OH O SH Cysteine GSH breakdown cDNA mRNA copies of the target gene RT-‐qPCR amplificaLon of CYP3A4 gene For the SRB assay (Houghton et al., 2007), aXer 24h incuba9on of HepG2 cells (2 × 10⁴ cells/well) with the plant extracts (100µg/mL), media containing the samples was removed and cells were fixed with 100µL of cold 40% w/v TCA solu9on in deionized water. The plates were incubated at 4°C for 1h and then immersed five 9mes in tap water. The TCA-‐fixed cells were stained by adding 100µL of SRB solu9on (0.4 % SRB in 0.1% glacial ace9c acid) and leX at room temperature for 1h. AXerwards, the plates were quickly rinsed four 9mes with 1% ace9c acid and flicked to remove unbound dye and then leX to air-‐dry overnight. AXer drying completely, the protein bound SRB was solubilized by adding 100µL of Tris base buffer solu9on (10mM) to each well. The plates were agitated in an orbital shaker for 30min. The op9cal density was measured at 492nm by using a microplate plate reader Infinite M200 (Tecan Trading AG, Switzerland). Cell Viability Assays Sulphorhodamine B (SRB) and Neutral Red For Neutral Red (Repero et al., 2008), aXer 24h incuba9on of Caco-‐2 VCR cells (1 × 10⁴ cells/well) with the plant extracts (100µg/mL), media was removed and 100µL of NR solu9on (40µg/ml) pre-‐ warmed at 37°C was added to each well and all plates were placed in the incubator at 37°C for 2h. The cells were rinsed with 150µL of PBS and the washing solu9on removed by decan9ng or gently tapping the plate. 150µL of neutral red destain solu9on (96% ethanol, deionised water, glacial ace9c acid; 50%:49%:1%) was added to each well of the plate aXer the washing step. The plate was immediately shaken on a microplate shaker (IKA MS3, Germany) for at least 10min un9l the neutral red had been completely extracted from the cells and formed a homogenous solu9on. The absorbance of the neutral red extract was read out in the plate reader at 540nm. SH Glutathione (GSH) AXer exposing HepG2 cells (5 × 10⁵ cells/ well) to plant extracts or the CYP3A4 inducer Rifampicin (50mM) or the CYP 3A4 inhibitor DMSO 1% for 96h, total RNA was extracted from using TRIzol® Reagent according to the manufacturer’s protocol. Samples were treated with DNase I (1U/μL) to avoid genomic contamina9on. The quan9ty and quality of RNA was determined by differen9al readings at 260 and 280nm in a Nanodrop 2000 (Thermo Scien9fic). Integrity of total RNA from HepG2 cells was assessed by visual inspec9on of the two rRNAs 28s and 18s on agarose gels. cDNA was synthesized from 1μg of total RNA with the Moloney rine Leukemia Virus Reverse Transcriptase (M-‐MLV RT) (200U/μL) and oligo(dT) 12-‐18 primer (0.5μg/μL), according to the manufacturer’s instruc9on in a final volume of 21μL. RT-qPCR conditions and analysis CYP3A4 sense strand primer sequence was 5’-‐ CAAGGACAACATAGATCGTTACATATACACACCCTT TGGAAG-‐3’ and the an9sense strand primer was 5’-‐ AGCTCAATGCATGTACAGAATCCCCGGTTA-‐3’. The β-‐ac9n gene was used to control for varia9ons in RNA loading within the experimental condi9ons. The sense strand p r i m e r s e q u e n c e w a s 5 ’ -‐ CGTACCACTGGCATCGTGAT-‐3’and the an9sense s t r a n d p r i m e r w a s 5 ’ -‐ GTGTTGGCGTACAGGTCTTTG-‐3’. The RT-‐qPCR was carried out in 96-‐well plates using a Pikoreal™ Real-‐Time PCR detec9on system (Thermo Scien9fic). Each well contained a final reac9on volume of 10μL (5.0μL MasterMix with SYBR Green, 2.0μL cDNA template diluted appropriately, 0.5μL of each primer at a final concentra9on 0.3mM and 2.0μL of RNAse/DNAse free dis9lled water). PCR reac9on was performed under following schema: ini9al denatura9on at 95°C for 2min, then 40 cycles of denatura9on at 95°C for 15s, annealing at 55°C (β-‐ac9n) or 60°C (CYP3A4) for 30s, and extension at 72°C for 30s. At the end of the run, a mel9ng curve was generated by hea9ng the amplicon from 60 to 95◦C in order to confirm the specificity of the amplifica9on for each primer pair. All RT-‐qPCR were run in quadruplicates. Standard curves were produced to check the PCR efficiency using a five-‐fold dilu9on series of cDNA. Efficiency (E) of primer pairs was obtained from the slope of the calibra9on curve generated. The rela9ve expression was calculated on the basis of ‘delta delta Ct’ (ΔΔCt) values. Normaliza9on of target gene was achieved by using β-‐ac9n as a reference gene. RP -‐ Rhamnus purshiana DC. (Rhamnaceae) SA -‐ Salix alba L. (Salicaceae) AF -‐ Apuleia ferrea (Mart.) Baill. (Leguminosae) VP -‐ Vernonia polyanthes Less. (Compositae) 10% 20% 30% 40% 50% 60% 70% 80% 90% 100% Caco-‐2VCR HepG2 Herbal Medicines in Brazil: pharmacokine9c profile and poten9al herb-‐drug interac9ons Pharmacovigilance in Brazil: the monitoring of herb-‐drug interac9ons using pharmacokine9c data Plant extracts (Conc. 100μg/mL) GSH GSH GSH GSH GSH GSH GSH GSH GSH Substrate GGT Rh 123 Rh 123 Rh 123 Rh 123 Rh 123 Rh 123 Rh 123 Rh 123 Rh 123 Substrate Rh 123 Rh 123 Rh 123 Rh 123 Rh 123 Apuleia ferrea (AF), Salix alba (SA), Rhamnus purshiana (RP) and Vernonia polyanthes (VP) are medicinal plants shortlisted by the Brazilian Na9onal Health System for future clinical use. However, nothing is known about their effects on metabolic and transporter proteins responsible for the pharmacokine9c profile of drugs. • ALL four medicinal plants increased CYP3A4 mRNA gene expression. • ALL four medicinal plants significant decreased glutathione (GSH) levels, this effect could be explained by the inhibi9on of Gamma-‐Glutamyl Transferase (GGT) for SA but not for the other medicinal plants. • SA and AF significantly impaired Rh123 efflux which depends on P-‐glycoprotein (P-‐gp) ac9vity. This data warrant more research on how consump9on of these medicinal plants may pose a risk of herb-‐drug interac9ons. INTRODUCTION RESULTS UPSHOT % Viability