2. MORISKY, ET AL.
TABLE 1-Size of Study Groups According to Random Assign- patient had just seen, and adapting the regimen to the
ment and Exposure to the Complete Educational patient's individual schedule, cueing behaviors (e.g., medi-
Interventions in the Combination Assigned cation taking) to daily activities (e.g., toothbrushing).9 All
Number of Patients 200 patients randomly assigned to this intervention received
Number of Patients Completing the Full it.
Combinations Randomly Assigned Combination* The second intervention consisted of an instructional
session with an adult whom the patient identified as having
C1C2C3 50 50 the most frequent contact at home, usually a spouse. The
E1C2C3 50 50
ClE2C3 50 40 education in this encounter discussed how the household
ClC2E3 50 28 member could help the patient adhere to the regimen and
ElE2C3 50 24 follow-up care. ' A total of 160 of the 200 patients randomly
EjC2E3 50 15 assigned to this intervention were interviewed.
C, E2E3 50 19
13 The third intervention was a series of three, one-hour
El E2E3 50
group sessions led by a social worker which patients were
*C = Control; E1 = Exit Interview; E2 = Family Support; E3 = Small invited to attend. The purpose was to provide group support,
Groups. Each combination indicates the interventions introduced sequentially to strengthen the self-confidence of patients through discus-
in a randomized factorial procedure. For example, El E2E3 includes the
patients who were randomly assigned to the exit interview in Phase l; E2 the sions centering on hypertension management and compli-
patients with an exit interview assigned to family support in Phase Il; and E3, ance. The sessions used a broad range of action-related
the patients with both an exit interview and family support assigned to small procedures (e.g., role-playing, behavioral rehearsal, prob-
groups in Phase ll.
lem clarification, cognitive restructuring). A total of 96 of the
200 patients randomly assigned to the small group interven-
approach (E2), and a small group process (E3), was designed tion attended at least one session."
to address each of these treatment problems in sequence.
The interventions were sequentially introduced approxi- Randomization Procedures
mately six months apart beginning in January 1975 with the A randomized factorial design distributed the patients
least complicated and least expensive and ending with the into experimental and control groups at each of the three
most complicated.7,8 phases of the educational program. On alternate weeks,
patients seen in the two clinics were allocated to various
Educational Program Content intervention and control groups through simple random
The exit interview, conducted immediately following sampling procedures. Fifty per cent of those patients who
the patient's encounter with his or her medical provider, was had been experimentals in Phase I (Exit Interview) remained
an individualized 5-10 minute counseling session explaining experimentals for Phase II (Family Support) and 50 per cent
and reinforcing the instructions of the practitioner whom the became controls. This accumulated sampling procedure also
TABLE 2-Comparison of 1975 Baseline Characteristics by Study Group
Study Group
Variable C1C2C3 E1C2C3 CjE2C3 C1C2E3 EjE2C3 E1C2E3 CjE2E3 EjE2E3 Sig.
Mean age 54.1 51.6 56.2 51.4 53.2 53.7 55.7 54.1 N.S.
Per cent female 66 72 66 76 66 76 76 62 N.S.
Per cent Black 90 96 92 86 94 94 96 94 N.S.
Mean years of diagnosed
hypertension at time of
entry to study 6.5 6.2 6.7 6.1 6.6 6.5 6.7 6.3 N.S.
Per cent high risk* 62 66 60 56 62 64 62 66 N.S.
Previous stroke or
myocardial infarction 10 12 8 8 10 10 8 10 N.S.
History of angina or
congestive heart failure 10 10 10 8 10 12 12 12 N.S.
Arteriosclerotic
cardiovascular disease 10 10 10 10 8 12 10 12 N.S.
Kidney disease 2 2 - - 2 - 2 2 N.S.
Diabetes mellitus 2 4 4 2 4 2 2 2 N.S.
Previous hospitalization
for hypertension 6 6 4 4 6 6 6 8 N.S.
Black males < 50 6 4 6 6 4 6 6 2 N.S.
Combination of above risk
factors 16 18 18 16 18 16 16 18 N.S.
*High risk = previous stroke or myocardial infarction, end organ damage, previously hospitalized for hyperten-
sion, or Black male less than 50 years of age.
154 AJPH February 1983, Vol. 73, No. 2
3. FIVE-YEAR BP CONTROL AND MORTALITY
TABLE 3-Comparison of the 1975 Baseline Characteristics for the Total Cohort, Patients
Remaining in Treatment, Patients Discontinuing Medical Care, and Patients Who
Died during the Five-Year Period
Patients Patients Patients Who
Total Remaining in Discontinuing Died during the
Cohort Treatment (N Medical Care Study
Variable (N = 400) = 290) (N = 64) (N = 46)
Mean age 54.1 54.4 51.8 55.3
Per cent female 75.5 75 79 74
Per cent Black 91.6 92 91 90
Median years of schooling 8.2 8 9 8
Median 1974 household
income $4250 $4250 $4210 $4280
Mean years of diagnosed
hypertension at time
of entry to study 6.1 6.1 5.9 6.3
Per cent high risk 62 62 66 71
Previous stroke or
myocardial infarction 10 9 12 11
History of angina or
congestive heart failure 11 10 12 13
Arteriosclerotic
cardiovascular disease 10 9 10 11
Kidney disease 2 3 1 2
Diabetes mellitus 3 3 4 4
Previous hospitalization
for hypertension 6 6 5 7
Black males < 50 5 5 6 4
Combination of above
risk factors 17 17 16 19
was used for those who were controls in Phase I. Random- tions to which they were randomized (Table 1). Comparative
ization was further stratified for Phase III (Small Group) analyses of the assigned vs received intervention groups
using the same procedures as in Phase II. The eight possible indicate no significant differences with respect to any of the
educational treatment combinations and the completion of outcome variables being investigated. Patients who were
all interventions in each combination are displayed in Table randomly assigned but opted not to participate at all in the
1. third intervention had better BP control than those not
The compliance, weight control, appointment record, randomized and those who did participate but attended only
BP control, and mortality of patients randomly assigned to one of the three sessions.
various combinations of the three interventions were includ-
ed in experimental group results even when some patients Measurement
did not complete interventions assigned to them. Not all The patient's medical record was reviewed three times
patients necessarily received all components of the interven- during the course of the study. Information collected con-
TABLE 4-Blood Pressure Control Status at Time of Dropout by Study Group for Individuals
Who Discontinued Care during the Study Period by Method*
Method 1 Method 2
Study Group % in % in
Control N Rank Control N Rank
C1C2C3 36 50 8 30 50 7.5
E1C2C3 52 50 6 38 50 6
C1E2C3 68 50 4 54 50 4
C1C2E3 44 50 7 30 50 7.5
E1C2E3 46 50 5 40 50 5
C1E2E3 76 50 1.5 60 50 2
EjE2C3 74 50 3 58 50 3
E1E2E3 76 50 1.5 66 50 1
*Method 1: Assumes all dropouts continue their last BP control status as measured prior to dropout.
Method 2: Assumes all dropouts are out of control (worst-case analysis)
AJPH February 1983, Vol. 73, No. 2 155
4. MORISKY, ET AL.
TABLE 5-Deviation (in Ibs) from Ideal Weight (Obesity Index) by Study Group for Baseline, 2
Years and 5 Years
Baseline 2 Years 5 Years
Study Group Index Nt Index Nt Index Nt
C1C2C3 19.3 50 27.2 36 26.0 30
E1C2C3 25.6 50 23.6 41 10.0 35
C1 E2C3 12.2 50 14.7 35 10.2 36
C1C2E3 11.3 50 15.7 40 16.5 32
E1 E2C3 18.6 50 17.2 45 17.5 43
E1C2E3 19.8 50 9.6t 37 5.6t 36
C1 E2E3 17.0 50 23.5 35 19.5 36
E1E2E3 11.1 50 4.3tt 38 1.5tt 42
TOTAL 15.6* 400 17.0** 307 14.4*** 290
*F7=392 1.3; pp == .36
**F7299= 1.8; .09
**F7,282 =2.1; p= .04
tSignificantly different from C1C2C3 at p < .05
ttSignificantly different from C1C2C3 at p < .01
4The Ns represent the numbers of individual patients according to study group who had a recorded weight during
the final 6 months of the respective observation period.
sisted of average systolic and diastolic BP, weight, appoint- only 40 per cent of the patients met the criteria for blood
ment-keeping behavior, presence of cardiovascular-related pressure control at the start of the study.**
risk factors,* and date of any terminal event (mortality or If either the systolic or diastolic reading exceeded the
withdrawal from the study). Medical record abstractors were limit set for controlled BP, the BP was considered elevated.
not aware of the treatment status of the patients. Similar averaging was done for the two-year and five-year
Comparison of an individual's actual weight with a follow-up. Individuals measuring and abstracting the BP
standard weight for height and age is used as the criterion of were not aware of the treatment status of the patients.
leanness or fatness. 12.13 It was obtained at entry, between 18 Of the original sample, 290 patients were alive and still
and 24 months, and between 54 and 60 months. being followed in their respective clinics, while 110 patients
Appointment-keeping behavior is measured by dividing did not have a clinic appointment during the last six months
the total number of appointments kept during a given time of the five-year follow-up. Maryland State vital registrations
period by the total number of appointments scheduled. The identified 46 of these as deaths (11.5 per cent of the original
baseline appointment-keeping period is six months preced-
ing entry into the study. Two-year and three-year follow-up **The criteria were as follows: for patients under 40 years of
periods constitute the subsequent time intervals. Patients age, greater than 140/90 mm Hg was considered elevated BP; age
included in this analysis consist of those individuals who 40-59 years, greater than 150/95 mm Hg was considered elevated
were in active care during the respective time period (i.e., BP; and for those age 60 years or older, greater than 160/100 mm Hg
had visited their doctor about their high BP during the last was considered elevated BP.
six months of the time period under consideration).
Overall adherence to the prescribed drug regimen was
measured at two-years by a self-reported measure (low, TABLE 6-Appointment-Keeping Ratio by Study Group for Year
2 and Year 5
medium, and high), which is a score totaled from patient's
responses to four questions concerning their usual patterns 2 Years 5 Years
of medication taking. Prior work had indicated this measure
to be reliable (Cronbach alpha = 0.61), easily implemented, Study Group Ratio N Ratio N Change El
and to demonstrate predictive validity in regard to BP
control.8 C1C2C3 .63 40 .83 30 .20 54
Baseline BP levels were determined by averaging sys- E1C2C3 .70t 46 .81 35 .11 37
C, E2C3 .78tt 42 .92t 36 .14 64
tolic and diastolic measures found in the medical records C0C2E3 .66 44 .80 32 .14 41
over a six-month period (July-December 1974) prior to entry ElC2E3 .74tt 47 .83 43 .09 35
into the study. The median number of visits during this C, E2E3 .66 43 .95tt 36 .29 85
period was two. Using an age-adjusted measure of control E, E2C3 .75tt 44 .93tt 36 .18 72
that had been agreed on by physicians in the same clinic,'4'6 El E2E3 .68 44 .95tt 42 .27 84
TOTAL .70* 350 .86** 290 .16 53
*High-risk = history of target organ damage (heart, brain,
*F7,342 1.67; p = .11
**F7282= 7.032; p < .001
kidney) previously hospitalized for hypertension, or being a Black tSignificantly different from C1C2C3 at p < .05
male under 50 years of age. ttSignificantly different from C1C2C3 at p < .01
156 AJPH February 1983, Vol. 73, No. 2
5. FIVE-YEAR BP CONTROL AND MORTALITY
TABLE 7-Blood Pressure Control Status by Study Group for Year 2 and Year 5
Percentage with BP in Control
Baseline Year 2 Year 5
Study Status % N % N % N Elt Pt
C1C2C3 41 50 42 40 50 30 15.3 .73
E1C2C3 40 50 41 46 54 35 23.3 .61
C, E2C3 37 50 48 42 75** 36 60.3 .01
C1C2E3 34 50 52 44 46 32 18.1 .87
EjC2E3 40 50 53 47 47 43 11.6 .78
CjE2E3 41 50 54* 43 83** 36 71.2 .02
E1 E2C3 45 50 55* 44 81 ** 36 65.4 .02
E1E2E3 38 50 66** 44 79** 42 66.1 .03
All Experimental
Groups 40 350 52* 310 66* 260 43.3 .02
*Significantly different from C1C2C3 at p < .05
**Significantly different from C1C2C3 at p < .01
tEl between baseline (PI) and year 5 (P2) where El - 100 -- pI
Pb
x 100
tp-level between baseline (pre-program) and 5-year follow-up
cohort). An exhaustive follow-up through telephone inter- Results
views and state public assistance records revealed 47 of the At baseline (1974), no significant differences were ob-
remaining 64 patients to be alive in 1980. Vital status was not served between any of the study groups with respect to such
determined on 17 patients (4.2 per cent) who had discontin- factors as race, sex, mean years of diagnosed hypertension,
ued their medical care at the Hospital and could not be complications from high BP, or other related comorbidity
located through any of the above follow-up procedures. (Table 2).
There was no significant difference between these 17 individ- Based on initial two-year findings of a positive effect of
uals and the rest of the sample with respect to age, race, sex, the educational program on patient behaviors and blood
weight control, complications from high BP or other cardio- pressure control, 18 components of the family support inter-
vascular risk factors (history of target organ damage, a vention and exit interview were integrated into the routine
previous hospitalization for hypertension), or BP control care processes of the Adult Hypertension Clinic at that time,
status at baseline and at two-year follow-up. Moreover, they but not into the Internal Medical Clinic. Consequently,
were equally distributed among the intervention groups. differentials between the experimental and usual care group
Date of death and all entries in the cause of death were hypothesized to be smaller in the Adult Hypertension
section were abstracted from each of the 46 death certifi- Clinic than in the Internal Medical Clinic by the end of the
cates, and the information was given to two cardiologists five-year period.
who independently judged whether the deaths were hyper- Table 3 compares the baseline characteristics of the 290
tension-related on the basis of: epidemiological evidence patients who were still in active care with those of the
that high BP represented a significant risk factor (cerebro- original sample, as well as with the 64 patients who discon-
vascular, cardiovascular, and renal disease); high BP being tinued care and the 46 patients who died during the five-year
considered an exacerbating factor; or malignant high BP period. No significant differences were found.
being mentioned as the underlying cause of death. The The problem of differential dropout according to study
concordance between the two clinicians was 100 per cent. groups was addressed by two methods: method 1 assumes
The categorization of each cause of death is contained in that all dropouts continue their last recorded BP control
Appendix A. status as measured prior to dropout; method 2 assumes that
The issue of change in each of the dependent variables is all dropouts would be out of control (worst case analysis).
handled by direct comparison of the variable across study Both methods project the BP control rates to five years using
group at T, (time 1) and T2 (time 2). The degree of change the reconstituted study groups. Analyses indicated no
was measured both within each study group over time, as change in ranking of groups by blood pressure control status
well as by comparative analyses of experimental and control (Table 4). E1E2E3, and C,E2E3, and E1E2C3 rank first,
groups at similar points in time. An effectiveness index (El), second, and third, respectively, single interventions rank
similar to the epidemiological measure of attributable risk, intermediate, and the usual care CIC2C3 group ranks last in
assesses the degree of change adjusted according to the each method.
groups' potential change. ***17
Weight Control
***El = P2 - P,/l00 - Pi x 100, where the numerator
represents actual change between T, and T2 and the denominator Two-thirds of the patients were told to lose weight and
represents potential change at T,. referred to a nutritionist in the hospital for dietary instruc-
AJPH February 1983, Vol. 73, No. 2 157
6. MORISKY, ET AL.
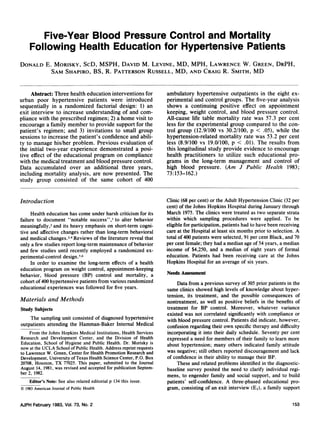
65 r AHC appointment-keeping behavior over the next three years,
with a group mean of 86 per cent. The greatest improvement
60 I in the appointment-keeping ratio was found in the study
a. groups assigned to the full combination of educational expe-
c,
v
55 _
riences and the study group assigned to the family member
a'
support and group discussion interventions.
c 50 _ The proportion of individuals reporting high compliance
0
MC (score of 4 on the 4-item scale) with their antihypertensive
3i 45 / -~~~
- - - -drug regimen at baseline was 40 per cent, with no significant
.------------- 7>differences between any of the eight study groups. At the
40 F two-year follow-up period, all intervention groups (either
Introduction of patient education procedures singly or in combination) demonstrated some improvement
35 L into routine core in the AHC over the control group. However, the combination of the
fi exit interview and the family support intervention (E,E2C3)
Baseline 2 demonstrated the strongest impact with 53 per cent reporting
Both groups recieved Years Post- experiment high compliance vs 40 per cent in the control group. The
Iusual care"
without experimental family support intervention alone (C1E2C3) also achieved
educational components approximately the same effects.17
FIGURE 1-Blood Pressure Control Status for CIC2C3 ("usual
care") Group at Baseline, Two Years, and Five Years by Clinical Site Blood Pressure Control Status
of Treatment, Adult Hypertension Clinic (AHC) and Internal Medical
Clinic (IMC) Table 7 presents blood pressure control status at base-
line, and two and five-year follow-up. The McNemar proce-
dure was used to test the significance of change between
tions. No differences in this proportion were noted between baseline ("before") and at the five-year period ("after")
study groups. Analysis of variance using a factorial design within each study group. 19 A test of proportions was used to
with equal cell frequencies at baseline also indicated no determine the level of statistical significance between each
significant differences in weight control between the eight study group and the usual care group at the five-year
study groups (F7,392 = 1.3; p = .36) (Table 5). Follow-up period.'0
analyses at two and five years indicated a reduction in the Study patients assigned to any of the experimental
obesity index for most of the groups assigned to any inter- groups displayed a statistically significant 30 per cent in-
vention, and an overall reduction of 1.5 lbs significant at p = crease in BP control at the two-year follow-up, and a
.04, but an increase in this index for the usual care (CIC2C3) statistically significant 65 per cent increase in BP control
group (19.3 lbs to 26.0 lbs). over the five-year period. Patients who initially received
standard care (CIC2C3) displayed a nonsignificant 22 per
Appointment-Keeping and Medication Compliance cent increase in BP control over the five-year period. A
No significant differences with respect to the ratio of comparison of the BP control status at year five between the
appointments kept to appointments scheduled were noted group with no interventions and the experimental group also
between any of the eight study groups at baseline. The ratio revealed a significant difference.
for all study groups increased from 54 per cent to 70 per cent As displayed in Table 7, the proportion of individual
(p < .005) at the two-year period (Table 6). The educational patients having their BP under control in the groups assigned
program continued to demonstrate a positive impact on to the family support intervention in combination with the
TABLE 8-Change in Diastolic Blood Pressure (DBP)
Control for Interventions 1 Through 3 Educational Interventions 1 Through 3
Baseline Year 5 Baseline Year 5
Diastolic
Pressure, mm Hg % N % N % N % N
<90 32 16 47 14 37 129 70 181
91-95 22 11 7 2 13 44 14 36
96-105 28 14 40 12 30 105 9 23
.106 81 9* 6 2t 20 72t 7 20§
TOTAL 100 50 100 30 100 350 100 260
*Includes one patient, representing 2.0% of the total with a DBP >120 mm Hg.
tlncludes one patient, representing 3.3% of the total with a DBP >120 mm Hg.
tlncludes nine patients, representing 2.6% of the total with a DBP >120 mm Hg.
§No patient with DBP >120 mm Hg.
158 AJPH February 1983, Vol. 73, No. 2
7. FIVE-YEAR BP CONTROL AND MORTALITY
TABLE 9-Pearson Correlation Coefficients between Outcome TABLE 10-Mortality from All Causes by Study Group during
Variables Five-Year Follow-up, Patient Hypertension Educa-
tion Project
1 2 3 4
Life Table
1. Medication Compliance Sample Death Rate
2. Appointment Keeping .14* Study Group Size Deaths per 100 (SE)*
3. Weight Control .02 .1 7**
4. Blood Pressure Control .22** .26** .04 ClC2C3 50 11 30.2 (8.3)
ElC2C3 50 4 11.9 (6.1)
*p value <0.05 and >.01 C,E2C3 50 8 16.5 (5.3)
**p value <0.01 ClC2E3 50 6 17.6 (7.1)
EIC2E3 50 2 6.6 (4.8)
ClE2E3 50 3 9.5 (5.8)
E1E2C3 50 8 22.0 (6.8)
exit interview or small group intervention or both was found ElE2E3 50 4 8.6(4.1)
to be significantly different from the usual care (C,C2C3) All Experimental
group at year two. This difference persisted at year five. This Groups 350 35 12.9 (2.2)*
combination of interventions also demonstrated strong sta-
tistically significant gains in the proportion of individuals *Standard error of cumulative proportion surviving; 95% confidence limits
for differences in Experimental Groups vs CIC2C3 = 1.53 - 32.13; p < .05.
coming under control between year two and year five. These Per cent reduction in mortality for Experimental Group vs C1C2C3 Group =
positive effects were noted both for patients in the Internal Experimental rate - Control rate/Control rate x 100.
Medical Clinic (IMC) and the Adult Hypertension Clinic
(AHC). A positive increase in the effectiveness index was
noted for each study group's BP control level over the five- the system. Only 7 per cent of the variance in BP control
year period. explained by the educational program was attributable to
The usual care group (CIC2C3) displayed an average contact alone, the remainder being attributable to content
increase in BP control of 22 per cent over the five-year and an interactive combination of contact and content.9,2'
period (42 per cent to 50 per cent). Analysis according to
clinic status, however, indicated that the entire increase in Relationship between Dependent Variables
the proportion under control in the usual care group is A review of Tables 5 through 8 indicates that patients
accounted for by patients in the AHC, as shown in Figure 1, who were assigned to the various educational interventions
and the only period during which the increase in BP control generally improved their weight-control and appointment-
in the usual care group was noted was between years two keeping behaviors and blood pressure control levels from
and five, after the positive aspects of the educational pro- baseline. Table 9 presents the relationship between the
gram had been introduced into routine procedures of the various dependent variables being analyzed in this study. As
AHC, but not the IMC. noted in this Table, there are significant positive relation-
Additional analyses were carried out examining the ships between medication taking and appointment keeping,
change in diastolic BP between baseline and at five years as well as appointment keeping and weight control. The
(Table 8) for the usual care group and the experimental strongest correlations are between BP control and medica-
groups combined. Both groups were equivalent at baseline tion compliance and BP control and appointment keeping.
with 32 per cent and 37 per cent of the usual care and Continuity of care, as measured by appointment keeping is
experimental groups, respectively, having diastolic BP less positively related to medication compliance, weight control,
than or equal to 90 mm Hg. Preintervention and five-year and BP control. Thus, individuals who improved on one
follow-up comparisons demonstrated little change in the dependent variable tended to improve on others, in particu-
usual care group, with slight increases in the proportion in lar, those who achieved BP control.
the 90 mm Hg or less group (15 percentage points), but
similar increases in the 96-105 mm Hg group (12 percentage General and Hypertension-Related Mortality
points). The combined experimental groups, however, dem- The computation of the survival function is based on the
onstrated strong improvements of diastolic BP, with propor- actuarial method described by Berkson and Gage.23 The
tional shifting from higher to lower categories. While 50 per cumulative survival rate for the entire cohort at the end of
cent of patients in the experimental group had moderate or the five-year period was 88.7 ± 2.2. Numbers of deaths and
severe diastolic hypertension (96 mm Hg or greater) before five-year life table death rates for the "usual care" and
intervention, only 16 per cent had such hypertension at five experimental groups are given in Table 10. The five-year all
years. In contrast, the usual care group had slightly smaller cause mortality rate for the usual care group was 30.2 ± 8.3
percentages in these categories before intervention (46 per compared to 12.9 ± 2.2 for the combined experimental
cent) but exhibited little change at five years. groups, which represents a 57.3 per cent reduction in mortal-
Other analyses of the two-year data have demonstrated ity (p < .05) when various combinations of health education
that the positive effect on BP control was not a function of interventions are added to usual care for hypertensive pa-
the number of patient contacts, but rather the content of the tients of the kind in this study. Furthermore, each study
interaction, and that the contact provided by the medical group demonstrated a reduction in mortality compared to the
care system needed to be supplemented by support outside usual care group.
AJPH February 1983, Vol. 73, No. 2 159
8. MORISKY, ET AL.
TABLE 11-Five-Year All Cause Annual Life Tables for Usual Care and Experimental Groups
jai r,nn
tlqs vziuai %.001 V ,-Alititillivilt*' U I-'
"
Fynarimant:ql t-.rte-iin
P-Level-Usual
Care vs
Lost to Cumulative Lost to Cumulative Experimental
Year Number Deaths Follow-up Mortality Number Deaths Follow-up Mortality Group*
1 50 3 1 .07 350 13 6 .04 .79
2 46 3 0 .14 331 7 4 .06 .17
3 43 3 1 .21 320 6 3 .08 .03
4 39 0 0 .21 311 4 2 .10 .05
5 39 2 0 .30 304 5 0 .13 .02
*Mantel N, Haenszel W: Statistical Aspects of the Analysis of Data from Retrospective Studies of Disease. J Natl
Cancer Inst. 1959; 22:719-748.
Table 11 presents annual cumulative life table mortality HDFP); a larger proportion Black (91 per cent vs 44 per
rates for the usual care and the experimental groups and cent); and a higher distribution of BP complications (59 per
indicates that the rate is lower in the experimental group in cent vs 32 per cent). All-cause mortality was directly related
each year of the study, with statistically significant lower to age in'the HDFP, rising from 3.3 (age 30-49) to 12.7 (60-
rates for years 3-5 compared to the rates for the usual care 69 years) in the stepped care (SC) and 3.5 to 15.2 respective-
group. ly in the referred care (RC). While the overall reduction in
The five-year life table hypertension-related survival mortality between SC and RC was 17 per cent, it was only
rate for the entire study population was 89.7 ± 1.9. Hyper- 5.7 per cent in the 30-49 age group; in the 50-59 year group,
tension-related deaths comprised 67 per cent of all deaths. reduction was 25.3 per cent. Likewise, both Black males and
As demonstrated in Table 12, the hypertension-related mor- females displayed higher death rates than White males. The
tality rate varied significantly between the experimental and Hopkins sample had almost threefold the proportion of
usual care groups with the proportion of hypertension- Black females, the group experiencing the largest reduction
related deaths being 2.4 times greater in the latter group. The in comparative mortality, as well as an older population. The
life table analysis indicated a 53 per cent reduction in variance that may have existed by community in the 14-
hypertension-related mortality between experimental and community HDFP study was not reported. Unlike the HDFP
usual care groups. As was the case with all-cause mortality, interventions, the specific interventions in the Hopkins
each individual study group demonstrated a reduction in study were based on behavioral theory and an educational
mortality compared to the usual care group. diagnosis of the needs of this population. They were de-
signed to be reinforcing over time in the patient's usual
medical and home circumstances. All interventions were
Discussion linked to daily life circumstances and sources of support.
Each intervention was specific to a particular problem
These results compare favorably with other program-
matic efforts and, in particular, with the Hypertension
Detection and Follow-Up Program (HDFP).23 All cause
mortality rates were 57.3 per cent lower in the experimental TABLE 12-Hypertension-Related Mortality by Study Group
group than in the control group, as compared to a 17 per cent during Five-Year Follow-up, Patient Hypertension
difference between the 6.4 and 7.7 mortality rates in the Education Project
HDFP stepped care (SC) and referred care (RC) groups, Life Table
respectively. Provisional data from the HDFP on cause- Sample Death Rate
specific mortality indicated the number of deaths from Study Group Size Deaths Per 100 (SE)*
cerebrovascular disease was smaller by approximately 45
per cent for the SC group as compared to the RC group; for C1C2C3 50 8 19.0 (6.1)
E1C2C3 50 3 9.7 (5-9)
coronary heart disease, it was 15 per cent; and for those from C1E2C3 50 5 10.6 (4.5)
hypertension, about 36 per cent.24 Comparative data in the C1C2E3 50 3 7.7 (4.3)
Hopkins study indicate the number of deaths from cerebro- E1C2E3 50 2 6.6 (4.8)
vascular disease was smaller by approximately 80 per cent C1E2E3 50 3 9.5 (5.8)
for the experimental group, for ischemic heart disease it was E1E2C3 50 4 11.9 (6.1)
E1E2E3 50 3 6.6 (3.7)
50 per cent, and for those from hypertension it was also 50 All Experimental
per cent. Groups 350 23 8.9 (1.9)*
In interpreting these comparisons, it is important to note
that the patients sampled at Hopkins were at higher risk for *Standard error of cumulative proportion surviving; 95% confidence limits
for differences in Experimental Groups vs C1C2C3 = 6.1 - 18.8; p < .01. Per
complications of high BP than the HDFP sample. The cent reduction in mortality for Experimental Group vs C1C2C3 Group =
Hopkins sample was older (median age 56 vs 51 in the Experimental rate - Control rate/Control rate x 100.
160 AJPH February 1983, Vol. 73, No. 2
9. FIVE-YEAR BP CONTROL AND MORTALITY
identified during the baseline educational diagnosis. Such an 2. Hosay PM: The unfulfilled promise of health education. NY
approach minimizes decay of behavioral changes. It has Univ Educ Q 1977; 2:16-22.
been raised that, because the program was designed as a 3. Glanz K, Kirsch J, Rosenstock I: Linking research and practice
in patient education for hypertension. Med Care 1981; 18:141-
group experiment, the interventions were not individually 152.
tailored (e.g., family support was not necessarily offered to 4. Haggerty RJ: Changing lifestyles to improve health. Prev Med
all experimental groups to whom it may have been impor- 1977; 6:276-289.
tant). This is true, but the experimental design was devel- 5. Green LW: Determining the impact and effectiveness of health
oped to test the separate and combined effects of the education as it relates to federal policy. Health Educ Monogr
1978; 6:28-66.
interventions on a randomized group of patients. Given the 6. Haynes RB, Taylor DW, Snow JC, et al: Annotated and
significant findings of the educational program, without indexed bibliography on compliance with therapeutic and pre-
tailoring, would therefore represent a minimal level of effec- ventive regimens. In: Haynes RB, Taylor DW, Sackett DL
tiveness. The positive effects of dietary, appointment keep- (eds): Compliance in Health Care. Baltimore: Johns Hopkins
Press, 1979, 337-423.
ing and drug compliance behaviors, as well as BP control 7. Green LW, Levine DM, Deeds SG: Clinical trials of health
appear to have occurred for a five-year period. Other studies education for hypertensive outpatients: design and baseline
have noted that such socially supportive and self-reinforcing data. Prev Med 1975; 4:417-425.
interventions may have a broader effect in simultaneously 8. Morisky DE, Levine DM, Green LW, Smith CR: Health
inducing other cardiovascular risk behaviors, e.g., exercise, education program effects on the management of hypertension
in the elderly. Arch Intern Med 1982; 142:1835-1838.
smoking cessation, and stress reduction.25.26 These relation- 9. Chwalow AJ, Green LW, Levine DM, et al: Effects of the
ships, however, cannot be examined within the context of multiplicity of interventions on the compliance of hypertensive
this study. patients with medical regimens in an inner-city population. Prev
Analysis of the individual experimental groups suggests Med 1978; 7:51.
10. Fass MF: The role of health education in hypertension control.
that BP control was more likely to result by using a combina- Fam Community Health 1981; 4:73-84.
tion of interventions, but the type of intervention was also 11. Bowler MH, Morisky DE, Deeds SG: Needs assessment strate-
found to differentiate outcome levels. Such control was not gies in working with compliance issues and blood pressure
related to the frequency of provider-patient interaction, but control. Patient Couns Health Educ 1980; 1:22-27.
was strengthened most notably by the involvement of family 12. Society of Actuaries: Build and Blood Pressure Study. Chicago:
the Society, 1959.
members in the patient's care. All intervention groups 13. Weight by Height and Age of Adults 18-74 Years. Washington,
demonstrated an improvement in survivorship compared to DC: US Department of Health, Education, and Welfare,
the control group. DHEW Pub. No. (PHS) 14, 1977.
Neither the effect on BP control or mortality reduction 14. Brooks RB, Appel F: Quality of care assessment: Choosing a
method for peer review. N Engl J Med 1973; 258:1323-1329.
was related to differences in baseline characteristics between 15. Fletcher SW, Appel FA, Bourgeois MA: Management of hyper-
experimental and control groups. Notably, however, there tension: effects of improving patient compliance for follow-up
was a differential effect on BP control within the noninter- care. JAMA 1975; 233:242-244.
vention group between the control patients treated in the 16. Inui TS, Yountee EI, Williamson JW: Improved outcomes in
Adult Hypertension Clinic (AHC) compared to those treated hypertension after physician tutorial. Ann Intern Med 1976;
84:646-651.
in the Internal Medicine Clinic, but only after introduction of 17. Hovland CI, Lumsdaine A, Sheffield FD: Experiments on Mass
components of the educational program (i.e., the exit inter- Communication. New York: John Wiley and Sons, 1949.
view and family support) into the ongoing care of AHC 18. Levine DM, Green LW, Deeds SG, et al: Health education for
patients in years 3, 4 and 5. hypertensive patients. JAMA 1979; 241:1700-1703.
19. Siegel S: Nonparametric Statistics for the Behavioral Sciences.
Subsequent experiences with the providers of care in New York: McGraw-Hill, 1956.
the Adult Hypertension Clinic of the Johns Hopkins Hospi- 20. Kim JO, Kohout FJ: Analysis of variance and covariance. In:
tal and health care providers in a variety of practice settings Statistical Package for the Social Sciences. New York:
in a larger statewide high BP control program2829 have McGraw-Hill, 1970.
indicated the relative ease of implementing components of 21. Chwalow AJ: Effects of the multiplicity of contacts on compli-
ance with medical regimens for hypertensive outpatients in an
the program evaluated here. It is not this specific program inner city clinic population. Doctoral dissertation, Johns Hop-
that should be recommended for a variety of different kins University School of Hygiene and Public Health, Balti-
populations in various care settings. Rather, it is the diagnos- more, 1978.
tic approach to planning and adapting the individual compo- 22. Berkson J, Gage R: Calculation of survival rates for cancer.
Proceedings of the Mayo Clinic 1950; 25:270-292.
nents of such a program to predispose, enable, and reinforce 23. Hypertension Detection and Follow-up Program Cooperative
behavior conducive to health that has generalizability to a Group: Five-Year Findings of the Hypertension Detection and
variety of populations in different organizations of care. Follow-up Program. I. Reduction in Mortality of Persons with
Moreover, the principles of developing highly targeted rein- High Blood Pressure, Including Mild Hypertension. JAMA
forcing interventions, based on an educational diagnosis and 1979; 242:2562-2571.
24. Hypertension Detection and Follow-up Program Cooperative
assessment of needs, directed at influencing specific health Group: Five-Year Findings of the Hypertension Detection and
behaviors, should have similar applicability in other aspects Follow-up Program. III. Reduction in Stroke Incidence among
of medical care, public health, and health promotion. Persons with High Blood Pressure. JAMA 1982; 247:633-638.
25. Bertera RL: The effects of blood pressure self-monitoring in the
REFERENCES workplace using automated blood pressure measurement. Doc-
1. Cohen Cl, Cohen E: Health education: Panacea, pernicious or toral dissertation, Johns Hopkins University School of Hygiene
pointless? N Engl J Med 1978; 299:718-720. and Public Health, Baltimore, 1981.
AJPH February 1983, Vol. 73, No. 2 161
10. MORISKY, ET AL.
26. Alderman M, Green LW, Flynn BS: Hypertension control ACKNOWLEDGMENTS
programs in occupational settings. Public Health Rep 1980;
95:158-163. The contributions of Drs. Allyn W. Kimball Jr., and Donald M.
27. Levine DM, Green LW, Russell RP, et al: Compliance in Steinwachs and Lee R. Bone to the completion of this study are
hypertension management: what the physician can do. Prac gratefully acknowledged. This paper was prepared for presentation
Cardiology 1979; 5:151-160. at the American Public Health Association's 1981 Annual Meeting,
28. Levine DM, Morisky DE, Bone LR, et al: Data-based planning Los Angeles, CA, November 4, 1981, Epidemiology Section. This
for educational interventions through hypertension control pro- research was supported by Grants NHLBI l-R25-HL 17016-03,
grams for urban and rural populations in Maryland. Public NHLBI l-T32-HL 0710-02 NCHSRD 5-PD 50-HS11964-02, and
Health Rep 1982; 7:171-182. NHLBI 1-HV-72986.
Appendix A
Hypertension-Related and Non-Hypertension
Related Causes of Mortality*
by Major Subclassifications
Hypertension-Related Non-Hypertension Related
A. Cerebrovascular 1. Cirrhosis
1. Atherothrombic 2. Malignant Neoplasm-
Brain Infarction lleocaecum
2. Cerebrovascular 3. Malignant Neoplasm-
accident (CVA) Stomach
3. Pontine 4. Malignant Carcinoma-
Hemorrhage Esophagus
4. CVA-Left Internal 5. Dementia, Chronic Brain
Capsule Syndrome
5. Atheroma of 6. Laennec's Cirrhosis
Cerebral Artery
6. Cerebral Anoxia 7. Budd-Chiari Syndrome
7. ASCVD 8. Pancreatitis
B. Ischemic Heart Disease 9. Metastatic Small Cell
Tumor
8-13. MI-Total of 6 10. Body Burns
14-17. ASCVD-Total 11. Unstable Gastric
of 4 Carcinoma
18. Cardiac Disease 12. Chronic Brain Syndrome
19. HCVD 13. Metastatic Carcinoma of
the Abdomen
20. Coronary 14. Metastatic Carcinoma of
Atheroma the Pancreas
21. Hypertensive 15. Chronic Aggressive
Cardiovascular Hepatitis with Cirrhosis
Disease
22-23. Severe Cardiac
Disease-Total
of 2
24. Transmural
Myocardial
Infarction
25. Cardiopulmonary
Arrest
C. Renal
26-28. Kidney Failure-
Total of 3
29. Atherosclerotic
Nephritis
D. Malignant Hypertension
30-31. Malignant
Hypertension-
Total of 2
*In those death certificates which listed cardiopulmonary or cardiorespira-
tory arrest as the leading cause of death, the underlying pathophysiological
basis of death was elaborated.
162 AJPH February 1983, Vol. 73, No. 2