By Ann K. Shelton, RN, PhD, Bradley D. Freeman, MD, Anne F. Fi.docx
Evaluation of the Inpatient Hospital Experience while on Precautions
1. Cannon
1
Evaluation of the Inpatient Hospital Experience while on Precautions
Abstract:
The objective of this study was to assess the satisfaction and overall experience of hospitalized
patients who are managed using contact or airborne isolation precautions (precautions) compared
to patients not on precautions. Increased understanding of differences in patient satisfaction will
provide hospitals with a basis for process improvements. Recent Center for Medicare and
Medicaid Services (CMS) policy changes whereby hospital reimbursement is directly correlated
with patient satisfaction, add impetus to such initiatives. This study demonstrated small
variations in perceived positive experiences and related satisfaction of patients on precautions
when compared to patients on no precautions. Specifically, variations were apparent in areas
related to nurse communication, timely help from hospital staff, pain control and overall patient
satisfaction. No statistically significant difference in patient satisfaction was noted between the
groups, related to doctor communication; however patients on precautions expressed higher
satisfaction with treatment explanations than those not on precautions.
Background:
A major issue in delivery of health care today relates to the overall patient experience during the
inpatient hospital stay. Recently, several studies have been conducted to determine the adverse
effects that patients experience when under contact precautions or in isolation due to their
diagnoses. In the Stelfox, Bates, and Redelmeier (2003) study entitled “Safety of Patients
Isolated for Infection Control,” the treatment of patients in isolation versus contact precautions
was reviewed. Study results revealed that isolated patients were more likely to experience
adverse behaviors from clinical care practices including but not limited to lack of physician
attention and failure to record detailed patient medical status, and more formal displeasure of the
patient with the care provider. Similarly, “Adverse outcome associated with contact precautions:
A review of the literature,” by Morgan, Diekema, Sepkowitz, and Perencevich (2009), examines
specifically those patients on contact precautions. The researchers found that there is less patient-
health care worker contact, delays in recovery process and diminished quality of care outcomes
by the patient, including increased likelihood of depression and anxiety, and decreased overall
patient satisfaction with their care in relation to patients not on contact precaution. In addition, in
the Abad, Fearday, and Safdar (2010) study “Adverse effects of isolation in hospitalized patients:
a systemic review,” monitored the experiences of patients placed in isolation due to disease
2. Cannon
2
transmission concerns. In the study, the researchers found that patients were uninformed of their
healthcare, their safety and recovery were at risk, and physicians spent less time in contact with
patients. The three articles support that patient satisfaction during episodes of isolation and
contact precautions may be comprised.
Due to the recent federal health care reform legislation, many changes in the delivery and
payment of hospital care have been enacted. As a result of the Patient Protection and Affordable
Care Act (PPACA, 2010), value based purchasing incentives will be required by hospitals
starting FY 2013. Hospital performance will be evaluated based on a process of care measures
and experience of care dimensions. Thirty percent of the hospital incentive payment will be
made based on experience of care domain found through the Hospital Consumer Assessment of
Healthcare Providers and Systems (HCAHPS) fact sheet and survey from the Center for
Medicare and Medicaid Services. Each patient will be asked questions about their recent
treatment at the hospital; eight measures are specifically geared toward the patient’s experience
with care providers and the hospital environment. The higher the score for the hospital, the
greater the incentive payment the hospital receives. Therefore, it is to the hospitals advantage to
provide the patients with exceptional care and a positive patient experience.
Method:
A cross-sectional, convenience survey was performed in the general medicine wards at Yale-
New Haven Hospital. It is a 966-bed private, nonprofit teaching hospital. Yale-New Haven is
the largest acute care provider in southern Connecticut and one of the Northeast's major referral
centers. Yale-New Haven Hospital discharges more than 50,000 patients each year. At this
hospital, the contact precautions protocol requires that persons entering an isolation room wear
fit-tested N95 respirator, gloves and gowns. Airborne isolation precautions require patients to be
placed in negative pressure rooms and those entering the room to wear gloves, gowns and masks.
For the purpose of this study either type of situation was classified as a patient being on
“precautions”.
Patients in airborne isolation were eligible for inclusion in the study if they had been isolated for
at least two consecutive days. Non-isolated (no precautions) patients were eligible if they had not
been isolated during the hospitalization and had a stay of at least two days.
In the event that the participants initially chosen were unable to participate, due to being
3. Cannon
3
unavailable, unable, or asleep, the investigator moved on to the next target participant. Patients
on precautions selected for study inclusion were located in close proximity (e.g. same floor or
wing) to establish a consistency among the participants. If patients refused to participate the next
room was approached. The interviewer and interviewee took all necessary personal protective
precautions throughout recruitment, enrollment and interview activity portions of this study.
A literature review of similar studies was conducted and a draft survey instrument consisting of
hybrid versions of previous instruments was created, reviewed by the authors and finalized. The
interview tool and study methodology was reviewed by the human investigations committee and
was determined to be exempt from review.
Interview questions were generally yes/no or likert scale in nature. Open-ended comments
regarding responses were also collected. During the study period, the investigator obtained a
daily list of current inpatients being treated under contact, droplet, or air-borne isolation. From
the list patients were selected based on age, gender, type of isolation precautions, type of unit in
hospital, and length of stay.
Before the survey was administered patients were briefed on the purpose of the study and
permission to proceed with the survey questionnaire was requested. A paper-based copy of the
questions was brought into each patient interview. The paper-based copy was filled out during
the interview by the interviewer. Following each interview the interviewer entered the data into a
web database for analysis. The recruitment, enrollment and interviews were generally completed
in 15 minutes or less.
Patients were interviewed during their hospitalization to maximize participation, minimize recall
bias, and minimize collection of non-relevant data. The survey questions were designed to obtain
demographic data such as ethnicity, age, diagnosis, and length of stay and to explore patient
satisfaction with caregiver communication/explanations, timely assistance from hospital staff,
pain control and overall hospital experience.
Results:
Eighty-seven patients were interviewed between August 1 and August 19, 2011. All 87 patients
were under medical care. Out of the 87 patients, 59 were cared for under contact precautions and
28 were cared for under no precautions. Two patients on isolation precautions and one in non-
4. Cannon
4
isolation (no precautions) declined participation in the study. Table 1 illustrates that a total of 59
patients were on some type of precaution protocol (67.82%). Most of the patients were on
contact precautions (61%). Differences in baseline demographics between those patients with
and without precaution protocols applied are shown in Table 1.
Table 1:
Population Demographics
n=87
No
Precautions
(32.18%)
Precautions
(67.82%)
Age
10
to
19
1
(1.15%)
0
20
to
39
6
(6.90%)
7
(8.05%)
40
to
49
8
(9.20%)
10
(11.49%)
50
to
59
5
(5.75%)
14
(16.09%)
60
to
69
2
(2.30%)
11
(12.64%)
70
to
79
5
(5.75%)
10
(11.49%)
80
to
89
1
(1.15%)
7
(8.05%)
Gender
Female
13
(14.94%)
31
(35.63%)
Male
15
(17.24%)
28
(32.18%)
Race
Black
5
(5.75%)
15
(17.24%)
White
20
(22.99%)
39
(44.83%)
Other
3
(3.45%)
5
(5.75%)
All patients were asked a series of questions on a four-point Likert scale reflecting their
satisfaction with elements of patient care including caregiver communication (nurse and doctor),
explaination of treatments (medications and procedures), timely help from hospital staff, pain
control, cleanliness and overall assessment of the hospital experience. The patient survey
questions and interview schedule are given in Appendix 1.
Tables 2 – 7 show the average scores for responses to indicated questions on a 4-point Likert
scale, where 1= never, 2= sometimes, 3= usually and 4= always.
5. Cannon
5
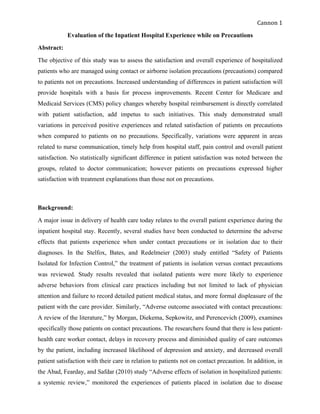
Graph 1: Patient Assessment of Effective Nurse Communication
Patients on precautions reported that nurses were not as intersted in their care and recovery, in
comparison to the patients not on precautions. Also, when questioned about nurses explanations,
being interrupted, and speaking too fast, precautions patients experienced these disastifactory
communications more frequently than those patients not on precautions. The greatest statistical
signficiance was found in the speaking too fast category with a p values of less than 0.0001.
Following this, was the frequency of nurse interruption with a p value of 0.0006.
6. Cannon
6
Graph 2: Patient Assessment of Effective Doctor Communication
Both patients on precaution and patients on no-precaution felt that the doctors always seemed
intersted in their care and recovery. However, patients on precautions reported higher instances
of confusing doctors’ explanations, being interrupted by doctors, and doctors speaking too fast
than did patients not on precuations. The categories with the greatest statistical significancy were
the difficulty of doctors explanations and doctor’s speaking too quickly both with p values of
less than 0.001 Doctors interrupting patients followed this with a p value of 0.002.
7. Cannon
7
Graph 3: Patient Assesment of Health Care Providers Treatment Explanations
Precaution and non-precaution patients were almost equally knowledgeable of the treatment
being received. Patients not on precautions reported that they less frequently received
descriptions of treatments in ways they could fully understand but there appeared to be limited
variation in the experience of explainations regarding the intent of new treatments for either
group.
8. Cannon
8
Graph 4: Patient Assessment of Timeliness of Help from Hospital Staff
Overall, both precautions and non-precaution patients reported timeliness of the hosptial staff in
regards to the prompness of call button and bathroom response. However, patients on
precautions did express a marginally less perceived adequate response to call buttons as
compared to patients not on precautions.
9. Cannon
9
Graph 5: Patient Assessmnet of Effectivness of Pain Control
While in general all patients reported that pain was usually or always controlled, those patients
on precautions expressed a slightly lower level pain control than those patients not on
precautions.
10. Cannon
10
Table 2: Patient Overall Rating of Hospital
Where 0 is the worst hospital possible and 4 is the best hospital possible, what number would you
use to rate this hospital?
Answer
Options
1 Worst
hospital
ever
2 3 4 Best
hospital
ever
Rating
Average
Response
Count
Precautions 0 1 39 19 3.31 59
No Precautions 0 0 11 17 3.61 28
On a scale of 1 (worst possible) to 4 (best possible), those patients on precautions rated the
hospital an average of 3.31, those not on precautions rated it an average of 3.61. The p value of
this chart is 0.01.
Table 3: Patient Assessment of Possible Improvements
Are there ways your hospital experience can be improved? Please rank the following as less
important to more important with 4 being most important and1 least important
Answer Options Precautions No
Precautions
More frequent visits by the doctor to check on you? 3.34 3.04
The doctor demonstrating interest in your care and recovery? 3.80 3.57
The doctor taking more time with you during your visit? 3.19 3.25
Having a clearer understanding of your illness and treatment? 3.19 3.29
More frequent visits by the nurse? 2.83 3.00
The nurse demonstrating interest in your care and recovery? 3.66 3.50
A greater sense that the nurse cares about you? 3.41 3.18
The nurse spending more time with you during visits? 2.83 2.93
The doctor asking if you understand your treatment and
medications?
3.22 3.04
The nurse asking if you understand your treatment and
medications?
3.08 3.07
The nurse asking if there is anything that she can help you with? 3.29 2.96
Having better quality food? 2.61 2.79
Comfortable room temperature? 2.95 3.18
Having a nicer room, lights, quieter, TV selection, etc.? 2.41 2.71
All patients ranked caregiver (nurse and doctor) demonstration of interest in their recovery as the
way their hospital experience could be most improved. Overall the patient care elements (nurse,
doctor, frequency and length of doctor visits) rated highest on the patients on precautions desired
elements for improved hospital experience. One exception was that patients on precautions did
not rate highly “nurses spending more time with you during visits”. Room temperature, food and
room quality were not issues noted as high ranking by patients on precautions. However, patients
11. Cannon
11
not on precautions rated comfortable room temperature and more frequent nurse visits higher
than patients not on precautions.
12. Cannon
12
Discussion:
Using a patient satisfaction survey, no significant difference in experience was found between
patients with or without precautions in response to questions regarding inpatient care. When
queried on all areas of patient care, patients on precaution and those on no-precaution reported
similar levels of patient satisfaction. Although patients on precautions expressed less satisfaction
in all areas, the difference is fairly minimal. Some have suggested that because nurses and
doctors have to take the time to put on protective wear when entering a precaution patient’s
room, they may visit the room less frequently (Abad et al. 2010). This may give patients an
impression that health care providers are less concerned with their well-being. Similarly, the
presence of personal protective equipment may cause the patient to feel more separated from
contact. Additionally, increased hospital acquired complications, most of which are preventable,
result from reduced contact with health care workers (DICON 2011). The period of stay could
also be a factor in the slightly lower ratings among the precaution patients. In general, precaution
patients stay longer in the hospital than non-precaution patients and are often readmitted at a
later time (Stelfox et al. 2003). Prolonged sickness could lower the satisfaction level of patients
and influence their questionnaire responses. Severity of illness may also negatively impact the
answers given and have resulted in lower averages among the precaution patients in contrast to
non-precaution patients. Conversely, because more efforts are required to visit a precaution
patient’s room, health care providers might have spent more time with such patients because
visits occurred less frequently. This may have been the reason that the ratings were generally
high and similar to the non-precaution patients’ averages.
One limitation of the study is due to patients who did not or were not able to participate. Their
answers could have influenced the study outcomes due to divergent experiences; responses from
these patients to the survey questionnaire could have differed significantly from those provided
by patients who participated. In addition, the use of a convenience sample versus a random or
assigned sample may have affected the study outcome. Because an unequal amount of precaution
and non-precaution patients were selected for participation in the study, the sample results may
have been impacted. Efforts were made to include all eligible patients, but the extent to which
the difference in availability of patients for interview may have affected the selected sample is
unknown. Also, due to the variability in the length of stay of patients in the hospital the average
amount of days in the hospital calculated is misleading. A majority of patients (95.4%) of
patients stayed in the hospital less than 30 days; however, three patients were hospitalized
13. Cannon
13
between100-116 days. The inclusion of these three patients in the study was to determine if the
length of stay impacted patient satisfaction levels, which was determined to be true. Finally, the
findings of this study may not be applicable to other setting with different patient populations
and/or processes in place for care delivery.
Boulding, Glickman, Manary, Schulman, and Staelin (2011) state, “patient- level measure not
only are more predicative and offer insights into a different dimension of hospital activities than
those obtained from clinical performance measure alone, but they also seem to be clinically
important in terms of providing a way to increase the quality of care (p.47). Based on the
findings of this study, a number of recommended actions to improve patient care can be
considered. In many hospitals, interventions are required for health care workers to optimize the
environment of care. One improvement that should be considered is increased staff education to
recognize specific patient behaviors and act in a way to accommodate the patient’s needs.
According to Gasink, Singer, Fishman, Holmes, Weiner, Bilker, and Lautenbach (2008), less
contact and attention received from healthcare workers by precautions versus non precautions
results in shortcoming in process of care as well as an effect on mood, psyche, and satisfaction.
When health care personnel are made aware of the complications and difficulties experienced by
patients on contact precautions or in isolation, understanding the potential difficulties
experienced by the patient may increase their sensitivity and potentially modify their activities.
Improved communications between health care providers and patients may result in higher levels
of trust and improved quality outcomes. Furthermore, greater social contact may lessen the
likelihood of depression, anxiety, and loneliness in patients (Morgan et al. 2009). These
recommended interventions could improve the patient experience while also increasing the
overall process of care and experience of care scores. This would likely result in higher incentive
payments and overall higher quality of patient care outcomes. Further study is required to
determine which approaches will most efficiently and effectively impact patients on precautions
satisfaction with their hospital experience.
References:
Abad, C., Fearday, A., & Safdar, N. (2010). Adverse effects of isolation in hospitalized patients:
A systemic review. Journal of Hospital Infection 76, 97 – 102.
14. Cannon
14
Boulding, W., Glickman, S.W., Manary, M.P., Schulman, K.A., & Staelin, R. (2011, January).
Relationship between patient satisfaction with inpatient care and hospital readmission
within 30 days. The American Journal of Managed Care 17(1), 41 – 48.
Duke Infection Control Outreach Network (DICON). (2011, April). Side effects of contact
precautions: Yellow means danger, delays, and depression for patients. Infection
Prevention News 6(4).
Gammon, J. (1998, June). Analysis of stressful effects of hospitalization and source isolation on
coping and psychological constructs. International Journal of Nurse Practitioner 4(2),
84-96.
Gasink, L.B., Singer, K., Fishman, N.O., Holmes, W.C., Weiner, M.G., Bilker, W.B., &
Lautenbach, E. (2008, March). Contact isolation for infection control in hospitalized
patients: Is patient satisfaction affected? Infection Control and Hospital Epidemiology
29(3), 275-278. Retrieved January 6, 2011 from
<http://www.jstor.org/stable/10.1086/527508>.
Khan, F.A., Khakoo, R.A., Hobbs, G.R. (2006, September). Impact of contact isolation on health
care workers at a tertiary care center. American Journal of Infection Control 34(7), 408-
413.
Knowles, H.E. (1993, July 28- August 3). The experience of infectious patients in isolation.
Nursing Times 89(30), 53-56.
Kirkland, K.B., Weinstein, J.M. (1999, October 2). Adverse effects of contact isolation. Lancet
345(9185), 1177-1178.
Lewis, A.M., Gammon, J., Hosein, I. (1999, September). The pros and cons of isolation and
containment. Journal of Hospital Infection 43(1), 19 – 23.
15. Cannon
15
MacKellaig, J.M. (1987). A study of the psychological effects of intensive care with particular
emphasis on patient’s isolation. Intensive Care Nursing 2(4), 176 – 185.
Morgan, D. J., Diekema, D.J., Sepkowitz, K., & Perencevich, E.N. (2009). Adverse outcomes
associated with contact precautions: A review of the literature. American Journal of
Infection Control 37(2), 85 – 93.
Saint, S., Higgins, L.A., Nallamothu, B.K., & Chenoweth, C. (2003, October). Do physicians
examine patients in contact isolation less frequently? A brief report. American Journal of
Infection Control 31(6), 354-356.
Siegel, J.D., Rhinehart, E., Jackson, M., Chiarello, L. (2007, December). 2007 Guidelines for
isolation precautions: Preventing transmission of infectious agents in health care settings.
American Journal of Infection Control 35(10 Suppl 2), S65-164.
Stelfox, H. T., Bates, D.W., & Redelmeier, D.A. (2003, October 3). Safety of patients isolated
for infection control. The Journal of the American Medical Association (JAMA) 29(3),
1899-1905. Retrieved March 6, 2011 from <http://jama.ama-
assn.org/content/290/14/1899.abstract>.
Tarzi, S., Kennedy, P., Stone, S., Evans, M. (2001, December). Methicillin-resistant
Staphylococcus aureus: psychological impact of hospitalization and isolation in an older
adult population. Journal of Hospital Infections 49(4), 250-254.
Ward, D. (2000, February 10-23). Infection control: Reducing the psychological effects of
isolation. British Journal of Nursing 9(3), 162-170.