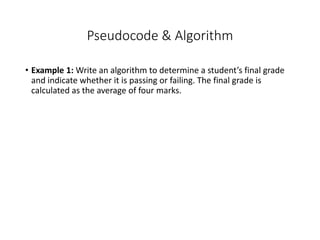
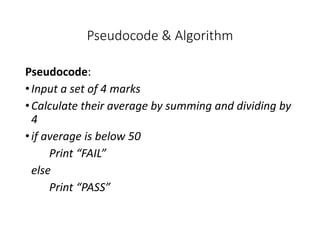
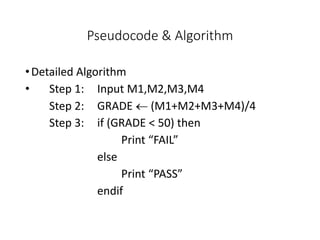
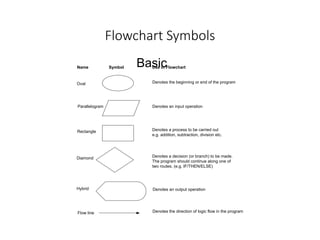
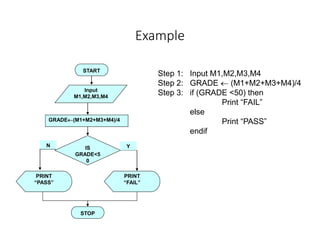
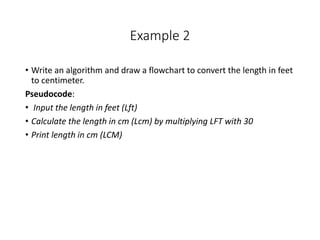
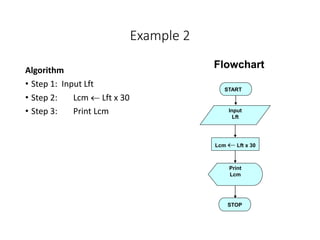
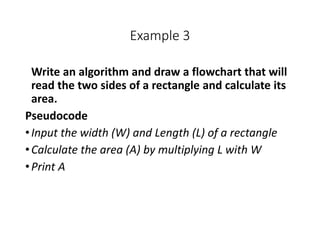
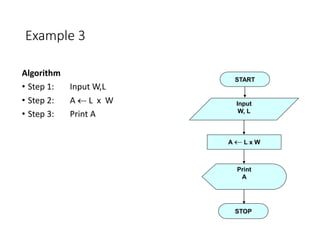
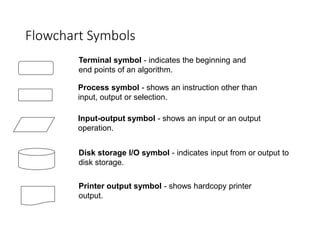
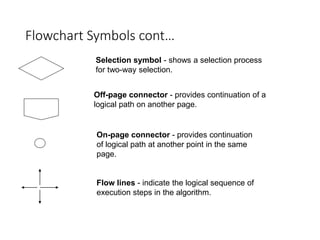
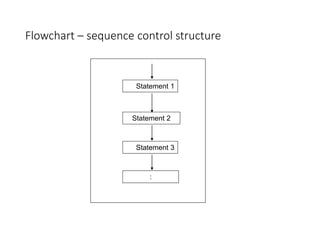
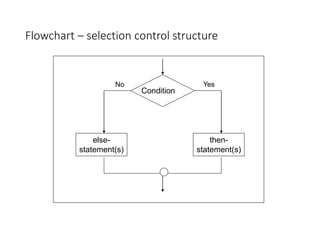
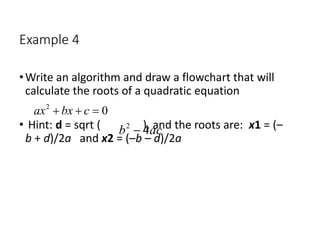
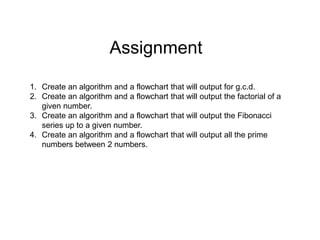
Successfully reported this slideshow.
Your SlideShare is downloading. ×

algorithms and flow chart overview.pdf

Ad
Ad
Ad
Ad
Ad
Ad
Ad
Ad
Ad
Ad
Ad
Upcoming SlideShare
AlgorithmAndFlowChart.pdf
Loading in …3
×

Check these out next

1 of 29 Ad

More Related Content

Advertisement

algorithms and flow chart overview.pdf

  1. 1. ALGORITHMS AND FLOWCHARTS
  2. 2. ALGORITHMS AND FLOWCHARTS •A typical programming task can be divided into two phases: •Problem solving phase • produce an ordered sequence of steps that describe solution of problem • this sequence of steps is called an algorithm •Implementation phase • implement the program in some programming language
  3. 3. Steps in Problem Solving •First produce a general algorithm (one can use pseudocode) •Refine the algorithm successively to get step by step detailed algorithm that is very close to a computer language. •Pseudocode is an artificial and informal language that helps programmers develop algorithms. Pseudocode is very similar to everyday English.
  4. 4. Pseudocode & Algorithm • Example 1: Write an algorithm to determine a student’s final grade and indicate whether it is passing or failing. The final grade is calculated as the average of four marks.
  5. 5. Pseudocode & Algorithm Pseudocode: •Input a set of 4 marks •Calculate their average by summing and dividing by 4 •if average is below 50 Print “FAIL” else Print “PASS”
  6. 6. Pseudocode & Algorithm •Detailed Algorithm • Step 1: Input M1,M2,M3,M4 Step 2: GRADE  (M1+M2+M3+M4)/4 Step 3: if (GRADE < 50) then Print “FAIL” else Print “PASS” endif
  7. 7. The Flowchart • (Dictionary) A schematic representation of a sequence of operations, as in a manufacturing process or computer program. • (Technical) A graphical representation of the sequence of operations in an information system or program. • Information system flowcharts show how data flows from source documents through the computer to final distribution to users. • Program flowcharts show the sequence of instructions in a single program or subroutine. Different symbols are used to draw each type of flowchart.
  8. 8. The Flowchart A Flowchart • shows logic of an algorithm • emphasizes individual steps and their interconnections • e.g. control flow from one action to the next
  9. 9. Flowchart Symbols Oval Parallelogram Rectangle Diamond Hybrid Name Symbol Use in Flowchart Denotes the beginning or end of the program Denotes an input operation Denotes an output operation Denotes a decision (or branch) to be made. The program should continue along one of two routes. (e.g. IF/THEN/ELSE) Denotes a process to be carried out e.g. addition, subtraction, division etc. Flow line Denotes the direction of logic flow in the program Basic
  10. 10. Example PRINT “PASS” Step 1: Input M1,M2,M3,M4 Step 2: GRADE  (M1+M2+M3+M4)/4 Step 3: if (GRADE <50) then Print “FAIL” else Print “PASS” endif START Input M1,M2,M3,M4 GRADE(M1+M2+M3+M4)/4 IS GRADE<5 0 PRINT “FAIL” STOP Y N
  11. 11. Example 2 • Write an algorithm and draw a flowchart to convert the length in feet to centimeter. Pseudocode: • Input the length in feet (Lft) • Calculate the length in cm (Lcm) by multiplying LFT with 30 • Print length in cm (LCM)
  12. 12. Example 2 Algorithm • Step 1: Input Lft • Step 2: Lcm  Lft x 30 • Step 3: Print Lcm START Input Lft Lcm  Lft x 30 Print Lcm STOP Flowchart
  13. 13. Example 3 Write an algorithm and draw a flowchart that will read the two sides of a rectangle and calculate its area. Pseudocode •Input the width (W) and Length (L) of a rectangle •Calculate the area (A) by multiplying L with W •Print A
  14. 14. Example 3 Algorithm • Step 1: Input W,L • Step 2: A  L x W • Step 3: Print A START Input W, L A  L x W Print A STOP
  15. 15. Flowcharts • Flowcharts is a graph used to depict or show a step by step solution using symbols which represent a task. • The symbols used consist of geometrical shapes that are connected by flow lines. • It is an alternative to pseudocoding; whereas a pseudocode description is verbal, a flowchart is graphical in nature.
  16. 16. Flowchart Symbols Terminal symbol - indicates the beginning and end points of an algorithm. Process symbol - shows an instruction other than input, output or selection. Input-output symbol - shows an input or an output operation. Disk storage I/O symbol - indicates input from or output to disk storage. Printer output symbol - shows hardcopy printer output.
  17. 17. Flowchart Symbols cont… Selection symbol - shows a selection process for two-way selection. Off-page connector - provides continuation of a logical path on another page. On-page connector - provides continuation of logical path at another point in the same page. Flow lines - indicate the logical sequence of execution steps in the algorithm.
  18. 18. Flowchart – sequence control structure Statement 2 Statement 1 Statement 3 :
  19. 19. Flowchart – selection control structure Condition else- statement(s) then- statement(s) Yes No
  20. 20. Flowchart – repetition control structure Condition Loop Statement(s) yes no
  21. 21. Flowchart – example 1 Begin Read birth date Calculate Age = current year – birth date Display age End
  22. 22. Flowchart – example 2 Begin Read age End Age > 55? NO YES print “Pencen” print “Kerja lagi”
  23. 23. Flowchart – example 5 Begin End current_number <= 10? NO YES sum = 0 current_number = 1 sum = sum + current_number current_number = current_number + 1 print sum
  24. 24. Example 4 •Write an algorithm and draw a flowchart that will calculate the roots of a quadratic equation • Hint: d = sqrt ( ), and the roots are: x1 = (– b + d)/2a and x2 = (–b – d)/2a 2 0 ax bx c + + = 2 4 b ac −
  25. 25. Exercises: Algorithm & Flowchart 1.) Create an algorithm and a flowchart that will accept/read two numbers and then display the bigger number.
  26. 26. 2.) Create an algorithm and a flowchart that will compute the area of a circle.
  27. 27. 3.) Create an algorithm and a flowchart that will compute the sum of two numbers. If the sum is below or equal to twenty, two numbers will be entered again. If the sum is above 20, it will display the sum.
  28. 28. 4) Create an algorithm and a flowchart that will output the largest number among the three numbers.
  29. 29. Assignment 1. Create an algorithm and a flowchart that will output for g.c.d. 2. Create an algorithm and a flowchart that will output the factorial of a given number. 3. Create an algorithm and a flowchart that will output the Fibonacci series up to a given number. 4. Create an algorithm and a flowchart that will output all the prime numbers between 2 numbers.

×