A Specification Independent Control Strategy for Fuel Cell Hybrid Vehicles
•
0 likes•156 views

assist

Recommended
Recommended
More Related Content
What's hot
What's hot (20)
Similar to A Specification Independent Control Strategy for Fuel Cell Hybrid Vehicles
Similar to A Specification Independent Control Strategy for Fuel Cell Hybrid Vehicles (20)
Recently uploaded
Recently uploaded (20)
A Specification Independent Control Strategy for Fuel Cell Hybrid Vehicles
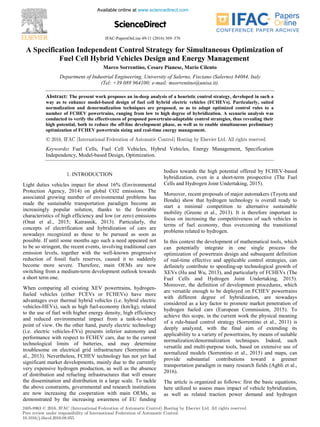
- 1. IFAC-PapersOnLine 49-11 (2016) 369–376 ScienceDirectScienceDirect Available online at www.sciencedirect.com 2405-8963 © 2016, IFAC (International Federation of Automatic Control) Hosting by Elsevier Ltd. All rights reserved. Peer review under responsibility of International Federation of Automatic Control. 10.1016/j.ifacol.2016.08.055 © 2016, IFAC (International Federation of Automatic Control) Hosting by Elsevier Ltd. All rights reserved. A Specification Independent Control Strategy for Simultaneous Optimization of Fuel Cell Hybrid Vehicles Design and Energy Management Marco Sorrentino, Cesare Pianese, Mario Cilento Department of Industrial Engineering, University of Salerno, Fisciano (Salerno) 84084, Italy (Tel: +39 089 964100; e-mail: msorrentino@unisa.it). Abstract: The present work proposes an in-deep analysis of a heuristic control strategy, developed in such a way as to enhance model-based design of fuel cell hybrid electric vehicles (FCHEVs). Particularly, suited normalization and denormalization techniques are proposed, so as to adapt optimized control rules to a number of FCHEV powertrains, ranging from low to high degree of hybridization. A scenario analysis was conducted to verify the effectiveness of proposed powertrain-adaptable control strategies, thus revealing their high potential, both to reduce the off-line development phase, as well as to enable simultaneous preliminary optimization of FCHEV powertrain sizing and real-time energy management. Keywords: Fuel Cells, Fuel Cell Vehicles, Hybrid Vehicles, Energy Management, Specification Independency, Model-based Design, Optimization. 1. INTRODUCTION Light duties vehicles impact for about 16% (Environmental Protection Agency, 2014) on global CO2 emissions. The associated growing number of environmental problems has made the sustainable transportation paradigm become an increasingly popular solution, thanks to the favorable characteristics of high efficiency and low (or zero) emissions (Onat et al., 2015; Katrasnik, 2013). Particularly, the concepts of electrification and hybridization of cars are nowadays recognized as those to be pursued as soon as possible. If until some months ago such a need appeared not to be so stringent, the recent events, involving traditional cars emission levels, together with the well-known progressive reduction of fossil fuels reserves, caused it to suddenly become more severe. Therefore, main OEMs are now switching from a medium-term development outlook towards a short term one. When comparing all existing XEV powertrains, hydrogen- fueled vehicles (either FCEVs or FCHEVs) have more advantages over thermal hybrid vehicles (i.e. hybrid electric vehicles-HEVs), such as high fuel-economy (km/kg), related to the use of fuel with higher energy density, high efficiency and reduced environmental impact from a tank-to-wheel point of view. On the other hand, purely electric technology (i.e. electric vehicles-EVs) presents inferior autonomy and performance with respect to FCHEV cars, due to the current technological limits of batteries, and may determine troublesome on electrical grid infrastructure (Sorrentino et al., 2013). Nevertheless, FCHEV technology has not yet had significant market developments, mainly due to the currently very expensive hydrogen production, as well as the absence of distribution and refueling infrastructures that will ensure the dissemination and distribution in a large scale. To tackle the above constraints, governmental and research institutions are now increasing the cooperation with main OEMs, as demonstrated by the increasing awareness of EU funding bodies towards the high potential offered by FCHEV-based hybridization, even in a short-term prospective (The Fuel Cells and Hydrogen Joint Undertaking, 2015). Moreover, recent proposals of major automakers (Toyota and Honda) show that hydrogen technology is overall ready to start a minimal competition to alternative sustainable mobility (Greene et al., 2013). It is therefore important to focus on increasing the competitiveness of such vehicles in terms of fuel economy, thus overcoming the transitional problems related to hydrogen. In this context the development of mathematical tools, which can potentially integrate in one single process the optimization of powertrain design and subsequent definition of real-time effective and applicable control strategies, can definitely contribute to speeding-up technological growth of XEVs (Hu and Wu, 2013), and particularly of FCHEVs (The Fuel Cells and Hydrogen Joint Undertaking, 2015). Moreover, the definition of development procedures, which are versatile enough to be deployed on FCHEV powertrains with different degree of hybridization, are nowadays considered as a key factor to promote market penetration of hydrogen fueled cars (European Commission, 2015). To achieve this scope, in the current work the physical meaning of a rule-based control strategy (Sorrentino et al., 2011) is deeply analyzed, with the final aim of extending its applicability to a variety of powertrains, by means of suitable normalization/denormalization techniques. Indeed, such versatile and multi-purpose tools, based on extensive use of normalized models (Sorrentino et al., 2015) and maps, can provide substantial contributions toward a greener transportation paradigm in many research fields (Agbli et al., 2016). The article is organized as follows: first the basic equations, here utilized to assess mass impact of vehicle hybridization, as well as related traction power demand and hydrogen Preprints, 8th IFAC International Symposium on Advances in Automotive Control June 19-23, 2016. Norrköping, Sweden Copyright © 2016 IFAC 378 A Specification Independent Control Strategy for Simultaneous Optimization of Fuel Cell Hybrid Vehicles Design and Energy Management Marco Sorrentino, Cesare Pianese, Mario Cilento Department of Industrial Engineering, University of Salerno, Fisciano (Salerno) 84084, Italy (Tel: +39 089 964100; e-mail: msorrentino@unisa.it). Abstract: The present work proposes an in-deep analysis of a heuristic control strategy, developed in such a way as to enhance model-based design of fuel cell hybrid electric vehicles (FCHEVs). Particularly, suited normalization and denormalization techniques are proposed, so as to adapt optimized control rules to a number of FCHEV powertrains, ranging from low to high degree of hybridization. A scenario analysis was conducted to verify the effectiveness of proposed powertrain-adaptable control strategies, thus revealing their high potential, both to reduce the off-line development phase, as well as to enable simultaneous preliminary optimization of FCHEV powertrain sizing and real-time energy management. Keywords: Fuel Cells, Fuel Cell Vehicles, Hybrid Vehicles, Energy Management, Specification Independency, Model-based Design, Optimization. 1. INTRODUCTION Light duties vehicles impact for about 16% (Environmental Protection Agency, 2014) on global CO2 emissions. The associated growing number of environmental problems has made the sustainable transportation paradigm become an increasingly popular solution, thanks to the favorable characteristics of high efficiency and low (or zero) emissions (Onat et al., 2015; Katrasnik, 2013). Particularly, the concepts of electrification and hybridization of cars are nowadays recognized as those to be pursued as soon as possible. If until some months ago such a need appeared not to be so stringent, the recent events, involving traditional cars emission levels, together with the well-known progressive reduction of fossil fuels reserves, caused it to suddenly become more severe. Therefore, main OEMs are now switching from a medium-term development outlook towards a short term one. When comparing all existing XEV powertrains, hydrogen- fueled vehicles (either FCEVs or FCHEVs) have more advantages over thermal hybrid vehicles (i.e. hybrid electric vehicles-HEVs), such as high fuel-economy (km/kg), related to the use of fuel with higher energy density, high efficiency and reduced environmental impact from a tank-to-wheel point of view. On the other hand, purely electric technology (i.e. electric vehicles-EVs) presents inferior autonomy and performance with respect to FCHEV cars, due to the current technological limits of batteries, and may determine troublesome on electrical grid infrastructure (Sorrentino et al., 2013). Nevertheless, FCHEV technology has not yet had significant market developments, mainly due to the currently very expensive hydrogen production, as well as the absence of distribution and refueling infrastructures that will ensure the dissemination and distribution in a large scale. To tackle the above constraints, governmental and research institutions are now increasing the cooperation with main OEMs, as demonstrated by the increasing awareness of EU funding bodies towards the high potential offered by FCHEV-based hybridization, even in a short-term prospective (The Fuel Cells and Hydrogen Joint Undertaking, 2015). Moreover, recent proposals of major automakers (Toyota and Honda) show that hydrogen technology is overall ready to start a minimal competition to alternative sustainable mobility (Greene et al., 2013). It is therefore important to focus on increasing the competitiveness of such vehicles in terms of fuel economy, thus overcoming the transitional problems related to hydrogen. In this context the development of mathematical tools, which can potentially integrate in one single process the optimization of powertrain design and subsequent definition of real-time effective and applicable control strategies, can definitely contribute to speeding-up technological growth of XEVs (Hu and Wu, 2013), and particularly of FCHEVs (The Fuel Cells and Hydrogen Joint Undertaking, 2015). Moreover, the definition of development procedures, which are versatile enough to be deployed on FCHEV powertrains with different degree of hybridization, are nowadays considered as a key factor to promote market penetration of hydrogen fueled cars (European Commission, 2015). To achieve this scope, in the current work the physical meaning of a rule-based control strategy (Sorrentino et al., 2011) is deeply analyzed, with the final aim of extending its applicability to a variety of powertrains, by means of suitable normalization/denormalization techniques. Indeed, such versatile and multi-purpose tools, based on extensive use of normalized models (Sorrentino et al., 2015) and maps, can provide substantial contributions toward a greener transportation paradigm in many research fields (Agbli et al., 2016). The article is organized as follows: first the basic equations, here utilized to assess mass impact of vehicle hybridization, as well as related traction power demand and hydrogen Advances in Automotive Control June 19-23, 2016. Norrköping, Sweden Copyright © 2016 IFAC 378 A Specification Independent Control Strategy for Simultaneous Optimization of Fuel Cell Hybrid Vehicles Design and Energy Management Marco Sorrentino, Cesare Pianese, Mario Cilento Department of Industrial Engineering, University of Salerno, Fisciano (Salerno) 84084, Italy (Tel: +39 089 964100; e-mail: msorrentino@unisa.it). Abstract: The present work proposes an in-deep analysis of a heuristic control strategy, developed in such a way as to enhance model-based design of fuel cell hybrid electric vehicles (FCHEVs). Particularly, suited normalization and denormalization techniques are proposed, so as to adapt optimized control rules to a number of FCHEV powertrains, ranging from low to high degree of hybridization. A scenario analysis was conducted to verify the effectiveness of proposed powertrain-adaptable control strategies, thus revealing their high potential, both to reduce the off-line development phase, as well as to enable simultaneous preliminary optimization of FCHEV powertrain sizing and real-time energy management. Keywords: Fuel Cells, Fuel Cell Vehicles, Hybrid Vehicles, Energy Management, Specification Independency, Model-based Design, Optimization. 1. INTRODUCTION Light duties vehicles impact for about 16% (Environmental Protection Agency, 2014) on global CO2 emissions. The associated growing number of environmental problems has made the sustainable transportation paradigm become an increasingly popular solution, thanks to the favorable characteristics of high efficiency and low (or zero) emissions (Onat et al., 2015; Katrasnik, 2013). Particularly, the concepts of electrification and hybridization of cars are nowadays recognized as those to be pursued as soon as possible. If until some months ago such a need appeared not to be so stringent, the recent events, involving traditional cars emission levels, together with the well-known progressive reduction of fossil fuels reserves, caused it to suddenly become more severe. Therefore, main OEMs are now switching from a medium-term development outlook towards a short term one. When comparing all existing XEV powertrains, hydrogen- fueled vehicles (either FCEVs or FCHEVs) have more advantages over thermal hybrid vehicles (i.e. hybrid electric vehicles-HEVs), such as high fuel-economy (km/kg), related to the use of fuel with higher energy density, high efficiency and reduced environmental impact from a tank-to-wheel point of view. On the other hand, purely electric technology (i.e. electric vehicles-EVs) presents inferior autonomy and performance with respect to FCHEV cars, due to the current technological limits of batteries, and may determine troublesome on electrical grid infrastructure (Sorrentino et al., 2013). Nevertheless, FCHEV technology has not yet had significant market developments, mainly due to the currently very expensive hydrogen production, as well as the absence of distribution and refueling infrastructures that will ensure the dissemination and distribution in a large scale. To tackle the above constraints, governmental and research institutions are now increasing the cooperation with main OEMs, as demonstrated by the increasing awareness of EU funding bodies towards the high potential offered by FCHEV-based hybridization, even in a short-term prospective (The Fuel Cells and Hydrogen Joint Undertaking, 2015). Moreover, recent proposals of major automakers (Toyota and Honda) show that hydrogen technology is overall ready to start a minimal competition to alternative sustainable mobility (Greene et al., 2013). It is therefore important to focus on increasing the competitiveness of such vehicles in terms of fuel economy, thus overcoming the transitional problems related to hydrogen. In this context the development of mathematical tools, which can potentially integrate in one single process the optimization of powertrain design and subsequent definition of real-time effective and applicable control strategies, can definitely contribute to speeding-up technological growth of XEVs (Hu and Wu, 2013), and particularly of FCHEVs (The Fuel Cells and Hydrogen Joint Undertaking, 2015). Moreover, the definition of development procedures, which are versatile enough to be deployed on FCHEV powertrains with different degree of hybridization, are nowadays considered as a key factor to promote market penetration of hydrogen fueled cars (European Commission, 2015). To achieve this scope, in the current work the physical meaning of a rule-based control strategy (Sorrentino et al., 2011) is deeply analyzed, with the final aim of extending its applicability to a variety of powertrains, by means of suitable normalization/denormalization techniques. Indeed, such versatile and multi-purpose tools, based on extensive use of normalized models (Sorrentino et al., 2015) and maps, can provide substantial contributions toward a greener transportation paradigm in many research fields (Agbli et al., 2016). The article is organized as follows: first the basic equations, here utilized to assess mass impact of vehicle hybridization, as well as related traction power demand and hydrogen Preprints, 8th IFAC International Symposium on Advances in Automotive Control June 19-23, 2016. Norrköping, Sweden Copyright © 2016 IFAC 378 A Specification Independent Control Strategy for Simultaneous Optimization of Fuel Cell Hybrid Vehicles Design and Energy Management Marco Sorrentino, Cesare Pianese, Mario Cilento Department of Industrial Engineering, University of Salerno, Fisciano (Salerno) 84084, Italy (Tel: +39 089 964100; e-mail: msorrentino@unisa.it). Abstract: The present work proposes an in-deep analysis of a heuristic control strategy, developed in such a way as to enhance model-based design of fuel cell hybrid electric vehicles (FCHEVs). Particularly, suited normalization and denormalization techniques are proposed, so as to adapt optimized control rules to a number of FCHEV powertrains, ranging from low to high degree of hybridization. A scenario analysis was conducted to verify the effectiveness of proposed powertrain-adaptable control strategies, thus revealing their high potential, both to reduce the off-line development phase, as well as to enable simultaneous preliminary optimization of FCHEV powertrain sizing and real-time energy management. Keywords: Fuel Cells, Fuel Cell Vehicles, Hybrid Vehicles, Energy Management, Specification Independency, Model-based Design, Optimization. 1. INTRODUCTION Light duties vehicles impact for about 16% (Environmental Protection Agency, 2014) on global CO2 emissions. The associated growing number of environmental problems has made the sustainable transportation paradigm become an increasingly popular solution, thanks to the favorable characteristics of high efficiency and low (or zero) emissions (Onat et al., 2015; Katrasnik, 2013). Particularly, the concepts of electrification and hybridization of cars are nowadays recognized as those to be pursued as soon as possible. If until some months ago such a need appeared not to be so stringent, the recent events, involving traditional cars emission levels, together with the well-known progressive reduction of fossil fuels reserves, caused it to suddenly become more severe. Therefore, main OEMs are now switching from a medium-term development outlook towards a short term one. When comparing all existing XEV powertrains, hydrogen- fueled vehicles (either FCEVs or FCHEVs) have more advantages over thermal hybrid vehicles (i.e. hybrid electric vehicles-HEVs), such as high fuel-economy (km/kg), related to the use of fuel with higher energy density, high efficiency and reduced environmental impact from a tank-to-wheel point of view. On the other hand, purely electric technology (i.e. electric vehicles-EVs) presents inferior autonomy and performance with respect to FCHEV cars, due to the current technological limits of batteries, and may determine troublesome on electrical grid infrastructure (Sorrentino et al., 2013). Nevertheless, FCHEV technology has not yet had significant market developments, mainly due to the currently very expensive hydrogen production, as well as the absence of distribution and refueling infrastructures that will ensure the dissemination and distribution in a large scale. To tackle the above constraints, governmental and research institutions are now increasing the cooperation with main OEMs, as demonstrated by the increasing awareness of EU funding bodies towards the high potential offered by FCHEV-based hybridization, even in a short-term prospective (The Fuel Cells and Hydrogen Joint Undertaking, 2015). Moreover, recent proposals of major automakers (Toyota and Honda) show that hydrogen technology is overall ready to start a minimal competition to alternative sustainable mobility (Greene et al., 2013). It is therefore important to focus on increasing the competitiveness of such vehicles in terms of fuel economy, thus overcoming the transitional problems related to hydrogen. In this context the development of mathematical tools, which can potentially integrate in one single process the optimization of powertrain design and subsequent definition of real-time effective and applicable control strategies, can definitely contribute to speeding-up technological growth of XEVs (Hu and Wu, 2013), and particularly of FCHEVs (The Fuel Cells and Hydrogen Joint Undertaking, 2015). Moreover, the definition of development procedures, which are versatile enough to be deployed on FCHEV powertrains with different degree of hybridization, are nowadays considered as a key factor to promote market penetration of hydrogen fueled cars (European Commission, 2015). To achieve this scope, in the current work the physical meaning of a rule-based control strategy (Sorrentino et al., 2011) is deeply analyzed, with the final aim of extending its applicability to a variety of powertrains, by means of suitable normalization/denormalization techniques. Indeed, such versatile and multi-purpose tools, based on extensive use of normalized models (Sorrentino et al., 2015) and maps, can provide substantial contributions toward a greener transportation paradigm in many research fields (Agbli et al., 2016). The article is organized as follows: first the basic equations, here utilized to assess mass impact of vehicle hybridization, as well as related traction power demand and hydrogen Preprints, 8th IFAC International Symposium on Advances in Automotive Control June 19-23, 2016. Norrköping, Sweden Copyright © 2016 IFAC 378 A Specification Independent Control Strategy for Simultaneous Optimization of Fuel Cell Hybrid Vehicles Design and Energy Management Marco Sorrentino, Cesare Pianese, Mario Cilento Department of Industrial Engineering, University of Salerno, Fisciano (Salerno) 84084, Italy (Tel: +39 089 964100; e-mail: msorrentino@unisa.it). Abstract: The present work proposes an in-deep analysis of a heuristic control strategy, developed in such a way as to enhance model-based design of fuel cell hybrid electric vehicles (FCHEVs). Particularly, suited normalization and denormalization techniques are proposed, so as to adapt optimized control rules to a number of FCHEV powertrains, ranging from low to high degree of hybridization. A scenario analysis was conducted to verify the effectiveness of proposed powertrain-adaptable control strategies, thus revealing their high potential, both to reduce the off-line development phase, as well as to enable simultaneous preliminary optimization of FCHEV powertrain sizing and real-time energy management. Keywords: Fuel Cells, Fuel Cell Vehicles, Hybrid Vehicles, Energy Management, Specification Independency, Model-based Design, Optimization. 1. INTRODUCTION Light duties vehicles impact for about 16% (Environmental Protection Agency, 2014) on global CO2 emissions. The associated growing number of environmental problems has made the sustainable transportation paradigm become an increasingly popular solution, thanks to the favorable characteristics of high efficiency and low (or zero) emissions (Onat et al., 2015; Katrasnik, 2013). Particularly, the concepts of electrification and hybridization of cars are nowadays recognized as those to be pursued as soon as possible. If until some months ago such a need appeared not to be so stringent, the recent events, involving traditional cars emission levels, together with the well-known progressive reduction of fossil fuels reserves, caused it to suddenly become more severe. Therefore, main OEMs are now switching from a medium-term development outlook towards a short term one. When comparing all existing XEV powertrains, hydrogen- fueled vehicles (either FCEVs or FCHEVs) have more advantages over thermal hybrid vehicles (i.e. hybrid electric vehicles-HEVs), such as high fuel-economy (km/kg), related to the use of fuel with higher energy density, high efficiency and reduced environmental impact from a tank-to-wheel point of view. On the other hand, purely electric technology (i.e. electric vehicles-EVs) presents inferior autonomy and performance with respect to FCHEV cars, due to the current technological limits of batteries, and may determine troublesome on electrical grid infrastructure (Sorrentino et al., 2013). Nevertheless, FCHEV technology has not yet had significant market developments, mainly due to the currently very expensive hydrogen production, as well as the absence of distribution and refueling infrastructures that will ensure the dissemination and distribution in a large scale. To tackle the above constraints, governmental and research institutions are now increasing the cooperation with main OEMs, as demonstrated by the increasing awareness of EU funding bodies towards the high potential offered by FCHEV-based hybridization, even in a short-term prospective (The Fuel Cells and Hydrogen Joint Undertaking, 2015). Moreover, recent proposals of major automakers (Toyota and Honda) show that hydrogen technology is overall ready to start a minimal competition to alternative sustainable mobility (Greene et al., 2013). It is therefore important to focus on increasing the competitiveness of such vehicles in terms of fuel economy, thus overcoming the transitional problems related to hydrogen. In this context the development of mathematical tools, which can potentially integrate in one single process the optimization of powertrain design and subsequent definition of real-time effective and applicable control strategies, can definitely contribute to speeding-up technological growth of XEVs (Hu and Wu, 2013), and particularly of FCHEVs (The Fuel Cells and Hydrogen Joint Undertaking, 2015). Moreover, the definition of development procedures, which are versatile enough to be deployed on FCHEV powertrains with different degree of hybridization, are nowadays considered as a key factor to promote market penetration of hydrogen fueled cars (European Commission, 2015). To achieve this scope, in the current work the physical meaning of a rule-based control strategy (Sorrentino et al., 2011) is deeply analyzed, with the final aim of extending its applicability to a variety of powertrains, by means of suitable normalization/denormalization techniques. Indeed, such versatile and multi-purpose tools, based on extensive use of normalized models (Sorrentino et al., 2015) and maps, can provide substantial contributions toward a greener transportation paradigm in many research fields (Agbli et al., 2016). The article is organized as follows: first the basic equations, here utilized to assess mass impact of vehicle hybridization, as well as related traction power demand and hydrogen Preprints, 8th IFAC International Symposium on Advances in Automotive Control June 19-23, 2016. Norrköping, Sweden Copyright © 2016 IFAC 378
- 2. 370 Marco Sorrentino et al. / IFAC-PapersOnLine 49-11 (2016) 369–376 consumption, are briefly recalled. Afterwards, the heuristic control strategy is described, followed by a detailed physical analysis of best rules, as addressed by a model-based optimization analysis run on several hybridization degree values. The normalization and denormalization techniques are then proposed and verified via suitable scenario analyses. 2. MATHEMATICAL MODELS OF THE TOOL 2.1 Mass model A parametric model was used to assess the impact of hybridization on vehicle mass. By referring to the vehicle architecture shown in Fig. 1, the mass of an FCHEV (MFCHEV) can be obtained by adding the mass of major hybridizing devices to the vehicle body mass (Mbody). This latter is derived from the mass of the reference conventional vehicle (MCV) by subtracting the contributions due to the original gear box, as follows: )(* , GBICECVICECVbody mmPMM (1) Then, vehicle mass can be determined adding the hybridization devices and by imposing that the HFCV power to weight ratio (i.e. PtW ) equals conventional vehicle (CV) one, thus ensuring HFCV guarantees the same CV acceleration performance: HTBCBCEMEMFCFCbodyFCHEV MNMmPmPMM ** (2) where the last term represents hydrogen tank mass. Fig. 1. Fuel cell powertrain schematic (Series architecture). The number of battery cells (NBc) is determined by knowing the rated power of the electric motor EM (PEM*) and FC system (PFC*), as well as the power of a single battery cell (PBc*), assumed hereinafter constantly equal to 1.25 kW (Nelson et al. 2007): * ** Bc FCEM P PP Nc (3) CV * CV,ICE * EM PtW * EM HFCV M P PP M (4) Table 1 lists the unit mass here assumed for each powertrain component. It is worth remarking that P* variables refer to generic component rated power. Table 1 Components unit mass (Thomas et al., 1998 - Klell, 2010). mICE = internal combustion engine (kg kW-1 ) 2 mGB = gear box (kg kW-1 ) 0.478 mEM = electric motor (including inverter) (kg kW-1 ) 1 mFC = PEM fuel cell system (kg kW-1 ) 3.7 MHT = hydrogen tank (kg kW-1 ) 1.9 MBC = single cell battery mass (kg cell-1 ) 4.67 2.2 Longitudinal vehicle model Fuel economies in this paper are evaluated by means of a backward longitudinal vehicle model, whose basic equations are presented below. Traction power is estimated as: v dt dv MvACCvgMP effxrHFCVtr 3 5.0)sin()cos( (5) where α and ρ are the road grade and air density, respectively, while Meff equals 1.1 MHFCV to suitably account for rotational inertia. For non-negative Ptr values, the mechanical power to be supplied by the EM is (see Fig. 1): tr tr EM P P if 0trP (6) PEM can also be expressed as a function of fuel cell system and battery power, as follows: )( BFCEMEM PPP if 0trP (7) where the η variables correspond to efficiency terms. On the other hand, when Ptr < 0, the regenerative braking mode is active, resulting in the following expression for the electrical energy delivered by the EM: trEMtrEM PP if 0trP (8) During regenerative braking, battery can be charged by the fuel cell system, thus the following equation holds for negative Ptr values: FCEMB PPP if 0trP (9) It is worth remarking here that electric motor efficiency is computed by means of normalized maps derived from the model library proposed in (Rousseau et al., 2004). Instead, fuel cell system efficiency is computed by means of the following relationship, obtained by curve fitting experimental data acquired on a dedicated fuel test-bench available at the energy and Propulsion laboratory at University of Salerno (Sorrentino et al., 2013). 3FC2 2 FC1 2FC1 FC qPqPq pPp (10) 3. HEURISTIC CONTROL STRATEGY 3.1 Best rules definition via optimization analysis This section discusses in detail the two heuristic rules proposed in (Sorrentino et al., 2011) and then extended to fuel cell vehicles in (Sorrentino et al., 2013). The optimal values of electric power supplied by FC (i.e. PFCsupply) and IFAC AAC 2016 June 19-23, 2016. Norrköping, Sweden 379
- 3. Marco Sorrentino et al. / IFAC-PapersOnLine 49-11 (2016) 369–376 371 dSOC (maximum allowable oscillation around targeted battery state of charge - SOC) are estimated online as a function of the average power demand: )P(fP trplysup,FC (11) )( trPgdSOC (12) By solving the following minimization problem (over an extended range of average traction power demand), it is possible to find the optimal f and g functions: dt)t,P(mmin OFFFCSplysupFCHtP 2OFFFC,plysupFC (13) Subject to the constraint: fSOCendSOC )( (14) Solving the above minimization problem corresponds to identifying the best engine intermittency (i.e. tFCS-OFF, which is the time during which FCS is kept off) and power level at which the fuel cell system should be operated for a given average traction power demand trP . This latter variable is estimated over a time horizon (th) with either an a-priori or a- posteriori method (see Sorrentino et al. 2011), here set to th=10 min (see Fig. 2). Fig. 2. dSOC indirect determination from the optimal SOC trajectory, as addressed by the solved minimization problem (see Eq. (12)) for an assigned trP value. The solutions can be studied by analyzing the resulting two maps associated to Eqs. (11) and (12). Particularly, in this study several maps couple were obtained through above described optimization, each corresponding to a different degree of hybridization (DH), the latter variable corresponding to the ratio between rated battery and electric motor power. Table 2 lists main specifications of the FCHEVs here considered, obtained by deploying the mass model described in section 1 for varying nominal fuel cell system power, while keeping constant the power to weight ratio. Each optimized map was normalized, in such a way as to become potentially extendable to different degrees of hybridization, as discussed later on. Normalization of the map relating to PFCsupply is straithforward, as it can be simply obtained as the ratio of Eq. (11) data divided by rated fuel cell system power (see Eq. 15). On the other hand, Eq. (16) is here proposed to account for the impact of larger/smaller battery size when extending a map optimized on one of the FCHEVs listed in Table 2 (e.g. PFC*=30 kW) to another one (e.g. PFC*=50 kW): * FC plysupFC norm,plysupFC P P P (15) CapdSOC=dSOC BATTrefnorm (16) It is worth noting that in Eq. (16) CapBATTref represents the battery capacity [kWh] of the powertrain, on which the optimization was performed (see Table 2). Thus, Eq. (16) allows introducing specification independency in optimal thermostatic management of FCHEV, provided that rule extension is accomplished by appropriately rescaling the dSOCnorm with respect to new powertrain specifications. The latter aspect, which actually corresponds to the denormalization phase, is described in detail in the following (see section 3.2). Table 2 FCHEV specifications assumed to derive the optimized rules maps. PEM* refers to the rated power of the electric motor installed on board. PFC* (kW) Battery mass (kg) Battery Capacity (kWh) FCHEV mass (kg) PEM* (kW) 20 271 46 1594.08 92.13 30 234 39 1593.70 92.10 40 196 33 1593.31 92.08 50 159 27 1592.92 92.06 60 121 20 1592.54 92.04 Fig. 3 and Fig. 4 show all the normalized maps obtained. Below is an explanation on the physical behavior, as addressed by the optimization analysis conducted over the 5 vehicles listed in Table 2. For all vehicles, normalized fuel cell power exhibits a monotonic increase. This behavior could in principle appear unexpected, as commonly fuel cell systems work at best efficiency at relatively low power. Nevertheless, the fact that fuel cell system efficiency falls quite close to its optimal value, in a wide range (Arsie et al., 2006), justifies the above- noticed general load following behavior for fuel cell supply power map. Moreover, Fig. 4 indicates that fuel cell power supply does not differ significantly at low traction power, whereas the discrepancy between one map and another becomes larger as trP increases. This is mostly due to the normalization effect (see Eq. 15). More interesting, from the physical point of view, is the dSOCnorm map behavior, illustrated in Fig. 3. Particularly, at low traction power the optimization algorithm proposes, independently from degree of hybridization, monotonically increasing behavior. This happens thanks to the sudden increase in fuel cell power supply in these conditions (see Fig. 4, which particularly guarantees easily achieving charge sustaining behavior). Then, varying DH impact starts increasing beyond trP =3 kW, because of a balance between the involved energetic flows: vehicles with a low degree of IFAC AAC 2016 June 19-23, 2016. Norrköping, Sweden 380
- 4. 372 Marco Sorrentino et al. / IFAC-PapersOnLine 49-11 (2016) 369–376 hybridization can afford working with higher dSOCnorm excursions, thanks to the higher power that can be supplied by the FC system. The latter behavior continues up to significantly high trP values: only after trP =15 kW the increasing trend reduces, thus leading dSOCnorm to set on a plateau region above this value. On the other hand, vehicles with higher degree of hybridization can afford an increasing dSOCnorm trend within a smaller trP range, as well as with reduced slope (e.g. PFC*=40 kW). After reaching a maximum, for such powertrains it is necessary to reduce dSOCnorm excursions to meet charge-sustaining constraint (see Eq. 14). The values of dSOCnorm for PFC*=20 kW, however, are very close to zero when trP values are high (e.g. over 10 kW): this indicates the increasing difficulty in guaranteeing charge- sustaining battery operation, with the fuel cell system turned on for most of the time. In fact, for trP values above 15 kW, the case corresponding to PFC*=20kW loses physical sense, since the power given by the fuel cell system becomes lower than that required. Fortunately, urban/suburban driving are mostly characterized by trP lower than 10 kW on average. Thus, the results yielded on output by the optimization analysis can be considered safe for all analyzed powertrains. 0 5 10 15 20 0 0.1 0.2 0.3 0.4 0.5 0.6 0.7 0.8 Ptr [kW] dSOCnorm[kWh] PFC *=20 kW PFC *=30 kW PFC *=40 kW PFC *=50 kW PFC *=60 kW DH Fig. 3. Maps of normalized dSOC. After having analyzed the physical coherence of proposed rule-based energy management strategies, it is worth remarking how such rules were already proven effective for series hybrid architectures, via suitable comparison with both dynamic programming and genetic algorithm optimization results, as discussed in a previous contribution (Sorrentino et al., 2011). Therefore, it is justified the main proposal of this paper, namely to verify if subsequent denormalization of normalized optimal maps can provide useful contributions, both in terms of reducing the time required for offline development of energy management strategies, as well as enhancing the joint optimization of powertrain sizing and energy management. 0 5 10 15 20 0 0.1 0.2 0.3 0.4 0.5 0.6 0.7 0.8 0.9 1 Ptr [kW] PFCsupplynorm[/] PFC *=20 kW PFC *=30 kW PFC *=40 kW PFC *=50 kW PFC *=60 kW DH Fig. 4. Maps of normalized PFCsupply. 3.2 Maps normalization and denormalization Once vehicle specifications are determined, extension of one of the optimal rules maps presented and discussed in the previous section firstly entails normalizing the x-axis, which represents traction power demand. Such an additional normalization is required to account for the fact that maps developed for lower degrees of hybridization are expected to retain higher extendability features as compared to high DH powertrains, as discussed in the previous section. A first denormalization technique is given by Eq. (17), by dividing average traction power demand by rated power of the reference solution (i.e. PFCref*): * FCref tr norm,tr P P P (17) Then, denormalization can be obtained by simply multiplying the right hand side of Eq. (1) by the PFC* of the vehicle, which the map is extended to: * FC* FCref tr denorm,tr P P P P (18) Regarding the first technique, it is worth noting how the closer norm,trP to 1, the less extendable the associated normalized map will be, as it would cause rated fuel cell power be potentially insufficient both to provide useful traction power, as well as to compensate for trasmission losses (see Eqs. 6 and 7). With this respect it is however worth recalling once again that all optimized maps ensure safe operation for regular passenger cars driven on typical driving paths. The second technique consists in scaling trP with respect to the nominal electric motor power, as follows: * EMref tr norm,tr P P P (19) Denormalization for this second technique is thus given by the following expression: IFAC AAC 2016 June 19-23, 2016. Norrköping, Sweden 381
- 5. Marco Sorrentino et al. / IFAC-PapersOnLine 49-11 (2016) 369–376 373 * EM* EMref tr denorm,tr P P P P (20) As for maps ordinates (see Fig. 3 and Fig. 4), such values are denormalized by referring to the normalization definitions given above (see Eqs. 15 and 16): PP=P * FCnormFCsupply,FCsupply (21) Cap CapdSOC =dSOC BATT BATTref% denorm (22) 4. SIMULATION RESULTS 4.1 Scenario analysis In this section, the above-developed maps, along with related normalization and denormalization techniques, are verified through an extended model-based scenario analysis. The following aims are pursued: assessing the physical adherence of optimized maps; verifying maps extendability to different powertrains, via comparison between fuel economies yielded by optimized and normalized maps; comparing and evaluating the two x-axis normalization techniques. The powertrains examined in this analysis are 15 overall: 5 corresponding to the FCHEVs of Table 2 and further 10, obtained by increasing and decreasing power to weight ratio ( PtW ) by 20 % with respect to Table 2 data, as shown in Table 3. Fuel economies are estimated by deploying the FCHEV model of section 2.2 on the new european driving cycle. Table 3 Cases investigated in the scenario analysis x-axis normalization technique Technique 1 (i.e. Eq. 16) Technique 2 (i.e. Eq. 18) Table 2 specs, corresponding to 058.0PtW A1 A2 070.0PtW B1 B2 046.0PtW C1 C2 The results obtained in cases A1 and A2 are shown in Fig. 5 and Fig. 6. For each powertrain, the color of a series indicates the reference (i.e optimized) map used. The red color indicates the use of an optimized map (PFC*=PFCref*). On the x-axis of the bar graphs there is the value of the rated FC system power, whereas the y-axis provides the simulated fuel-economy (FE) values, here expressed as driven kilometers per kilogram of consumed hydrogen. Fig. 5 and Fig. 6 show that the optimized maps lead to higher FE in most cases. The slight deviations, occurring when adopting normalized maps, are in this case low enough to justify the effectiveness of both normalization techniques proposed for the x-axis of Fig. 3 Fig. 4. It is worth remarking here that by “optimized map” it is only intented to refer to the heuristic maps yielded on output by the specific procedure described in section 3.1. Of course, in some cases such maps can be outperformed by normalized ones, as a consequence of their subsequent implementation on the fluctuating power demand trajectory characterizing every driving cycle. This is due to having developed the maps minimizing the consumption for an assigned average traction power and not introducing an instantaneous power demand. This error is partially absorbed as the heuristic strategy is updated every th time horizon, when implemented for on- board energy management. Moreover, the intrinsic features of series configuration ensure the reliability of energy (i.e. average power)-dependent strategies, as compared to instantaneous optimization algorithms, such as ECMS, which on the other hand require extensive calibration efforts (Sciarretta and Guzzella, 2007; Musardo et al., 2005). This is the reason why the current study mainly focuses on verifying the potentiality of the proposed rule-based control strategy as a specification independent energy management algorithm. In any case, the FE values estimated in the other cases (i.e. B1, B2, C1 and C2, whose detailed bar-plots are omitted here for sake of brevity) confirm that, overall, optimized maps guarantee achieving best performance for most of the 30 simulations associated to Table 3 cases. Moreover, discrepancies between optimized and normalized maps are always bounded within +/-2 %, thus confirming the reliability of the proposed normalization/denormalization techniques. From a physical point of view, the first x-axis normalization technique (expressed by Eq. 17) has to be considered as the most relevant. Indeed, normalizing with respect to the FC system power is more coherent with the intrinsic features of the intelligent thermostatic management enabled by the proposed heuristic control strategy, which decouples the main source of traction energy (i.e. the FC system) from the wheels. Fig. 7 resumes the overall scenario analysis outputs, by illustrating the trajectories of best fuel economy obtained for each powertrain. Such a figure underlines how the lower the power to weight ratio, the more suitable the range-extender like solution (i.e. high degree of hybridization). Within the analyzed range of rated fuel cell system power, the range- extender solution remains the best, although higher power to weight ratio seems justifying the selection of a lower degree of hybridization (i.e. high fuel cell nominal power). It is also worth pointing out how the sudden decrease in fuel economy, in correspondence of higher degree of hybridization, can also be due to the intirinsically “more energetic” energy management enabled by the proposed rule-based strategy. Fuel economies obtained in the reference case, i.e. corresponding to 058.0PtW in Table 3, are in good agreement with values declared by the manufacturer of an FCHEV having similar PtW values (Honda FCX, 2015), IFAC AAC 2016 June 19-23, 2016. Norrköping, Sweden 382
- 6. 374 Marco Sorrentino et al. / IFAC-PapersOnLine 49-11 (2016) 369–376 thus confirming the physical adherence of the proposed heuristic control strategy. 20 30 40 50 60 110 115 120 125 130 FE [km/kg] PFC * [kW] Reference map 20 kW Reference map 30 kW Reference map 40 kW Reference map 50 kW Reference map 60 kW Fig. 5 Case A1 Results. 20 30 40 50 60 110 115 120 125 130 FE [km/kg] PFC * [kW] Reference map 20 kW Reference map 30 kW Reference map 40 kW Reference map 50 kW Reference map 60 kW Fig. 6 Case A2 Results. 20 30 40 50 60 105 110 115 120 125 130 PFC * [kW] FE [km/kg] A1 A2 B1 B2 C1 C2 Fig. 7 Best-case analysis outcomes. 4.2 Comparison with the case Toyota Mirai To confer reliability to the results, this section analyzes the FE reached by an early FCHEV to be mass-produced. The car "Toyota Mirai" reports, among the specifications declared by the supplier (Toyota Mirai, 2015), an FE of 100 km/kg (hydrogen compressed to 700 bar). By relying on the characteristic of specification independency discussed above, the maps shown in Fig. 3 and Fig. 4 are extended, via the first normalization/denormalization technique (see section 3.2), to an FCHEV dimensioned according to Mirai specifications (listed in Table 4). Table 4 Technical specifications of "Toyota Mirai" FCHEV PEM* [kW] 113 PFC* [kW] 114 Battery capacity [kWh] 1.6 Autonomy [km] 500 Fuel-economy [km/kg] 100 Dimensions [mm] 4890x1815x1535 Mass [kg] 1850 Power/weight [kW/kg] 0.061 More in detail, a parametric analysis was carried out by varying not only the degree of hybridization, but also the time horizon th. The latter variable was selected according to the outcomes of previous analyses (Sorrentino et al., 2011), which highlighted its relevance when deploying the proposed heuristic strategy (see section 3) in real-world applications. Fig. 8 illustrates main outcomes of the proposed analysis, which contributes to further verifying the physical coherence of the proposed specification independent control strategy. Particularly, the very low degree of hybridization of this vehicle (see Table 4) requires very short time horizon to achieve fuel economies that are comparable to those declared by the manufacturer. This was expected since, as discussed above, the heuristic strategy here adopted is mainly traction- energy driven, whereas lower DH vehicles would require a more power driven approach, such as ECMS. Nonetheless, in some cases (e.g. PFC*=60 kW), the heuristic control strategy achieves appreciable fuel economies, whose discrepancy (around 15 %) with respect to declared values can be easily justified: in particular, some key uncertainties remain when trying to simulate a Mirai equivalent FCHEV, such as the expected differences between real vehicle and the model of section 2, mainly related to components unit mass and key performance metrics (e.g. fuel cell system efficiency). 20 30 40 50 60 70 75 80 85 90 95 PFCref * [kW] FE [km/kg] th1 = 1 s th2 = 300 s th3 = 600 s Fig. 8 Analysis of Toyota Mirai fuel economy estimates. 4.3 SOC analysis As a further proof of validation of the proposed specification independent methodology, in this section the advantages of IFAC AAC 2016 June 19-23, 2016. Norrköping, Sweden 383
- 7. Marco Sorrentino et al. / IFAC-PapersOnLine 49-11 (2016) 369–376 375 heuristic strategy with respect to a simple thermostatic control (TC) are investigated. Particularly, the difference (ΔSOC) between state of charge values at the beginning and end of the driving cycle is estimated, so as to enable accurate evaluation of charge sustaining capability of both strategies. The parameter to be assessed and compared is the residual battery energy that was extra-discharged or extra-charged, depending on ΔSOC sign: BATTBATT CapSOCE (23) In Table 5 it is compared the EBATT obtained in scenario A1 with that achieved using the following maps constants (i.e. TC strategy): 01.0dSOC P525.0P * FCTC,plysupFC (24) where the value assumed for supplied FC system power corresponds to maximum efficiency (Sorrentino et al., 2013). The numbers in bold refer to EBATT achieved with optimized maps. Table 5 EBATT analysis outcomes [kWh] PFC* (kW) 20 30 40 50 60 PFCref*(kW) 20 0.006 -0.007 0.053 0.152 0.168 30 -0.055 0.020 0.069 0.080 0.297 40 -0.347 -0.271 -0.066 0.029 0.327 50 -0.456 -0.401 -0.261 0.126 0.055 60 -0.474 -0.499 -0.320 -0.185 0.231 TC -0.461 -0.315 0.353 0.078 0.297 As expected, in none of the simulations it is accomplished an EBATT equal to zero. It is worth noting that such extra consumption is accounted for as an equivalent hydrogen consumption (Sorrentino et al., 2013). When the degree of hybridization is high, the maps optimized and normalized achieve close results, with EBATT values having a much lower order of magnitude as compared to TC solution. For PFC*=50 kW and PFC*=60 kW, minimum EBATT values are still obtained with heuristic strategy, this time adopting normalized maps (i.e. PFCref*=40 kW and PFCref*=50 kW, respectively). In terms of FE, the results obtained with the TC strategy are reasonably close to those obtained with either normalized or optimized maps. Nevertheless, the much higher EBATT discrepancy makes equivalent hydrogen consumption adaptation less reliable, a drawback which adds uncertainity when applying TC strategy to the next driving cycle. 5. CONCLUSIONS By optimizing heuristics rules on powertrains dimensioned via model-based approach, control strategies are obtained for on-board energy management of FCHEVs. Such strategies, by adopting suitable normalization/denormalization techniques, were proven to be highly specification independent, thus being extendable to different vehicle configurations. Extensive model-based analyses were presented and discussed, aiming at demonstrating the physical adherence of heuristic rules and related fuel economy outcomes, on one hand, and, on the other hand, the reliability and effectiveness of proposed normalization/denormalization techniques. Particularly, when adopting either optimized or normalized map, it was shown as fuel economies are generally in favor of a range-extender like design, whereas the analysis of charge sustaining capabilities evidences the benefits of adopting optimized heuristic rules rather than over-simple, non- optimized thermostatic strategy. The comparison with the case of Toyota Mirai shows the practical utility of the proposed methodology, in particular for the preliminary design of the electrical components of a hybrid fuel cell powertrain, in addition to confirming the ability to exploit the features of specification independency for the subsequent extension to other vehicle configurations. As for further areas of potential application of the proposed methodology, it is worth mentioning its usefulness for reducing the time for off-line development of control strategies. Indeed, it could be possible to develop a specification-independent control strategy on one powertrain and, afterward, extend its applicability to other degrees of hybridization via the proposed normalization/denormalization techniques. Moreover, the extension can include, beyond increasing or decreasing the degree of hybridization, also the use of more advanced technologies, such as lighter or more efficient fuel cell systems, and/or even some design modifications (e.g. switching from high-power to high- energy batteries and viceversa). REFERENCES Agbli, K.S., Hissel, D., Sorrentino, M., Chauvet, F., Pouget, J. (2016). Reverse engineering of a railcar prototype via energetic macroscopic representation approach. Energy Conversion and Management, volume (112), 61–80. Arsie, I., Di Domenico, A., Pappalardo, L., Pianese, C., Sorrentino, M. (2006). Steady-state analysis and energetic comparison of air compressors for PEM fuel cell systems. In: Proceedings of the 4th International Conference on Fuel Cell Science, Engineering and Technology.19-21 June 2006, Irvine, CA, USA. Environmental Protection Agency. (1200 Pennsylvania Ave., Washington D.C., USA , April 15, 2014). Inventory of U.S. Greenhouse Gas Emissions and Sinks: 1990-2012. Technical Report. Greene, D.L., Lin, Z. and Dong, J. (2013). Analyzing the sensitivity of hydrogen vehicle sales to consumers’ preferences. International journal of hydrogen energy, volume (38), 15857-15867. Honda FCX (2015), online at https://en.wikipedia.org/wiki/ Honda_FCX. Hung, Y.H., Wu, C.H. (2013). A combined optimal sizing and energy management approach for hybrid in-wheel motors of EVs. Appl Energy, volume (108), 236–47. IFAC AAC 2016 June 19-23, 2016. Norrköping, Sweden 384
- 8. 376 Marco Sorrentino et al. / IFAC-PapersOnLine 49-11 (2016) 369–376 Katrašnik, T. (2013). Impact of vehicle propulsion electrification on Well-to-Wheel CO2 emissions of a medium duty truck. Appl Energy, volume (108), 236–47. Klell, M. (2010). In: M. Hirscher (Ed.), Handbook of Hydrogen storage: New Materials for Future Energy Storage, 32-35. Wiley-VCH Verlag, Weinheim. Musardo, C., Rizzoni, G., Guezennec,Y., Staccia, B. (2005). A-ECMS: An adaptive algorithm for hybrid electric vehicle energy management. European Journal of Control, volume (11), 509–524. Nelson, P., Amine, K. , Rousseau, A. (2007). Advanced Lithium-ion Batteries for Plug-in Hybrid-electric Vehicles. Available at: www.transportation.anl.gov/ pdfs/HV/461.pdf. Onat, N.C., Murat, K.M., Omer, T.O. (2015). Conventional, hybrid, plug-in hybrid or electric vehicles? State-based comparative carbon and energy footprint analysis in the United States. Appl Energy, volume (150), 36–49. Rousseau, A., Sharer, P. , Ahluwalia, R. (2004). Energy storage requirements for fuel cell vehicles. In: SAE Paper 2004-01-1302, Proceedings of the SAE 2004 World Congress & Exhibition. March 2004, Detroit, MI, USA. Sciarretta, A., Guzzella, L. (2007). Control of hybrid electric vehicles. IEEE Control Systems Magazine, volume (27), 60–70. Sorrentino M., Rizzo G., Arsie I. (2011). Analysis of a rule- based control strategy for on-board energy management of series hybrid vehicles. Control Engineering Practice, volume (19), 1433–1441. Sorrentino, M., Maiorino, M., Pianese, C. (2013). An integrated mathematical tool aimed at developing highly performing and cost-effective fuel cell hybrid vehicles. Journal of Power Sources, volume (221), 308- 317. Sorrentino, M., Rizzo, G., Sorrentino, L. (2014). A study aimed at assessing the potential impact of vehicle electrification on grid infrastructure and road-traffic green house emissions. Applied Energy, volume (120), 31-40. Sorrentino, M., Mauramati, F., Arsie, I., Cricchio, A., Pianese, C., Nesci, W. (2015). Application of Willans Line Method for Internal Combustion Engines Scalability towards the Design and Optimization of Eco-Innovation Solutions. SAE Technical Paper 2015-24-2397, doi:10.4271/2015-24-2397. Thomas, C.E. , James, B.D., Lomax Jr., F.D. (1998). Market penetration scenarios for fuel cell vehicles. International Journal of Hydrogen Energy, volume (23), 949-966. The Fuel Cells and Hydrogen Joint Undertaking (2015). FCH2-JU 2015 calls - ANNEX I Work Plan 2015 – Part I Operations, online at http://www.fch.europa.eu/sites/ default/files/h2020-wp15-fch_en.pdf. Toyota Mirai (2015), online at https://en.wikipedia.org/wiki/ Toyota_Mirai. IFAC AAC 2016 June 19-23, 2016. Norrköping, Sweden 385